
2003 IFT Membership & Employment Salary Survey
Median salaries for IFT members continue to increase, reaching $73,150, while membership demographics and employment status remain essentially unchanged.

DUE TO THE SIZE AND AMOUNT OF GRAPHICS USED IN THIS ARTICLE, IT IS SUGGESTED THAT YOU DOWNLOAD THE PDF VERSION FOR BETTER USEABLITY.
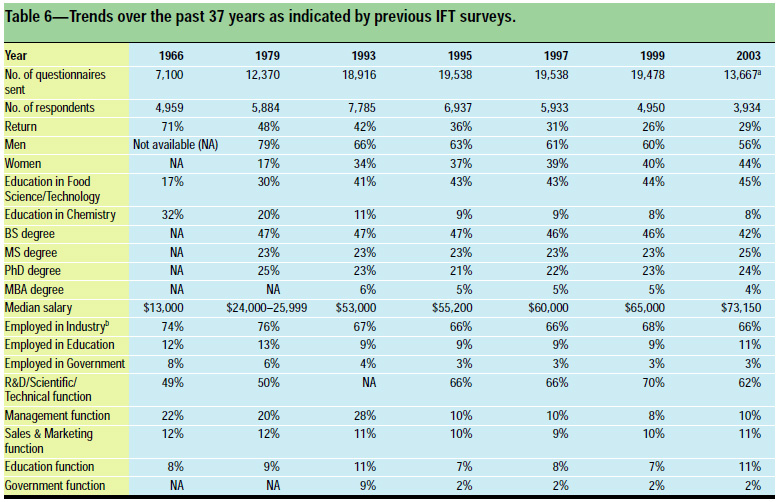
Members of the Institute of Food Technologists earned a median salary of $73,150 in late 2003, a 12.5% increase from the $65,000 in 1999, according to the results of a recent IFT Membership Employment & Salary Survey.
IFT is a nonprofit professional scientific society whose 26,000 members worldwide are active in all aspects of the food field, including industry, government, and academia. IFT has conducted a survey of salaries and employment status among its members in the United States periodically over the past four decades and every two years since 1993, with the exception of 2001 when it conducted a Starting Salary Survey instead. The previous surveys were conducted by mail, but the Starting Salary Survey and the present survey were conducted electronically. For the current survey, an e-mail invitation to participate was sent in November 2003 to the 14,704 IFT Members and Professional Members in the U.S. who had Internet access. The e-mail message provided instructions on how to access a 32-question survey on the Internet.
The results were kept completely anonymous and confidential, and all returns were tabulated by Data-Lab Corp, Niles, Ill. By the cutoff date, 3,934 responses from 13,667 delivered questionnaires had been received, for a 28.8% return.
This article reports summary results in three sections—IFT membership demographics, employment data, and median salary data. The salary data are provided only for full-time employees and base sizes of 10 or more respondents. Illustrations are not drawn to scale, and percentages may add up to more than 100% because of rounding.
--- PAGE BREAK ---
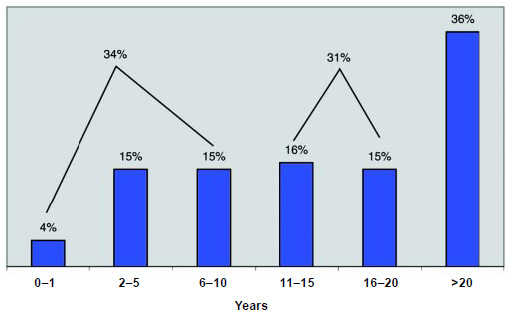
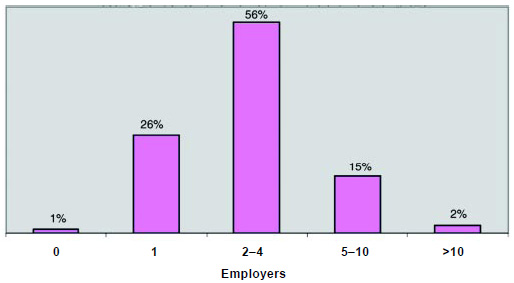
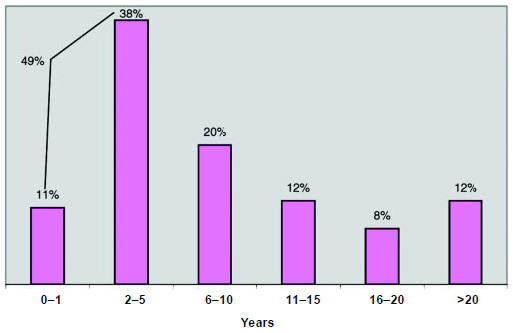
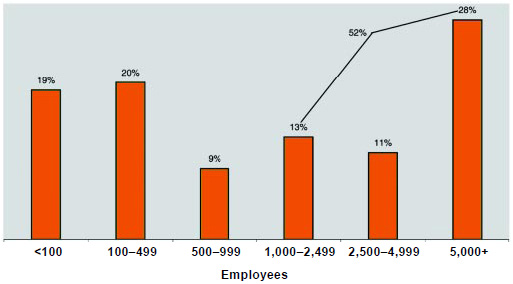
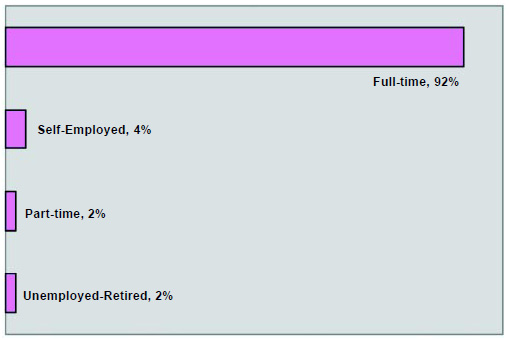
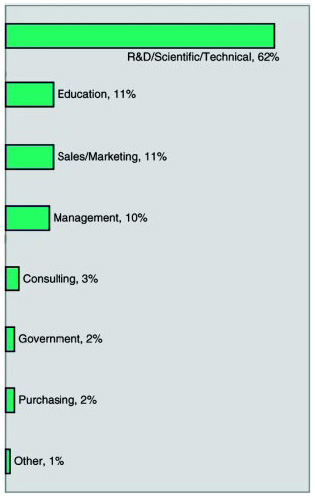
Employment Data
The results related to employment status have remained basically unchanged since 1993.

--- PAGE BREAK ---
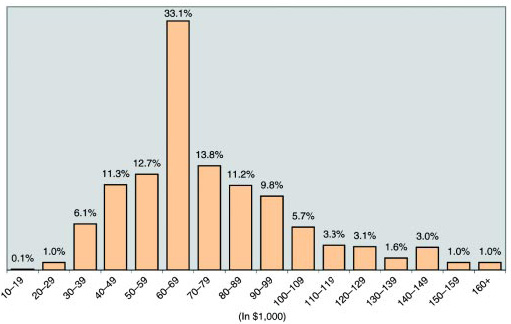
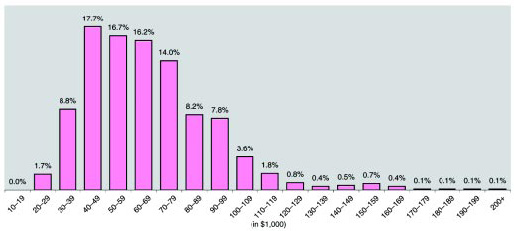
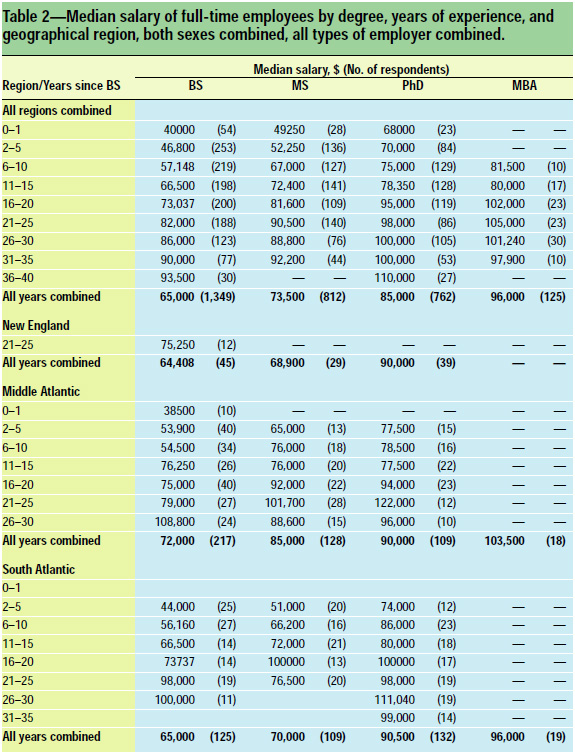
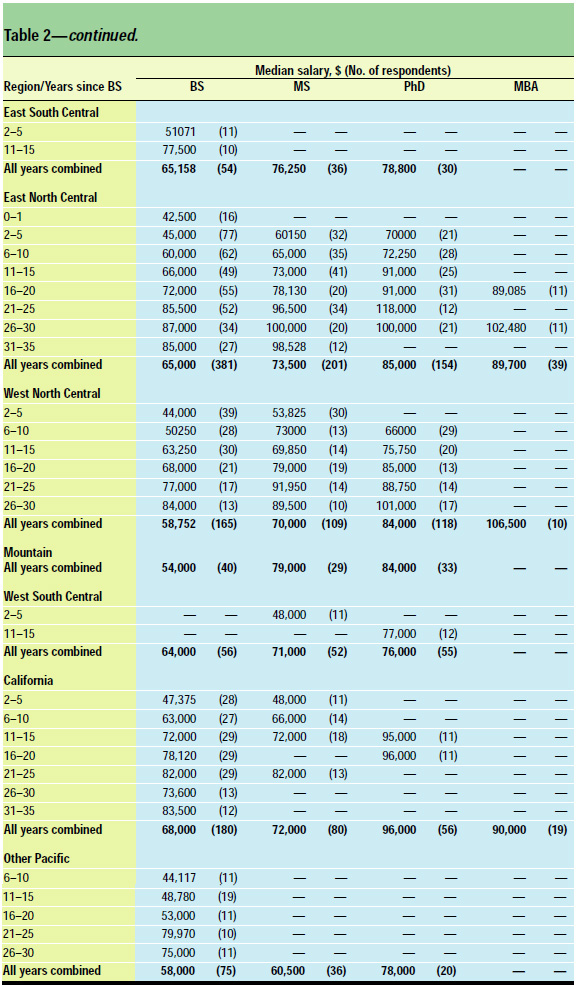
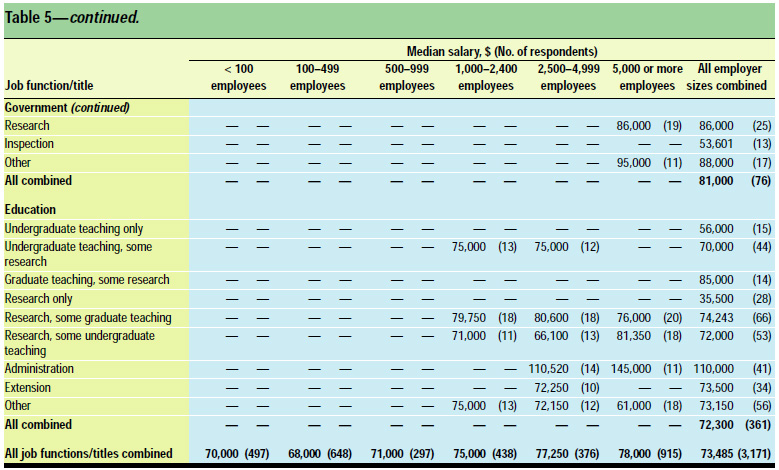
Salary Data
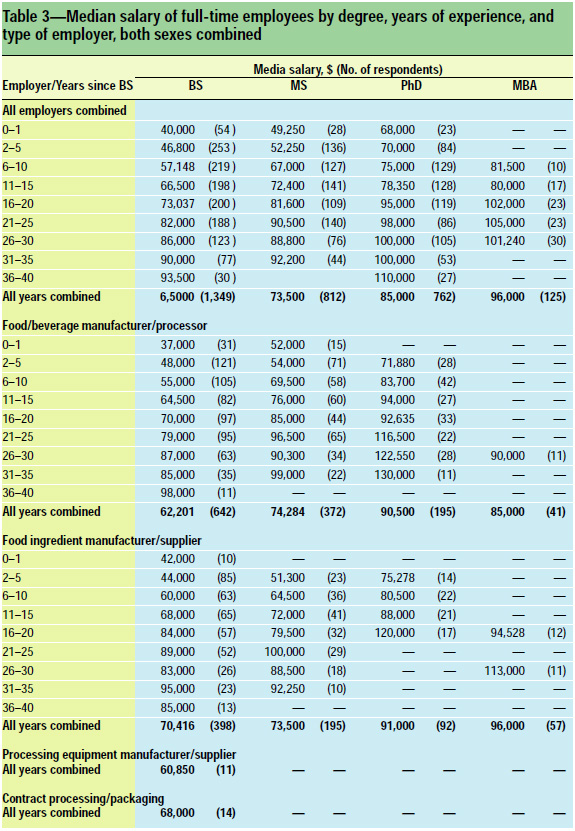
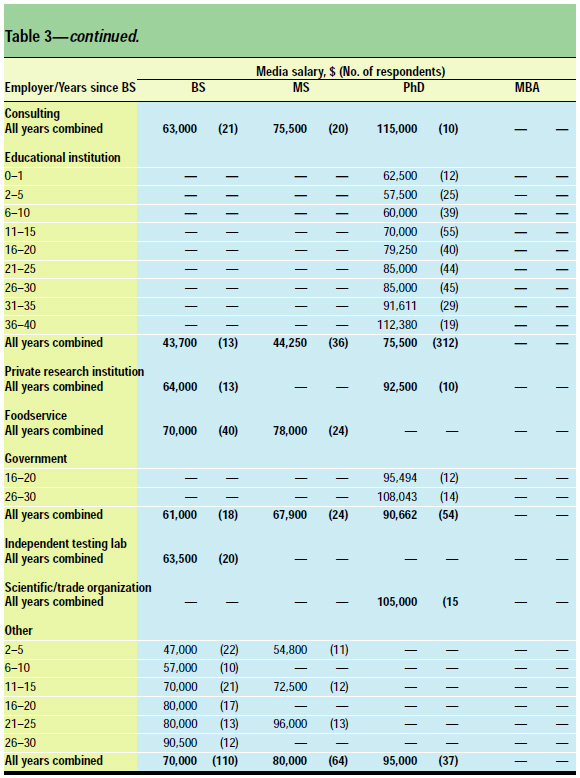
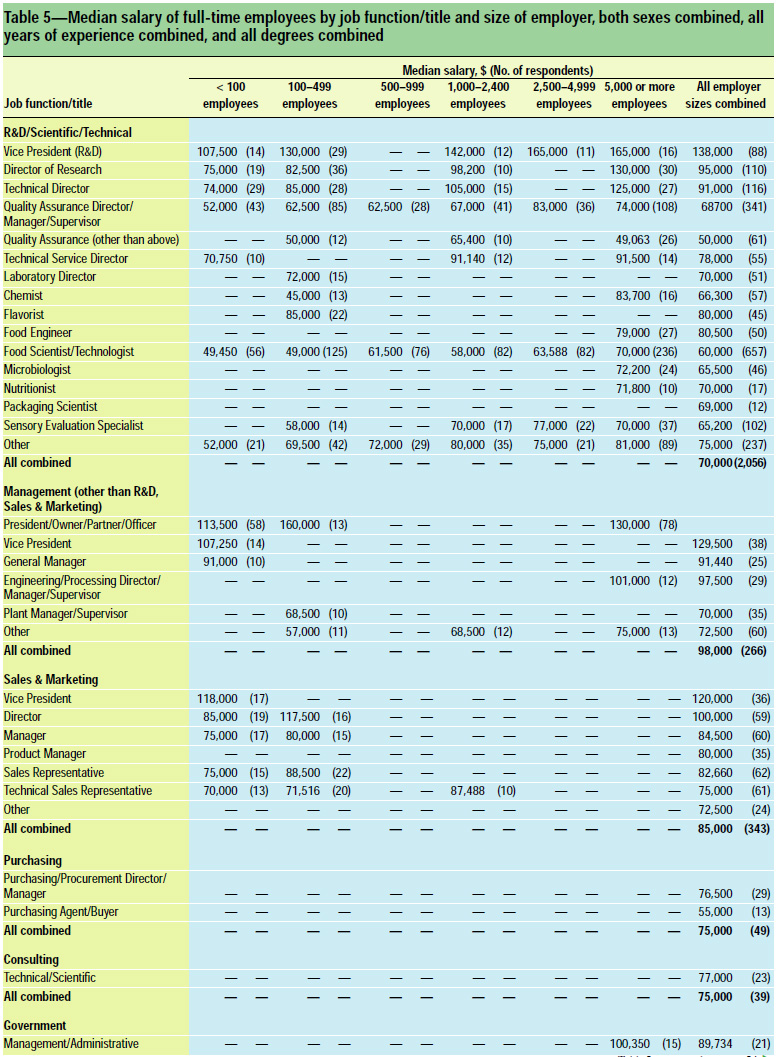
Full-time salaries below $10,000 and salaries of $300,000 or more for persons with less than 6 years of professional foodrelated experience were eliminated from the tabulations, since they appear to be unrealistic. Only salary data for full-time employees and for 10 or more respondents are presented here. The data are presented in terms of the median salary, meaning that half of the respondents make more than that amount and half make less.
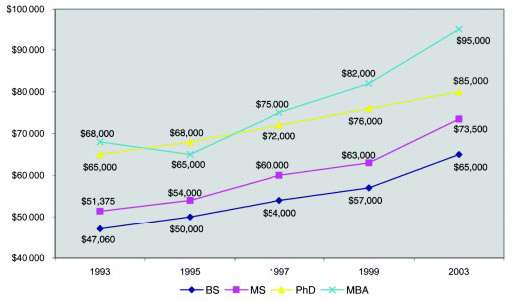
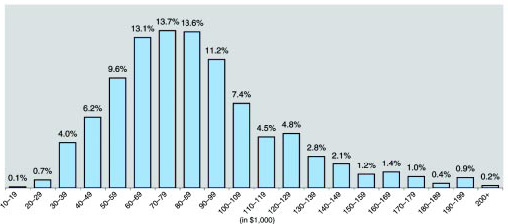
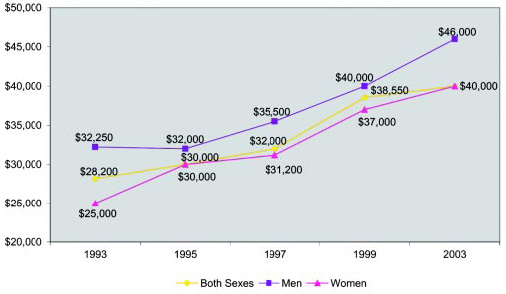
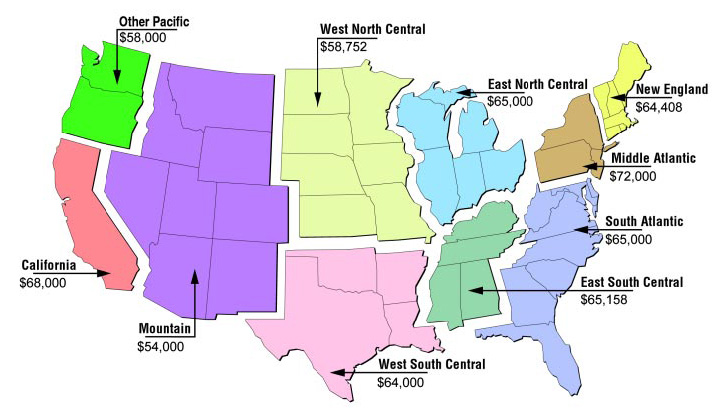
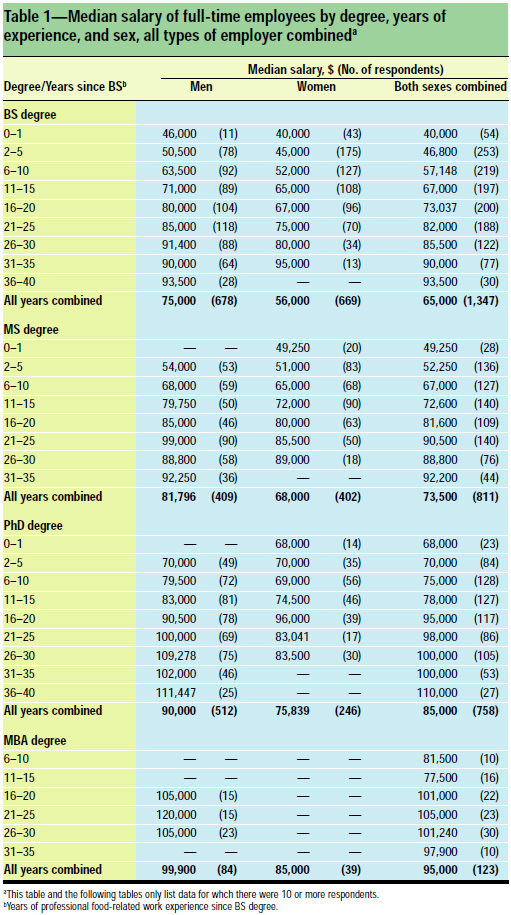
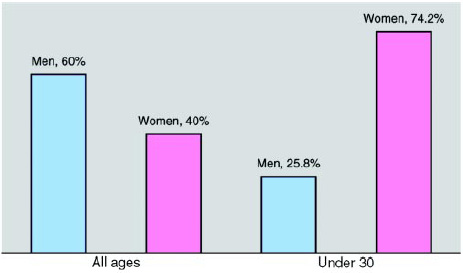
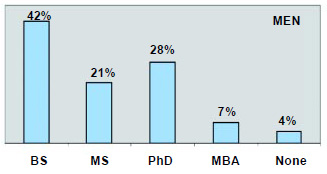
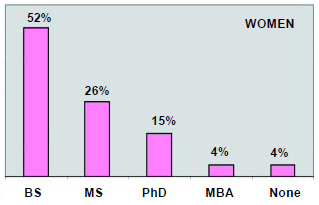
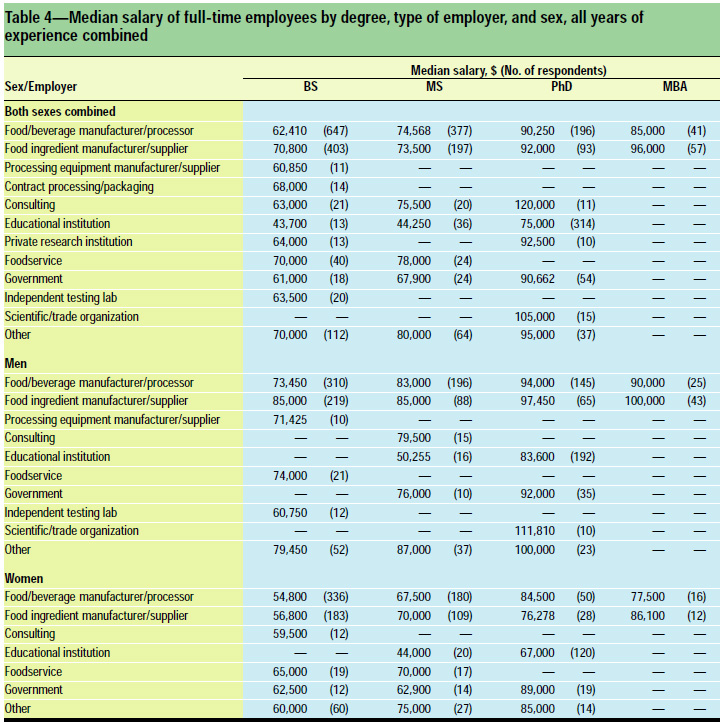
Salary increases with degree obtained and years of experience; but with the same degree and years of experience, men generally make more than women.
Part of the difference in median salaries for men and for women may be due to the fact that men have been working in the food field longer than women and therefore tend to have higher salaries. Nevertheless, men appear to receive higher salaries for the same degrees and years of experience.
--- PAGE BREAK ---
About the Author
