2007 IFT Membership & Employment Salary Survey
The median salary for IFT members rose 7.7% to $84,000 over the past two years, but salaries for women continue to lag behind those for men.
 The surveys were conducted by mail prior to 2001 and via the Internet since then. For the current survey, an e-mail invitation to participate was sent in October 2007 to the 11,139 IFT Members and Professional Members in the U.S. for whom we had valid e-mail addresses. The e-mail message provided instructions on how to access a 33-question survey on the Internet. The results were kept completely anonymous and confidential, and all returns were tabulated by Data Lab Corp., Niles, Ill. By the cutoff date, 3,078 responses had been received, for a 27.6% return.
The results are presented below in three sections—membership demographics, employment data, and salary data. Illustrations are not drawn to scale, and percentages may add up to more or less than 100% because of rounding.
Demographics
Table 1 summarizes some of the trends in survey results over the past 41 years. Overall, the demographics of the IFT membership, as represented by the respondents to the surveys, have remained essentially the same over the years, with certain exceptions:

- The number of questionnaires sent has decreased. The substantial decrease in number of questionnaires after 1999 is due partially to a slight decline in membership and to the fact that the 1999 and earlier surveys were sent to all Members and Professional Members in the U.S. by mail but the subsequent surveys were sent only to those whose e-mail addresses were known.
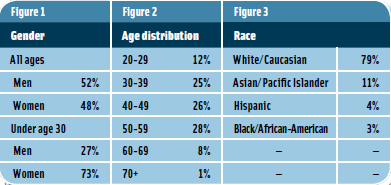
- The number of women has continued to increase. They represent nearly half of the respondents and three-fourths of those under age 30 (Figure 1). Here are some other demographic highlights from the 2007 survey results:.
- Nearly two-thirds of the respondents are under age 50 (Figure 2).
- More than three-fourths of the respondents are White/ Caucasian, followed next by Asian/ Pacific Islanders (Figure 3).
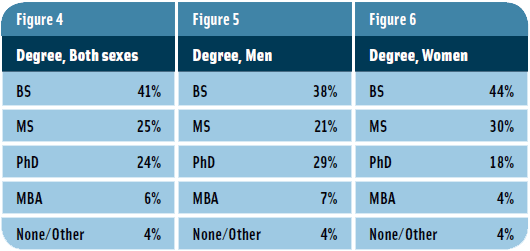
- More than half of the respondents—and more men than women—have advanced degrees (Figures 4–6).
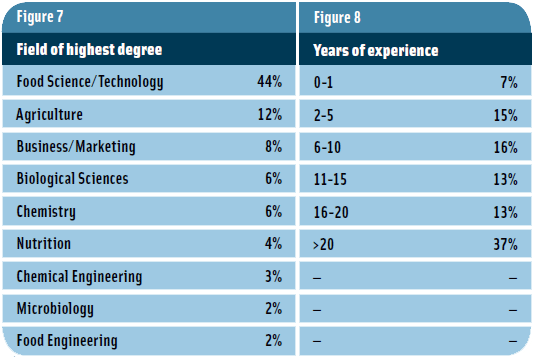
- Nearly half of the respondents obtained their highest degree in Food Science/Technology, with the next highest area being Agriculture (Figure 7). The fact that about 36% of the respondents obtained their BS degree in Food Science/Technology indicates that some respondents switched their major to Food Science/Technology for their higher degrees.

--- PAGE BREAK ---
Employment
- Approximately one-third of the respondents have had less than 11 years of professional food-related work experience since receiving their BS degree, and approximately one-third have had more than 20 years of experience (Figure 8).
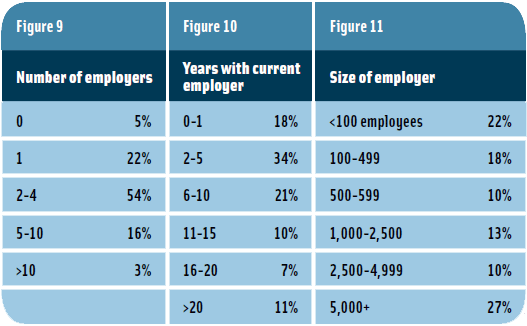
- Three-fourths of the respondents have worked for more than one employer, and more than half have had 2–4 employers (Figure 9). • Half of the respondents have worked for their current employer for less than 6 years (Figure 10).
- Half of the respondents work for companies with fewer than 1,000 employees; one-fourth for companies with more than 5,000 employees (Figure 11).
- The great majority (93%) of the respondents are employed full-time.
- Nearly two-thirds of the respondents (63%) work in the R&D/Scientific/Technical category, while 10% are employed in Management, 9% in Sales/ Marketing, 9% in Education, 3% in Consulting, 2% in Government, and 1% in Purchasing.
- More than two-thirds of the respondents work for food and beverage companies and ingredient suppliers, with the next largest percentage working in academia (Figure 12).
- Of those employed in academia, 91% work for public educational institutions; 40% are full professors, 17% associate professors, and 14% assistant professors; 60% have been granted tenure; and 14% are on tenure track.
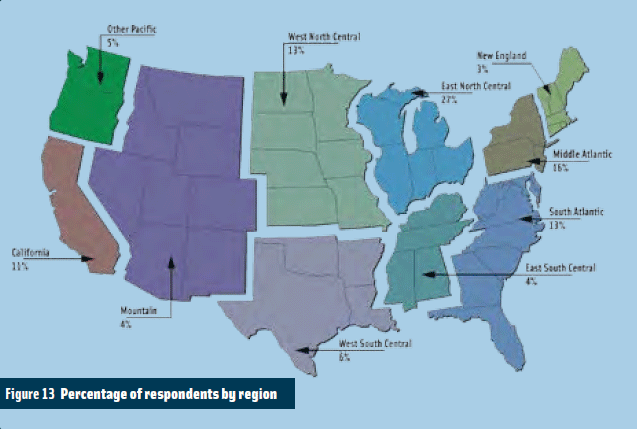
- Two-thirds of the respondents work in states east of the Mississippi River, one-third on the East Coast (Figure 13). Of the U.S. Census Bureau’s geographic divisions of the U.S., the East North Central region— Wisconsin, Illinois, Indiana, Michigan, and Ohio—has the highest percentage of respondents.
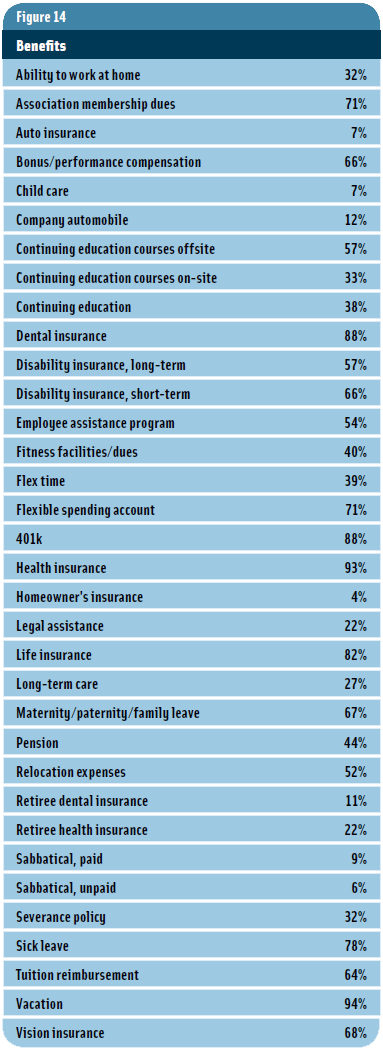
- Most employers provide the basic benefits such as health insurance, vacation, 401k, etc. (Figure 14).
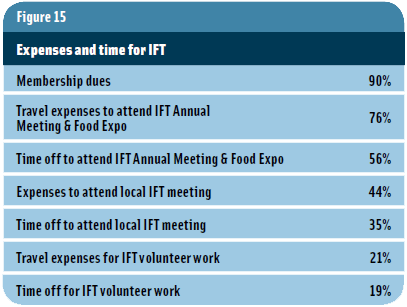
- The majority of employers pay for IFT dues for their employees and give their employees travel expenses and time off to attend the IFT Annual Meeting & Food ExpoSM, but fewer provide expenses and time off to attend local IFT meetings or do IFT volunteer work (Figure 15).


--- PAGE BREAK ---
Salaries
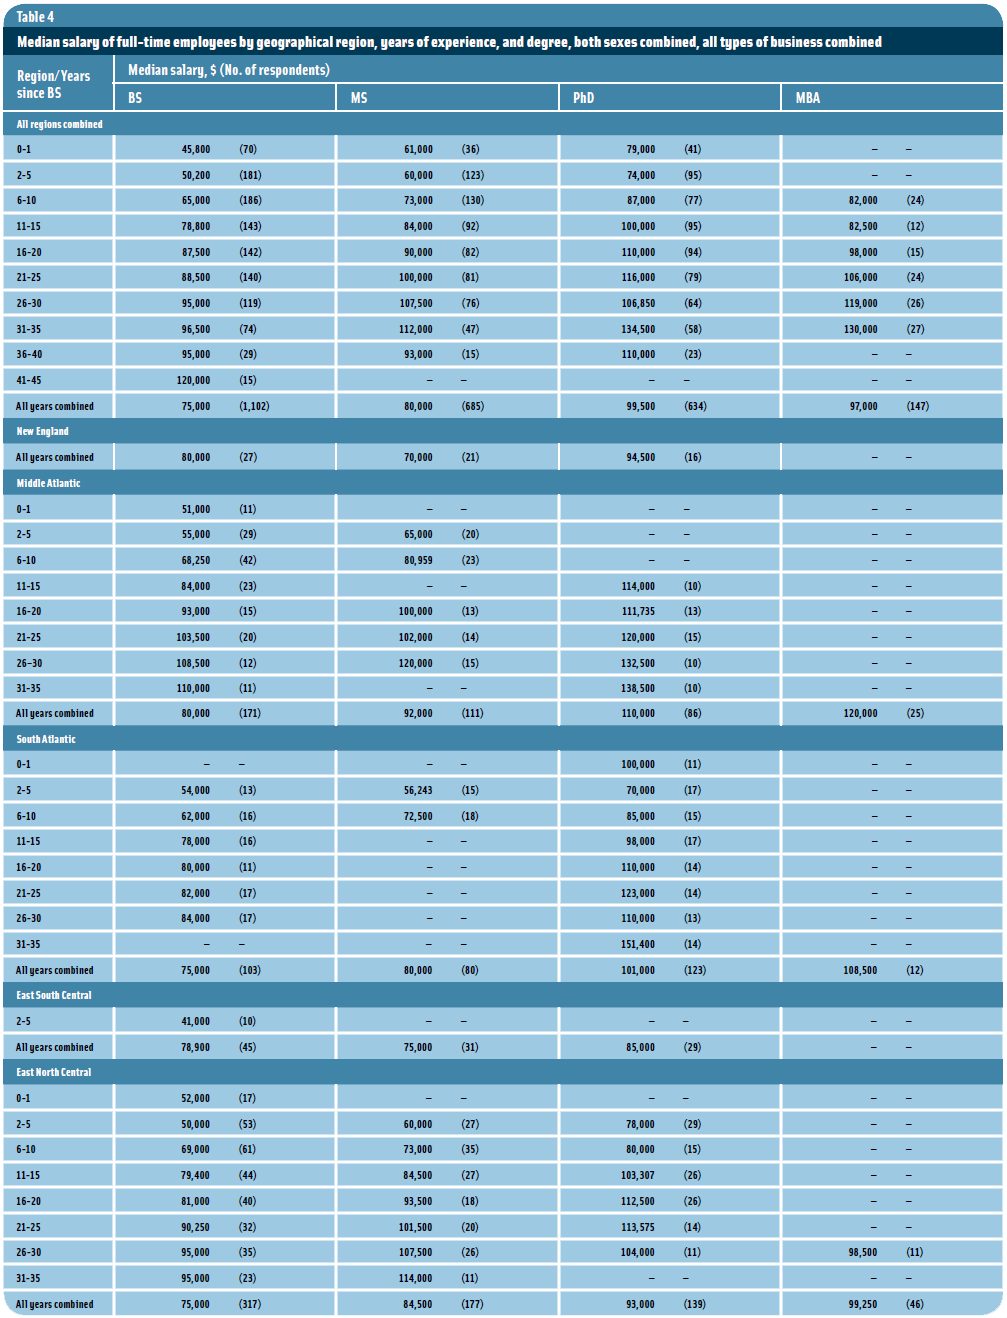
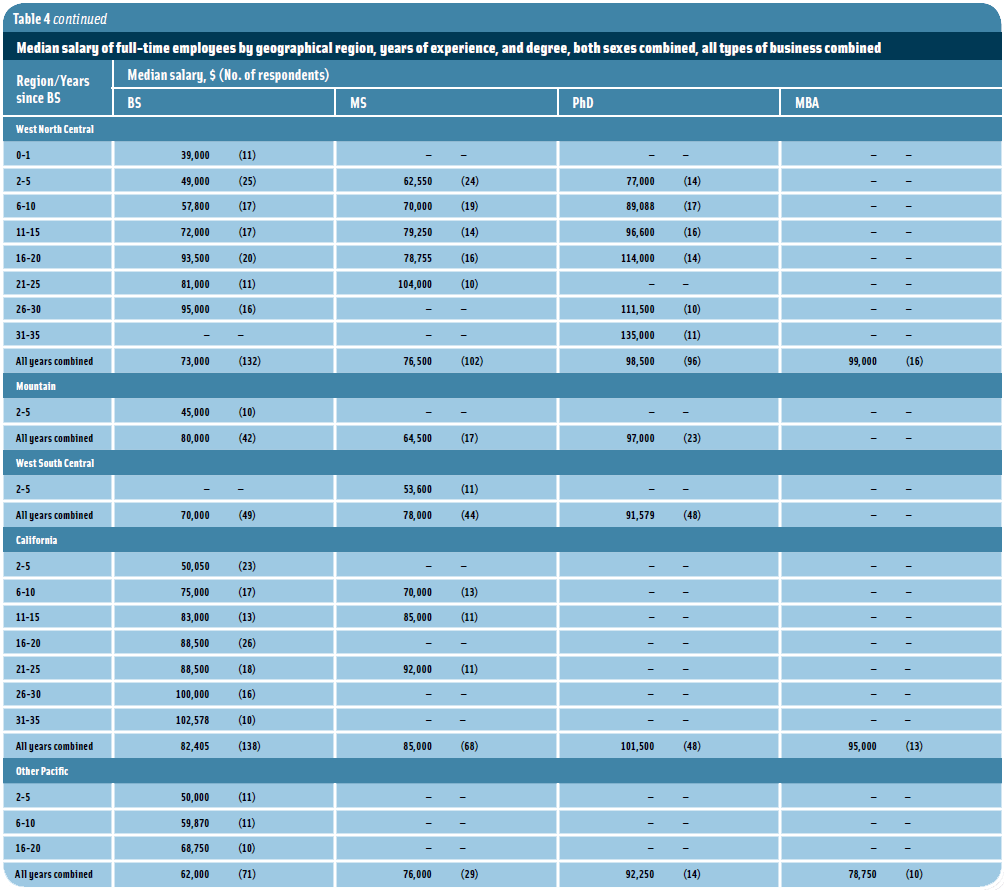
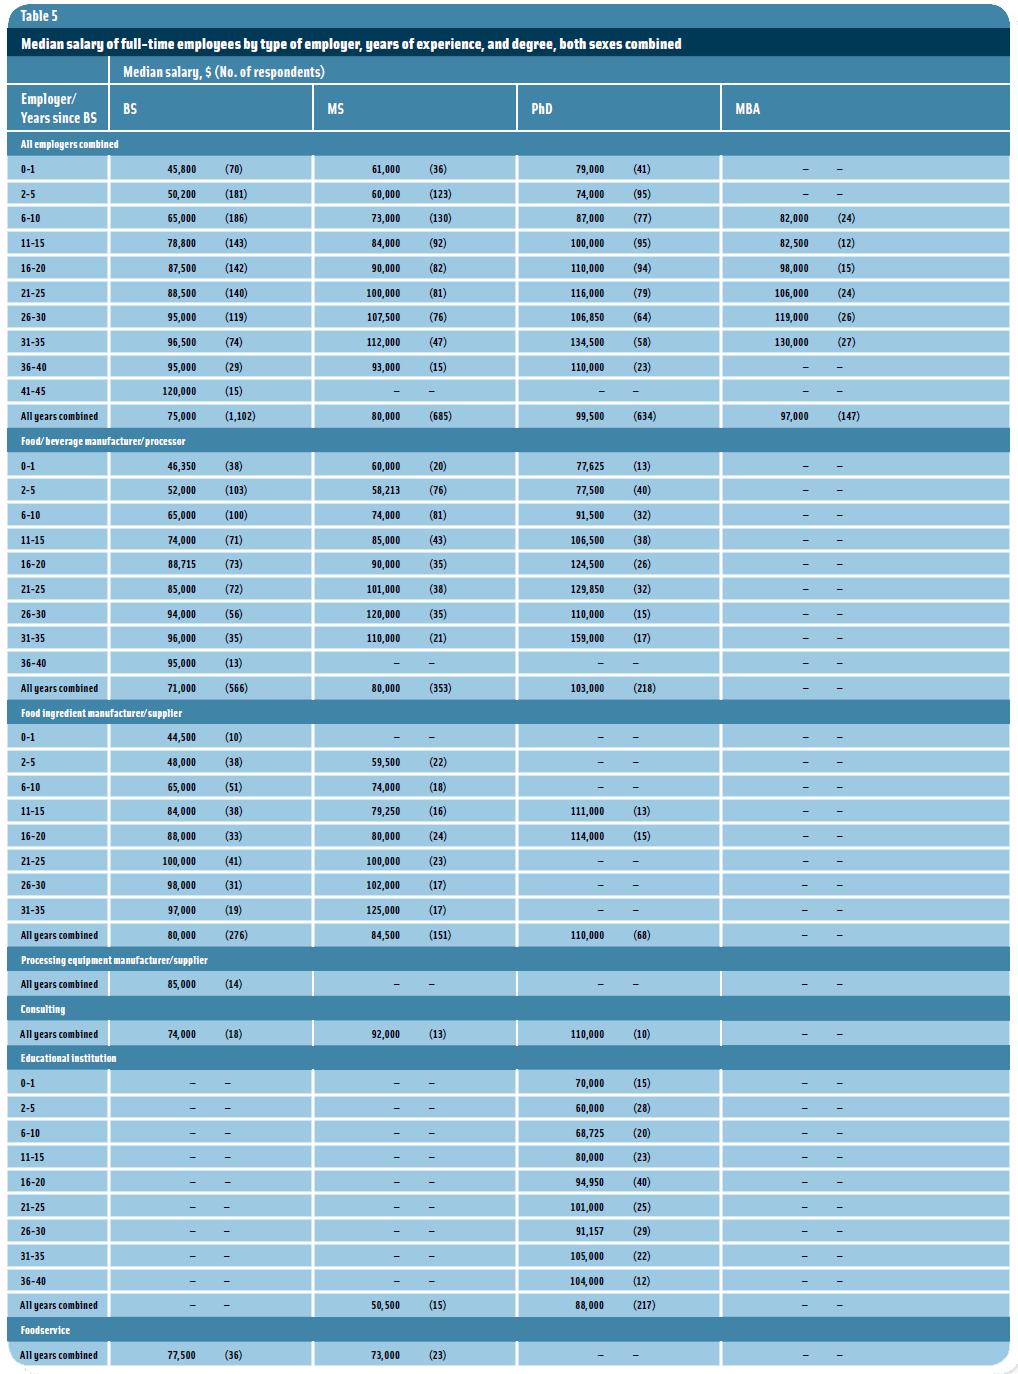
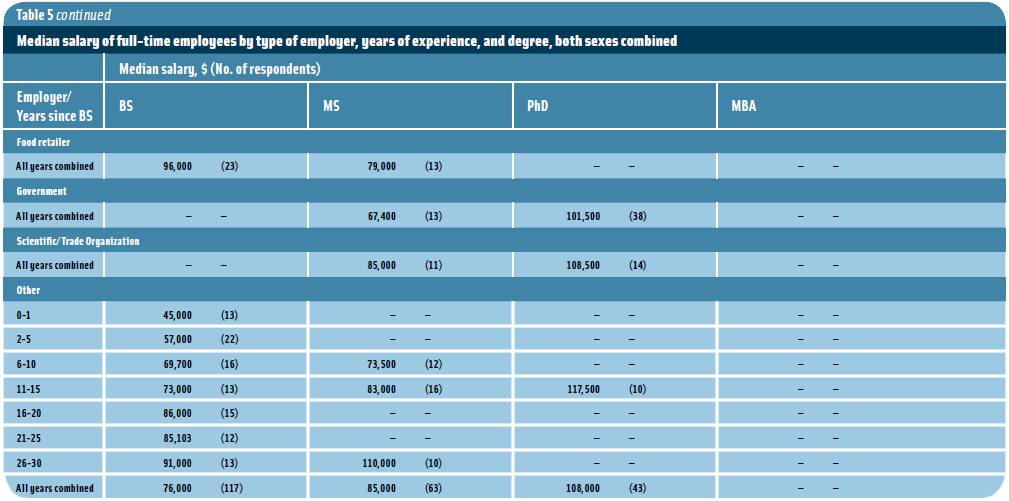
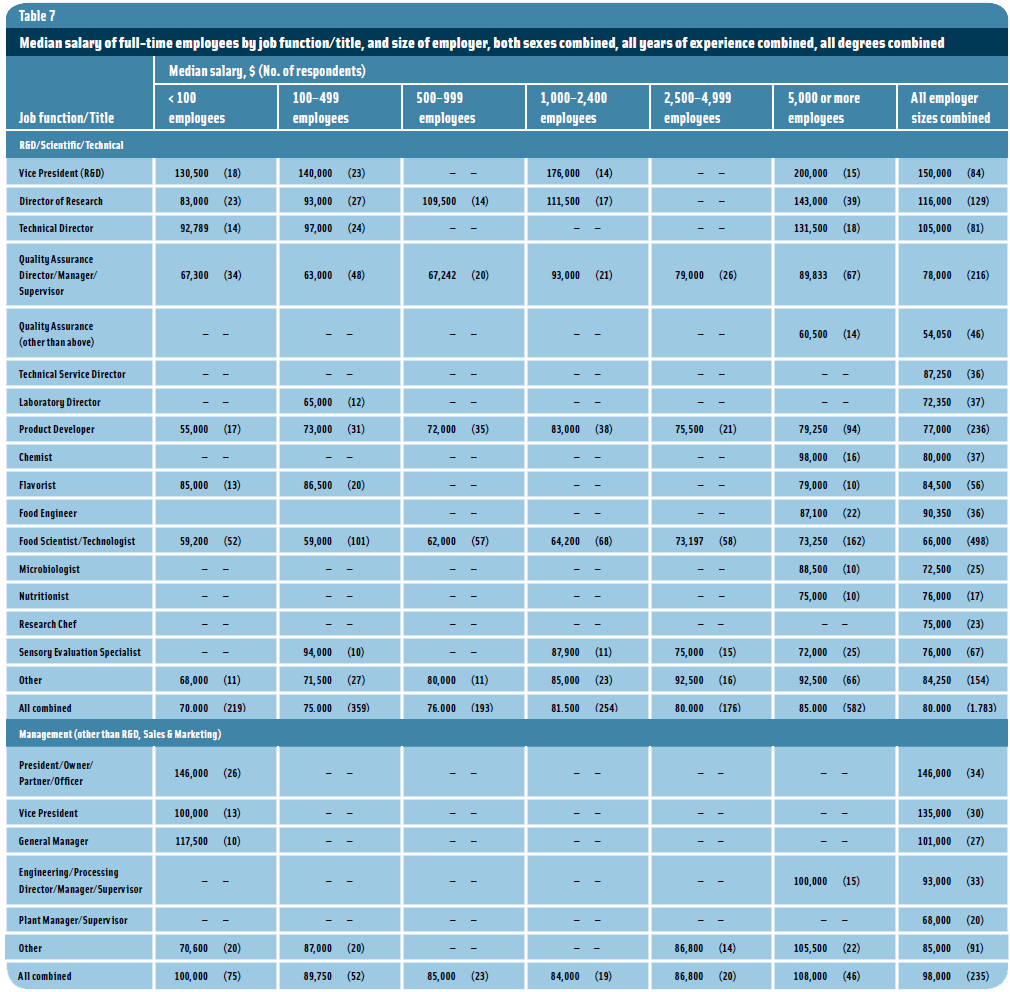
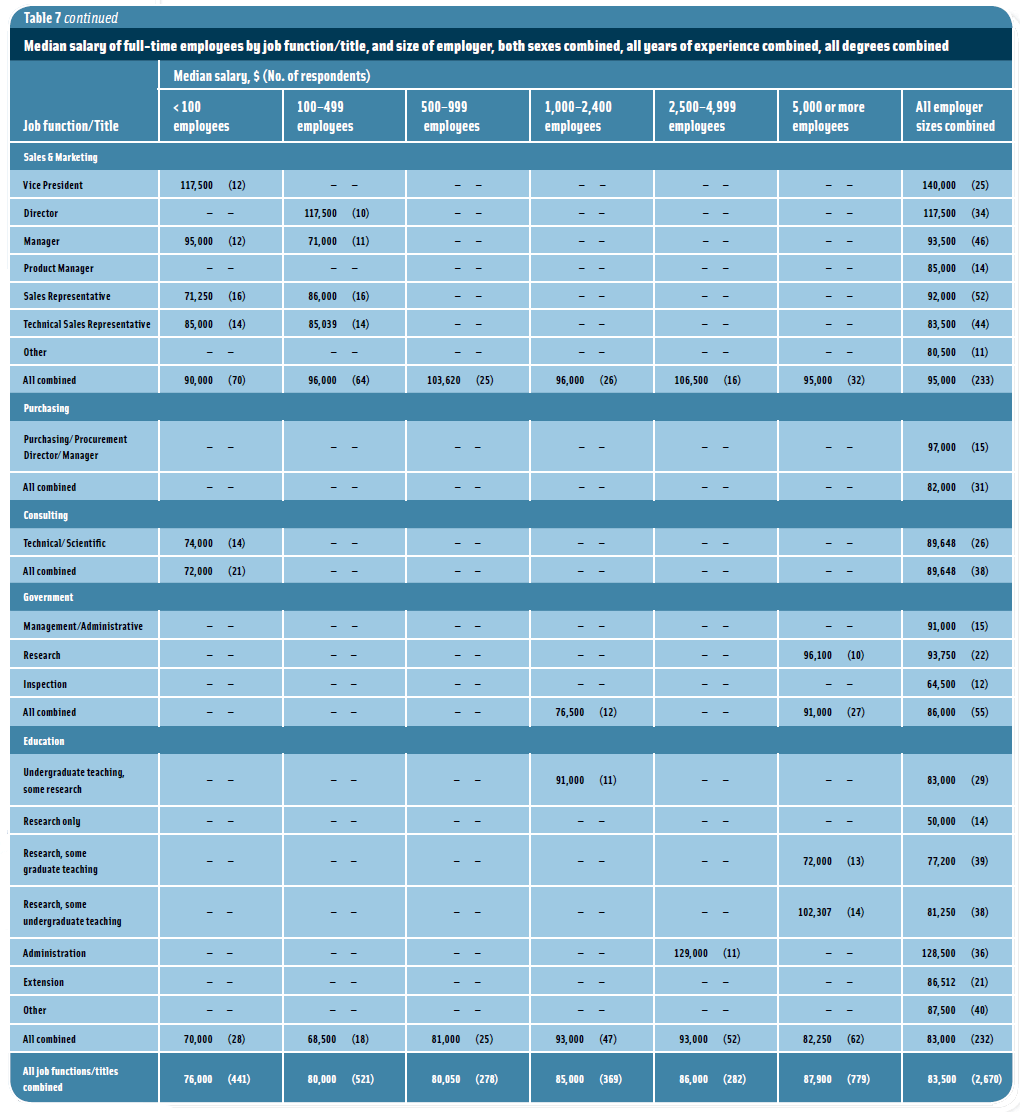
This article reports salary data only for full-time employees. The data are reported as the median salary, meaning that half of the respondents make more than that amount and half make less. Full-time salaries below $10,000 and salaries of $300,000 or more for persons with less than 6 years of professional food-related experience were eliminated from the tabulations, since they appear to be unrealistic.
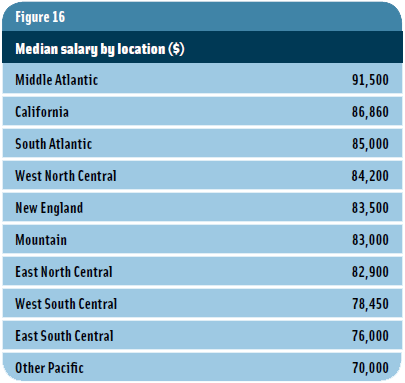
- The Middle Atlantic and California regions had the highest median salaries (Figure 16).
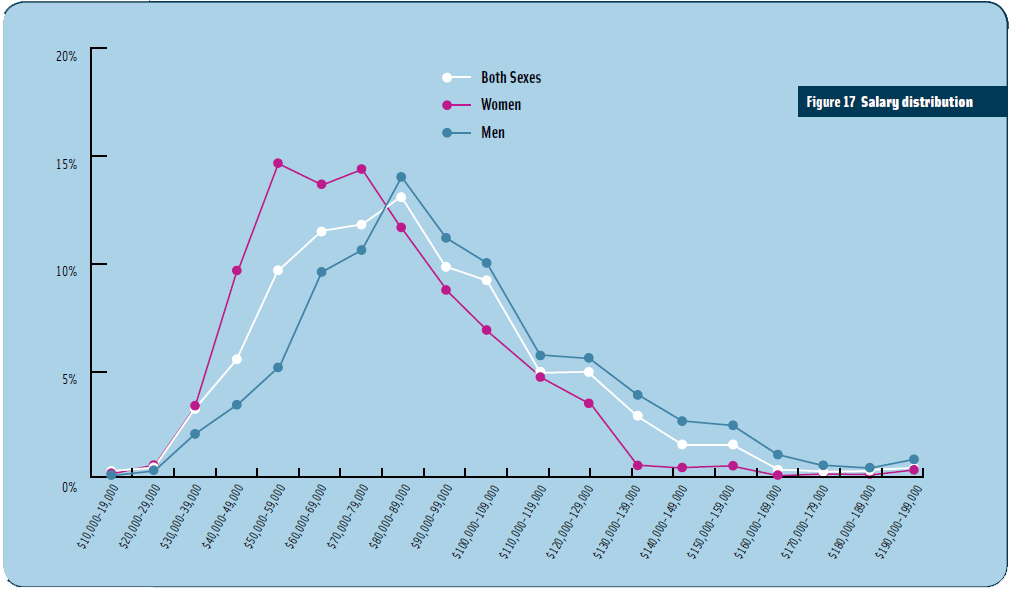
- The distribution of median salaries is shown in Figure 17. Salaries for both sexes combined ranged from $10,800 to $397,000, but 80% were below $115,000 and 99% were below $225,000. The median salary for both sexes combined was $84,000, a 7.7% increase from the $78,000 in 2005.
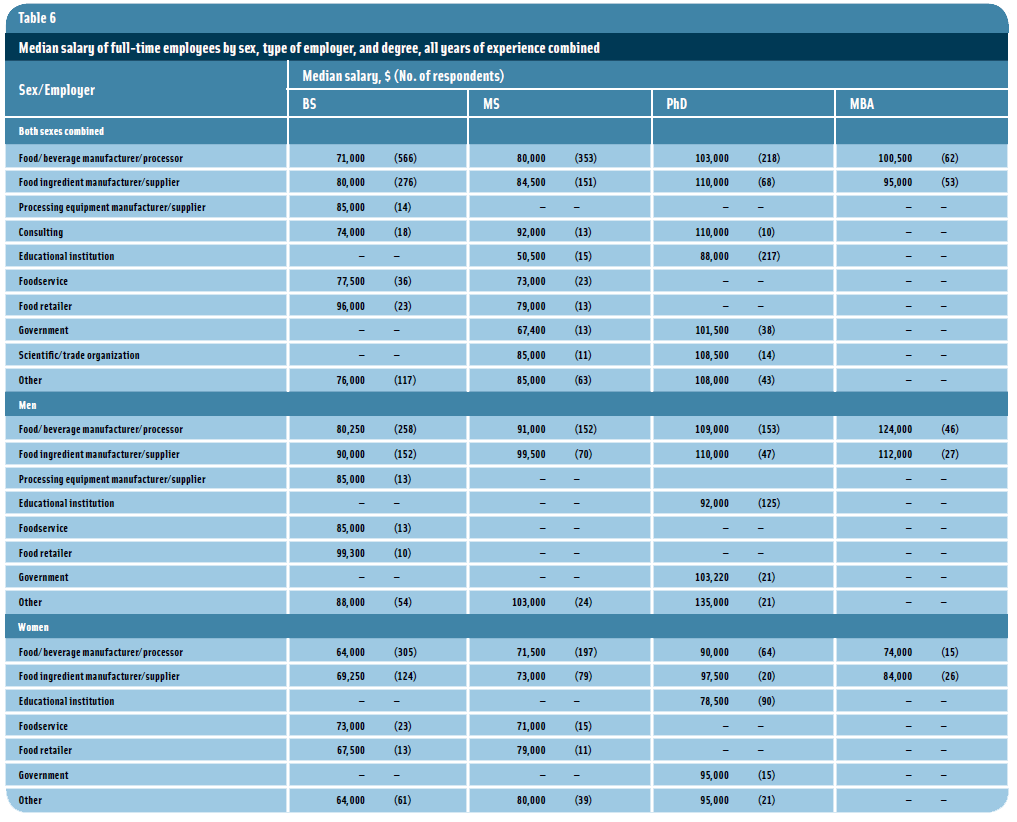
Salaries for men ranged from $10,800 to $397,000, but 80% were below $128,000 and 99% were below $245,000; the median salary for men was $93,000, an increase of 5.7% from the $88,000 in 2005.
Salaries for women ranged from $15,000 to $309,000, but 80% were below $100,000 and 99% were below $178,000; the median salary for women was $73,000, an increase of 5.0% from the $69,500 in 2005.
Part of the difference in median salaries for men and for women may be due to the fact that men have been working in the food field longer than women and therefore tend to have higher salaries. Nevertheless, men appear to receive higher salaries for the same degrees and years of experience.
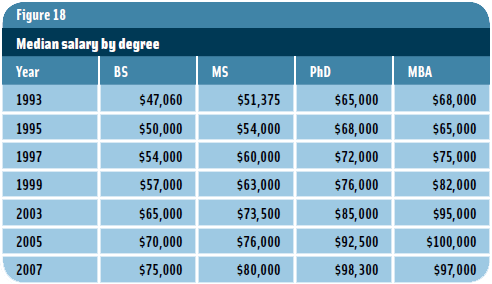
- Median salaries continued to increase for all degree levels except MBA (Figure 18).
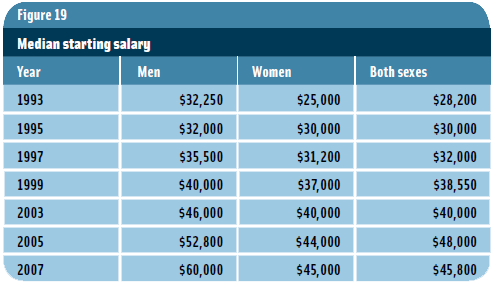
- Starting salary—considered here as the median salary for those with one year or less of professional food-related work experience since receiving their BS degree—continued to increase for both men and women (Figure 19), but men still receive a higher median starting salary than women—higher than in previous years. The reason for this is unclear.
- Besides receiving larger median salaries, men received larger cash bonuses and stocks than women (Table 2).
Neil H. Mermelstein, a Fellow of IFT, is Editor Emeritus of Food Technology magazine ([email protected]).


