
Top 10 Functional Food Trends
Increased attention to disease risk factors, unhealthy kids, interest in high-protein products, and a demand for real-food solutions are driving the lucrative functional foods sector.
The healthy foods sector is alive and well and recovering quickly from a slight slowdown in spending that stemmed from the sluggish economic climate of the past several years. 
Tough times have reminded consumers of the long-term value of staying healthy. Eight in 10 Americans are making some or a lot of effort to eat healthfully; 42% are very concerned about the nutrient content of the foods they buy (FMI, 2011a,b). Sales of functional foods and beverages were estimated at $38 billion in 2010; the overall U.S. healthy foods sector has sales of about $140 billion (NBJ, 2011a).
Self-treatment of minor ailments, supplement use, and interest in alternative therapies is at an all-time high. Thirty percent of consumers say they always or usually purchase grocery products labeled for improving specific health conditions (e.g., heart, digestive, or blood sugar issues); 36% say they sometimes do (Packaged Facts, 2012a).
The shift to positive eating continues. Young adults ages 18–24 remain the top users of functional foods and beverages (Mintel, 2009a). Oatmeal and yogurt are the products most frequently purchased for their specific health benefits (Packaged Facts, 2012a).
Consumers are increasingly balancing health concerns with pleasurable eating, spawning an unstoppable healthier menu movement in quick- and full-service restaurants. Just about one-third of the best-selling new foods and beverages introduced in 2010–11 carried a natural claim; one-quarter claimed added nutrients/nutrition, high fiber/whole grain, reduced calories or low-fat/fat-free content. In addition, one in 10 made a claim about energy, antioxidants, or trans fat (IRI, 2011a ).
Healthy foods are dominating new channels. Two-thirds of consumers say they’re more likely to shop in a convenience store that offers healthy options (CSNews, 2012). The top 10 fastest-growing drug store categories all feature edible products, and six of them include frozen or refrigerated products (Mitchell, 2012).
--- PAGE BREAK ---
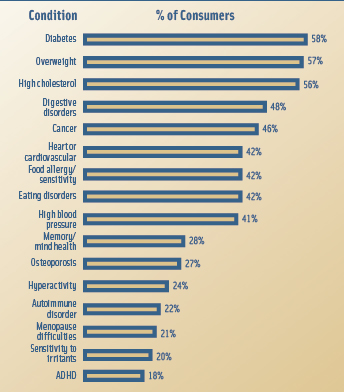
Diabetes and overweight are the top two health conditions that food is used to prevent, followed by high cholesterol, digestive disorders, and cancer (Figure 1; Hartman, 2010a).
From new school lunch and heart-healthy eating guidelines for kids’ meals to ongoing regulatory issues surrounding immunity/probiotics, the road to success in the functional foods sector is fraught with both obstacles and opportunities. It is the intention of this article to help food technologists navigate the sea changes in the functional foods sector and find the best directions for the years to come.
1. Real Food Nutrition
When it comes to delivering health and wellness, more often it is now about real food and the ability to provide nutrients and health benefits naturally. Nearly nine in 10 grocery shoppers (88%) believe it is very important to get their nutrients from foods naturally rich in vitamins/minerals (HealthFocus, 2010).
In fact, the desire for natural functionality is so strong that core supplement users are limiting the number of supplements they take daily due to pervasive doubts about their bioavailability, a belief that nutrients in foods are best, and concern over the long-term effects of supplementation on digestion (Hartman, 2010a).
One-third (32%) of consumers are making a strong effort to eat more foods/drinks that are naturally rich in nutrients, 28% seek products that are naturally rich in antioxidants, and 28% look for fresh/minimally processed products vs 19% who are interested in more fortified foods (MSI, 2010a). While 65% of adults are still making a strong/some effort to eat more fortified foods, those making no effort rose 7% from 2009 to 2010 to a total of 35% (MSI, 2010a).
Orange juice, followed by cranberry juice, is the beverage most purchased for its nutritional benefits (Packaged Facts, 2012a). Antioxidant-rich green tea is now the most-consumed tea in the United States (Mintel, 2011a).
Sales of fruit and vegetable supplements jumped to $82 million in 2010; sales of antioxidants across all channels and as a food ingredient reached $5 billion (NBJ, 2011a).
Polyphenols and flavonoids remain the strongest phytochemical mass market ingredients (Sloan, 2012a). Cocoa/dark chocolate is now in the top quintile of consumer ingredient interest/awareness, on par with antioxidants, vitamins/minerals, omega-3s, and whole grains (HealthFocus, 2010).
--- PAGE BREAK ---
Anthocyanins, carotenoids, and resveratrol have also recently become mass market opportunities (Sloan, 2012a). In 2010, 26% of consumers were aware of the health benefits of polyphenols/resveratrol, and 24% were aware of the benefits of flavonoids (HealthFocus, 2010).
Half of shoppers bought dark chocolate, 47% almonds, 21% Greek yogurt, and 8% coconut water for their superfood properties in 2011 (FMI, 2011a). Spices, pulses (e.g., chick peas and lentils), and nuts/seeds are among the hot new superfoods. A teaspoon of ground cinnamon or cloves has more antioxidant activity than an 8 oz glass of pomegranate juice or a half cup of blueberries.
Products claiming to be all natural took the highest share (12%) of all consumer packaged goods (CPG) product sales with wellness claims in 2011 (IDDBA, 2011).
Sales of organic food reached $23.4 billion in 2010; natural food sales were $18 billion (NBJ, 2011b). In 2011, 38% of food shoppers bought organic; 58% purchased pre-packaged foods marked all natural (Packaged Facts, 2011a).
“Clean” edged out “fresh” as the most important product label phrase for consumers purchasing shelf-stable foods/beverages such as cereal, canned vegetables, and soda (Hartman, 2010b).
“No chemical additive” label claims are very important to about half (47%) of food shoppers; no preservatives are very important to one-third (35%) (FMI, 2011b). Half (50%) of consumers look for natural ingredients on the ingredient listing (IFIC, 2011).
Consumers say limiting processed foods is now the third-most-important component of healthy eating, after eating more vegetables and fruits (Mintel, 2009b). Nine in 10 consumers (90%) agree that processed foods are not as healthy as fresh foods (MSI, 2010a).
2. Mini-Managers
These days, rather than the big, sweeping dietary changes of the past decade, it’s small, simple swaps and substitutions for everyday fare that are getting the nod from consumers.
--- PAGE BREAK ---
Swapping for healthier versions of the same foods is the most practiced healthy shopping strategy; 58% of shoppers practice it more than half the time (FMI, 2010). In 2011, 56% switched to whole-grain bread, 42% to whole-grain pasta, and 39% to whole-grain rice (FMI, 2011a).
Just over half (52%) replace less healthy choices with different foods altogether (e.g., carrots instead of cookies); 47% stop buying foods they perceive to be unhealthy; and 46% buy new healthy products that they haven’t bought before (FMI, 2010).
In 2011, low-fat/fat-free remained the largest “avoidance market” (i.e., nutrients consumers are seeking to avoid) in supermarkets, with sales estimated at $46 billion; sales of reduced-calorie products were $10.4 billion, and sales of low-sodium/low-salt offerings totaled $10 billion (Nielsen, 2011).
Last year, saturated joined trans fat at the top of consumers’ “to avoid” list; 59% of shoppers consider information about both to be very important. Next on the list is fat content, which is very important to 56%, followed by salt/sodium 52%, calories 48%, chemical additives 47%, artificial sweeteners 47%, high fructose corn syrup 44%, cholesterol 43%, and sugar 42% (FMI, 2011b).
Half (50%) of consumers deliberately avoid preservatives, 49% MSG, 47% artificial flavors, 44% colors/dyes, 43% hormones/antibiotics, and 29% genetically modified organisms (GMOs) (Hartman, 2010a).
Just under half of consumers are snacking on healthier items in 2012, up 13% over 2010 (Technomic, 2012). While snacking during all dayparts is growing, afternoon remains the largest snacking occasion. Snacking frequency is up in 2012—49% report having snacks 1–2 times per day, 43% 3–4 times, 6% 5–6 times, and 2% 7+ times daily (Wyatt, 2012).
Healthy snack sales volume continued to outpace indulgent snacks in 2011, with healthy snack sales volume up 0.5% vs 0.1% growth for indulgent snacks. Nutritional snacks/trail mix volume grew 11.1% in 2011 (Wyatt, 2012).
On the indulgent side, refrigerated appetizer/snack roll volume was up 5.9%, handheld non-breakfast entrees were up 3.8%, and frozen appetizers/snack rolls volume climbed by 3.3%, indicating an opportunity for more better-for-you versions of these items (Wyatt, 2012).
--- PAGE BREAK ---
Sales of natural and organic snacks grew 10.7% in 2011. No trans fat and beyond basic nutrition (e.g., antioxidants) are the most desired healthy snack product attributes, cited by 60% of consumers; fresh/not processed, whole grain, low fat, high fiber, all natural, low calorie, no preservatives/additives, low sugar, low cholesterol, and vitamins/minerals were cited by 50% (Wyatt, 2012).
Three-quarters of consumers (78%) seek snacks that are filling, and 56% are looking for products that provide an energy boost (Wyatt, 2012).
While two-thirds (67%) of consumers eat granola, cereal, or breakfast bars, only 28% are users of energy/diet/nutrition bars, a level virtually unchanged since 2007–2008. Moreover, use seems to be giving way to other nutritional snacks (e.g., granola, fruit, trail mixes, etc.) (Mintel, 2012a).
Six in 10 energy bar users (59%) eat them as a snacks between meals, 50% choose them for overall wellness, 35% as a meal replacement, 35% for protein, 27% to lose weight, 25% for muscle recovery, 23% to enhance metabolism, and 16% to control blood sugar (Mintel, 2012a).
Men ages 35–44 are by far the most likely to use bars during a gym workout; over half of bar users 65+ do so for fitness/exercise reasons (Mintel, 2012a). Sports nutrition was the fastest-growing U.S. supplement sector in 2010 with sales up 9% to $3.2 billion; they are projected to reach nearly $4.9 billion by 2017 (NBJ, 2012).
3. Buying in to Bioavailability
Steady gains in consumers’ confidence in the effectiveness of nutrients to deliver highly desirable health benefits have caused Americans to refocus their attention on individual nutrients (MSI, 2010a).
Vitamins were the sixth-fastest-growing CPG product category overall in food, drug, mass, and convenience stores in unit sales in 2011, up 6% over last year. Vitamins ranked second overall in the health-care segment, making the top 10 list in both sectors for the past four years (IRI, 2012).
More than one-quarter of the best-selling new foods/beverages introduced in 2010–11 carried an added vitamin/nutrient claim (IRI, 2011a). Vitamin/mineral health claims on labels are very important to 37% of grocery shoppers (FMI, 2011b). Nearly half (46%) of food shoppers are very concerned about the nutrient content of their food, up 5% vs 2009 (FMI, 2011b).
--- PAGE BREAK ---
More than half (55%) of consumers now believe that calcium is very effective for bone health, 38% believe omega-3s are very effective for heart health, 25% for skin, and 23% for brain health. In addition, 50% cite the importance of fiber for colon health, and 28% recognize that it is very important for weight loss (MSI, 2010a). Over half of shoppers say building bone density is an important consideration when buying food (FMI, 2011a).
Six in 10 adults name at least one nutrient they feel they are not consuming in sufficient amounts. After calcium, fish oil, prebiotics/probiotics, omega-3s, vitamin D, B vitamins, iron, fiber, antioxidants, and vitamin C round out the top 10 list (MSI, 2010a).
In 2011, more than four in 10 shoppers (43%) bought foods/beverages because they contained high amounts of vitamins/minerals, 37% calcium, 36% antioxidants, 34% protein, and 34% omega-3s (Packaged Facts, 2012a). Sales of foods/beverages carrying an omega-3 claim reached $1.8 billion in U.S. supermarkets in 2011 (Nielsen, 2011).
With consumers focused on the effectiveness of individual nutrients, it makes sense that bioavailability is a growing concern. Over half (55%) of consumers would like more clinical proof surrounding the bioavailability of nutrients in fortified foods; 42% are concerned that their body does not absorb enough of the nutrients in supplements (French, 2011). Unilever has addressed such concerns by including the statement, “Oils like those in Wish-Bone help better absorb vitamins A & E from salad,” on salad dressing labels.
Dietary supplements are a key indicator of interest in individual nutrients for fortified foods, and use is at an all-time high; 69% of adults took a supplement in 2011; of supplement users, 53% took them regularly, 36% used a variety, and 71% took a multivitamin (CRN, 2011). Omega-3/fish oil overtook calcium last year as the second-most-used supplement; calcium is tied with vitamins D and C for third place (CRN, 2011).
B-complex vitamins and vitamin E rank in sixth and seventh place; they’re followed by glucosamine/chondroitin, magnesium, iron, flax seed oil, coenzyme Q10 (Co-Q10), zinc, and probiotics (CRN, 2011). Use of Co-Q10 has nearly doubled from 2010 to 2011 for those ages 55+.
Magnesium, the fastest-growing mineral supplement in the United States, is now the third-most-popular ingredient in new heart-healthy foods/drinks introduced globally (NBJ, 2011b; Innova, 2011). Look for magnesium to team up with vitamin D and calcium to create a new bioavailability horsepower race aimed at bone strength/health. Also notably, the drive to reduce the sodium content of foods/beverages has spurred concern that Americans are not getting an adequate intake of potassium (USDA, 2011).
--- PAGE BREAK ---
With the Federal Trade Commission/Food and Drug Administration challenging probiotic immunity claims, it’s not surprising that consumers are refocusing their attention on vitamin C, protein, fiber/whole grains, and superfruits for immune-boosting support (MSI, 2008).
Interest in eye health is soaring, spurring interest in vitamin A/beta-carotene. Three of the top-selling multivitamins are positioned for eye health benefits. Bausch & Lomb’s Preservision is second in sales only to Centrum Silver (IRI, 2012). Even antioxidants are bouncing back after the American Heart Assn.’s announcement in 2007 that antioxidant vitamins do not improve heart health.
While the addition of omega-6s will remain controversial for some time, health-promoting monounsaturated fatty acids (MUFAs) have quietly become a new mass market opportunity (Sloan, 2012b). Choline is the hot ingredient for baby, infant, and toddler foods.
4. Protein Power
Protein is the next super nutrient, delivering a bevy of health benefits—from helping to prevent frailty in seniors to toning bulging boomer bodies. Four in 10 consumers are making an effort to eat more protein; 39% say a high protein claim is very important on a food label (IFIC, 2011; FMI, 2011a).
Consumers rank protein as the fifth-most-important component of healthy eating, behind vegetables, fruits, limited processed foods, and foods low in saturated fats (Mintel, 2009b). Two-thirds (65%) of adults believe that protein helps build muscle, 39% say that it helps you feel full, 39% say it is beneficial for aging, and 34% believe that it aids with weight loss (IFIC, 2011).
New evidence indicates that consuming 25–30 g of protein per meal optimizes muscle growth and weight management. With only 10 g of protein currently consumed on average for breakfast vs 15 g at lunch and 65 g at dinner, expect high protein breakfast items to reach superstar status.
Seven in 10 consumers and eight in 10 dieters believe it is important to eat more protein when trying to lose weight. Dieters who made a strong effort to eat more protein rose from 50% in 2007 to 55% in 2010 (MSI, 2010b).
Two-thirds (69%) of those trying to lose weight are trying to consume more foods/beverages that promote satiety; nearly one in five make a great deal of effort to do so (MSI, 2010b). Half (53%) of adults want more satiating functional foods, and 44% seek functional beverages that offer satiety (Mintel, 2009a; MSI, 2010b).
--- PAGE BREAK ---
Expect high-protein sports nutrition powders/drinks to move mainstream. Nearly three-quarters of women cite body shape as a major concern as they age (CNN, 2009). Body fat, muscle tone, and body composition are all mass market opportunities (Sloan, 2012a). Sports nutrition powders/formulas are by far the major driver in the sports supplement category, with sales projected to grow from $2.8 billion in 2010 to $4.2 billion by 2017 (NBJ, 2012).
Despite the well-proven role of protein in children’s growth/development—and the fact that more than one-third of moms made a strong effort to increase their kids’ protein intake last year—only 22 new food/drink lines aimed at children carried high-protein tags last year (MSI, 2010c; Innova, 2011). In 2010, better-for-you accounted for only $4 billion of the $10 billion U.S. kids’ food/beverage market (Packaged Facts, 2011b).
Just over half of U.S. consumers believe that protein is an important ingredient for immunity (MSI, 2008). One in 10 of the best-selling new foods/beverages in the U.S. last year carried a protein/energy claim (IRI, 2011a). Sales of snacks carrying a high protein claim on the front label jumped 28% in 2011 (Wyatt, 2012). Moreover, nearly one out of 10 (9%) of consumers made a strong effort to consume more amino acids in 2010; 59% of consumers were aware of these protein components (MSI, 2010a).
5. Plant-Based Diets
The continuing shift to positive eating is putting plant-based foods on the front burner. In 2011, 63% of consumers wanted to know more about what foods to eat vs what to avoid, up 7% over the past two years (IFIC, 2011).
When it comes to naturally rich-in foods, consumers say vegetables, fruit, nuts, pulses, whole-grain breads, and beans top the list (MSI, 2010a). Whole grain and high fiber topped the list of the most sought after health claims on food products in 2011; older shoppers have the highest interest in whole grains/fiber (FMI, 2011b).
Nearly half (45%) of shoppers bought foods/beverages that were labeled high in fiber last year (Packaged Facts, 2012a). In 2011, sales of foods/beverages that carried a high fiber claim reached $4.2 billion in supermarkets, sales of foods labeled multigrain totaled $1.8 billion (Nielsen, 2011).
American Culinary Federation (ACF) chefs name ancient grains, flatbreads, whole-grain bread/rolls, and vegetable chips among the hot foods/ingredients for 2012 (NRA, 2011). Non-wheat noodles (e.g., quinoa, rice, and buckwheat), followed by black/forbidden rice, quinoa, vegetable pickles, Asian noodles, braised vegetables, sweet potato fries, steamed/grilled/roasted vegetables, and brown/wild rice are among the trendy side dishes (NRA, 2011).
--- PAGE BREAK ---
Six in 10 meal preparers (60%) are making a strong effort to include more fruits and vegetables at dinner, up 6% vs 2009; 42% are attempting to include more whole grains, up 4% (MSI, 2011). “A serving of fruit/vegetables” is a very import claim to two-thirds (67%) of consumers (HealthFocus, 2010). Pulp and bits of fruit are returning as popular additions in beverages and desserts; 34% of U.S. households drink pulp orange juice (Mintel, 2012b).
ACF chefs still cite açai, goji berry, and mangosteen as the hot superfruits for 2012; rambutan, dragon fruit, paw paw, guava, and passion fruit are favored exotic fruits (NRA, 2011). Specialty potatoes, micro-vegetables, micro-greens, fresh herbs, dark bitter vegetables, root vegetables, fresh bean and hot pepper varietals, Asian mushrooms, soybeans, vegetable ceviche/seviche, and wasabi peas are among the trendy produce items for 2012 (NRA, 2011).
Research continues to show the potential functional value of plant-based superfoods. Almonds contain phytosterols, aid satiety, and help stabilize glucose levels. Pistachios may lower cholesterol. Walnuts are linked to brain health/cancer prevention. Beans may lower the risk of cognitive deficits. Pulses deliver eight essential amino acids. Chia seeds, sunflower, and hemp seeds also contribute a diversity of nutrition benefits (IFT, 2012).
In 2011, about one-quarter (27%) of all U.S. adults were trying to avoid/limit meat in their diet (MSI, 2011). The vegetarian retail foods market reached a total of $1.6 billion in sales in 2011 (Mintel, 2011b). ACF chefs cited vegetable/vegetarian as the No.1 hot appetizer trend for 2012 (NRA, 2011).
6. Gourmet Nutrition
Consumers are no longer willing to give up taste for health; more than half believe that healthy food should taste good (French, 2011). With 31 million self-proclaimed foodies in the U.S. and a new more culinarily sophisticated segment savoring food experience cutting across all dayparts and defined by freshness, distinctive flavors, and foodie narratives, it was only a matter of time before demand for more upscale healthier fare crossed over the culinary line(Sloan, 2012b).
Seven in 10 consumers believe that food described as fresh is healthier; more than two-thirds (68%) look for freshness descriptors when purchasing foods(Technomic, 2010). Most important, when eating alone, behavior that is now at an all-time high, diners are more likely to replace frozen meals with fresh, less processed alternatives in order to savor the meal experience more (Hartman, 2010c).
--- PAGE BREAK ---
In 2011, fresh refrigerated meals were the seventh-fastest-growing CPG item in food, drug, mass, and convenience stores (IRI, 2012a). Seven in 10 shoppers buy ready-to-eat items at the grocery store at least sometimes (FMI, 2011b). Breakfast foods are also predicted to be one of the fastest-growing food categories between now and 2018 (NPD, 2011). Breakfast is considered the most important meal of the day by dieters (Packaged Facts, 2010).
Among non-breakfast eaters, a promise of more energy, better mental acuity, or help with weight management would change their behavior (IFIC, 2011). Chicken and seafood are replacing meats in the breakfast daypart (NRA, 2011).
Healthy items are important in the away-from-home lunch decision for 50% of consumers (FMI, 2011b). Three-quarters of all diners are trying to eat healthier when dining out; younger diners ages 18–24 are the most likely to do so (NRA, 2012). Healthy kids meals top the list of menu items quick-service operators say are hot for 2012 (NRA, 2011). ACF chefs cite smaller versions of adult meals, oven-baked items (e.g., baked chicken fingers, gourmet kids’ cuisine, and ethnic-inspired children’s dishes as hot kids’ food trends for 2012 (NRA, 2011).
One-third of consumers are very interested in buying free-range chicken/turkey or grass-fed beef (IDDBA, 2011). Locally sourced meats/seafood tops the list of main dishes that will be trendy for 2012, followed by sustainable seafood, half-portions/smaller portions, and lower-sodium entrees (NRA, 2011). One-quarter (28%) of ACF chefs have a traditional garden at their restaurant, and 3% have a rooftop garden (NRA, 2011).
7. Risk Awareness on the Rise
With 83 million Americans already afflicted with some form of cardiovascular disease, it’s not surprising that the market for heart-healthy products is shifting from general heart health to risk factor reduction. In 2011, one-third (32%) of grocery shoppers sought out “reduces the risk of heart disease” claims on labels (FMI, 2011b).
Concern over heart disease risk factors is growing quickly among younger adults. Two-thirds of boomers are concerned about high blood pressure, 48% of Gen X consumers, and 40% of Gen Y; for cholesterol, the percentage of adults expressing concern is 68% among boomers, 54% for Gen X, and 40% for Gen Y. The percentages of those worried about general cardiovascular health are much lower (Hartman, 2010a).
--- PAGE BREAK ---
With the incidence of stroke rising quickly in those under age 65 and in children, there will be unprecedented demand for products that help lower/manage blood pressure, improve artery health/circulation, and prevent platelet aggregation (AHA, 2012). Twenty-seven percent of U.S. households have a member coping with heart problems or stroke vs 50% with high cholesterol, high blood pressure, or both (IRI, 2011b).
One-quarter of consumers believe functional foods/drinks can be very effective in lowering blood pressure (MSI, 2010a). Dairy peptides have been used in blood pressure–lowering products around the world for the past 10 years (Innova, 2011).
Atherosclerosis is now the No. 1 health issue consumers are trying to address with condition-specific dietary supplements, followed by lowering cholesterol and blood pressure (SPINS, 2011). One-third (34%) of women and half (52%) of men have significant plaque building up in their arteries (AHA, 2012). Circulation is now a bigger mass market opportunity than LDL or HDL cholesterol, according to SloanTrends’ TrendSense™ model (Sloan, 2012a).
While improved circulation is very important for heart health, it is also strongly linked to improved brain health and physical performance. Fifteen percent of consumers bought a food/beverage for heart/circulatory health in 2011 (Packaged Facts, 2012a). The circulatory benefits of cocoa flavanols have been well documented. Products like Mars’ CocoaVia appear well positioned to capitalize on consumers’ circulatory concerns.
Three of the top 10 health issues Americans are very/extremely concerned about involve mental acuity/brain health; lack of mental sharpness is among the fastest-growing U.S. health concerns (HealthFocus, 2010). Three in 10 consumers (28%) have made food choices designed to help them prevent mental/memory issues (Hartman, 2010a).
Heart-healthy products for children are another untapped functional segment. In November 2011, the Natural Heart Lung and Blood Institute mandated blood lipid testing for all U.S. children ages 9–11 and again at ages 17–19. The American Heart Assn. has issued new heart-healthy eating guidelines for children.
In 2011, two first-ever campaigns by the International Diabetes Foundation and the American Diabetes Assn. focused on prevention, shining a new spotlight on diabetes risk factor control. More than that 79 million U.S. adults are pre-diabetic. Moreover, 35% of men and 33% of women age 20+ have metabolic syndrome. An even more sobering statistic is the fact that it exists in one in 10 (2.9) million kids ages 12–19 (AHA, 2012).
--- PAGE BREAK ---
High blood glucose is the fourth-largest cause of preventable death in America—behind smoking, obesity, and high blood pressure (Danaei et. al., 2009). Products positioned to address the issues of insulin resistance, blood sugar control/management, and metabolic syndrome represent large mass market opportunities on par with vitamin D and omega-3s (Sloan, 2012a). More than one-third (36%) of primary grocery shoppers think that “helps maintain healthy blood sugar levels” is a very/extremely important claim; 60% are very interested in low-glycemic foods (HealthFocus, 2010).
In addition, in 2011, 6% of consumers bought a food or beverage to prevent or treat a urinary tract infection, 5% for prostate health, and 4% for cancer prevention (Packaged Facts, 2012a).
8. First Aid
Savvy food, beverage, and dietary supplement marketers continue to pursue more natural solutions to common everyday aches and ailments. And it’s a very big idea. One-quarter (26%) of adults successfully used a natural alternative remedy in 2010; 55% had not but were interested in doing so.
Young Gen Yers are the most likely to believe that functional foods/beverages can be used in place of some medicines; belief in this approach declines as age increases (French, 2011). With one in five consumers affected by gastrointestinal issues, digestive health remains a highly sought after functional food benefit (HealthFocus, 2010). In 2011, 17% of U.S. adults made some or a lot of effort to regularly consume foods/beverages with probiotics (Packaged Facts, 2012a).
Digestive regularity is another sought after health benefit; 33 million U.S. households have a member suffering from constipation (IRI, 2011b); and 42% of consumers seek digestive regularity as a functional food benefit (Hartman, 2010a). Ginger, peppermint, and chamomile-based medicinal teas are well aimed to fight nausea and upset stomach, a widespread problem, particularly among young adults.
There are more than a billion episodes of cold/flu in the United States every year, with younger adults the most likely to suffer from them (CHPA, 2011). Not surprisingly, 44% of consumers are looking to functional foods and beverages for an immune boost (Hartman, 2010a).
Half of those who feel healthy eating is very important are seeking joint health (Hartman, 2010a). Fifty-two million U.S. households have a member suffering from muscle joint issues; 39 million are plagued with arthritis/osteoporosis (IRI, 2011b).
With 35% of adults personally affected by stress and 54% very/extremely concerned, relaxation beverages are right on target (HealthFocus, 2010). Dreamerz All Natural Sleep Beverage and Chocolate S-nores confections are positioned to help the 87% of adults who suffer sleep issues achieve a more natural sleep (NSF, 2011).
--- PAGE BREAK ---
Allergies, too, are moving into the spotlight. Allergen information on a food package is very important to one in five shoppers (18%); 16% look for allergens on the ingredient label (FMI, 2011b). Globally, allergy-free is the claim cited second most frequently on healthy new foods and beverages (Innova, 2011). Yoplait recently launched a line of lactose-free yogurt.
Among those who purchased a gluten-free food or beverage in 2011, 46% think gluten-free is generally healthier, 36% see it as trendy for weight loss, 24% associate it with higher quality (strict process standards), 13% with hyperactivity/autism benefits, 12% with gluten allergy/intolerance, and only 8% with Celiac disease (Packaged Facts, 2011c).
9. Kids, Dads, and Grandparents
Healthy kids’ foods are a missed opportunity; only 40% of the $10 billion kids food/beverage market, which is projected to grow to $14 billion by 2014, was positioned as better-for-you in 2010 (Packaged Facts, 2011b).
Two-thirds of moms monitor their children’s diets very closely; 60% of families practice some form of healthy eating strategy (MSI, 2010c; FMI, 2010). More than one-third of moms are making a strong effort to increase their child’s consumption of calcium, vitamins/minerals, whole grains, protein, and vitamins C and D; 24% are working to increase fiber intake, 20% omega-3s, and 18% probiotics (MSI, 2010c).
One in eight children have two or more risk factors for heart disease; one in three is overweight or obese (NCHS, 2010). Two-thirds of moms are concerned about their kids’ energy/stamina after school, especially for those who play sports (Mintel, 2010a).
With men being the primary grocery shopper in one-third of all U.S. households in 2011 and over 13 million men living alone, it’s time to turn our attention to the health and nutrition needs of men (Saatchi, 2011). The top three impulse buys of male shoppers are new snacks, ice cream, and cereal (Nielsen, 2010).
Just over one-third (37%) of men are very concerned about nutrition. Six in 10 men are making a strong effort to limit fats, 54% salt/sodium, 49% sugar, and 44% cholesterol. In addition, 45% are trying to consume more whole grains, 41% more dietary fiber. One in five men tried to lose weight in 2010 (MSI, 2010d).
Heart-healthy spreads and cereal, yogurt, bars, energy drinks, and eggs are the most purchased functional foods by men (Mintel, 2009b). Six in 10 men want more antioxidants in their diet, 59% vitamins/minerals, and 53% omega-3s.
--- PAGE BREAK ---
Lowers cholesterol, weight control, immunity, and digestive health are the most desired functional food attributes by men; heart health, mental sharpness with aging, cancer prevention, and eye health are their top health concerns (Mintel, 2009a; HealthFocus, 2010).
One-third of the U.S. population is now over age 55, and conditions that affect older adults will move into the spotlight. But don’t be misled; eight in 10 adults over age 50 describe themselves as active; one in five exercises five or more days a week (Packaged Facts 2011d).
Protein, vitamin D, calcium, omega-3s, vitamin C, lutein, fiber, B vitamins, and potassium are, in descending order, the most sought after nutrients by those 50+ (HealthFocus, 2010). Retaining mental sharpness as they age, avoiding heart disease, preventing cancer, bone health/strength, maintaining the ability to continue with normal activity as they age, and preserving eye health are among the issues those 50+ are very/extremely concerned about (HealthFocus, 2010).
Lower cholesterol, digestive health, weight, lower blood pressure, and promoting healthy blood sugar levels and immunity are the most sought after functional food attributes for those age 55 and older (Mintel, 2009b).
10. Liquidation
Weight control/nutrition liquids and powders and energy drinks, both up 18% in unit sales, followed by sports drinks, up 11%, were the fastest-growing CPG categories in 2011 in food, drug, mass, and convenience stores excluding Walmart (IRI, 2012). In 2011, U.S. energy shot sales hit $1 billion (IRI, 2011c). One-third (31%) of those ages 18–24 used an energy shot at least once a month, 26% of those 25–35 did so, 19% of those 35–44, and 11% of consumers 45–54 (Sprinkle, 2012).
Instant coffee, hot cocoa mix, ready-to-drink iced tea, milk, ground bean coffee, apple juice, and leaf tea were other top sales gainers over the past five years. Four out of five drinks posting gains of greater than 10% were single-serve, three in five were natural, and two in five were refrigerated (Sprinkle, 2012).
Energy/alertness, gut health, heart health, immunity, sports/recovery, and weight control were the top claims on new U.S. functional beverages in 2011; globally, the top claims were energy/alertness, vitamin/mineral, sports/recovery, immunity, and heart health, (Innova, 2011).
Six in 10 beverage R&D executives report that their company will launch more new drinks in 2012 than in 2011; 58% plan for more water and juice, 39% more sports/energy beverages, and 19% more carbonated soft drinks (Zegler, 2012). Beverage executives cited health, convenience, natural, and low-calorie as the top market needs/interest states for 2012. Fruit is projected to dominate the best-selling beverage flavors in 2012. Use of superfruit flavors in beverages fell in 2010 and 2011. Açai and pomegranate dropped off the list of projected best-sellers in 2012.
--- PAGE BREAK ---
In 2011, 174 million Americans drank tea, and 183 million had coffee (Packaged Facts, 2012b; Mintel, 2011a). Sales of medicinal teas reached $108 million in combined natural/food, drug, and mass merchandisers excluding Walmart channels for the year ended 2/18/12, up 10.8%, surpassing herbal teas at $88 million, up 7.6% (SPINS, 2012).
Half of those who drink 100% juices look for all natural, no preservatives; four in 10 are seeking no sugar added and a full serving of fruit or enhanced vitamins/minerals. In addition, one-third seek low sugar, antioxidants, and no high fructose corn syrup in the juice they buy. One in 10 seeks out a specific functional ingredient (Mintel, 2012b).
Calcium, antioxidants, and vitamins/minerals are the top ingredients consumers look for in functional beverages. Four in 10 check for fiber/green tea extract; one quarter seek probiotics, caffeine, ginseng, soy protein, or açai; and 10% are looking for L-carnitine, taurine, guarana, and GABA (Mintel, 2010b). Sales of packaged beverages with antioxidant claims reached $12.2 billion in 2011, up 12.9%; sales of beverages touting antioxidant content are expected to climb to $17.8 billion by 2016 (Packaged Facts, 2012c).
Grains, spices, and other botanicals are entering the healthy beverage sector. Healthy hybrids such as green tea with lemonade are also gaining in popularity. The tea-based beverage Kombucha is consumed by 13% of men and 7% of women (Mintel, 2012b).
Immunity, digestive health, complete day’s nutrient requirement, lowering cholesterol, and providing energy are the most desired health benefits for functional beverages. Second-tier benefits include weight loss, stress relief, enhanced metabolism, healthy blood sugar, lowering blood pressure, and memory (Mintel, 2010a). Watch for newer technologies (e.g., high pressure pasteurization and caps that dispense sensitive ingredients at the time of consumption) to gain in popularity.
A. Elizabeth Sloan, a Professional Member of IFT and Contributing Editor of Food Technology, is President, Sloan Trends Inc., 2958 Sunset Hills, Suite 202, Escondido, CA 92025 ([email protected]).
References
AHA. 2012. Heart disease and stroke statistics. American Heart Assn., Dallas, Texas. www.americanheart.org.
CHPA. 2011. Self-care in the new millenium. Consumer Healthcare Products Assn., Washington, D.C. www.chpa.org.
CNN. 2009. Body shape as we age. www.cnn.com.
CRN. 2011. 2011 CRN consumer survey on dietary supplements. Council on Responsible Nutrition, Washington, D.C. crn.org.
CSNews. 2012. Convenience operators survey. Convenience Store News. www.csnews.com.
Danaei, E., Ding, E., Mozaffarian, D., Taylor, B., Rehm, J., Murray, C.J.L., and Ezzati, M. The preventable causes of death in the United States: Comparative risk assessment of dietary, lifestyle, and metabolic risk factors. 2009. PLoS Med. 6(4):e1000058. Epub Apr. 28.
FMI. 2010a. Shopping for health. Food Marketing Institute, Washington, D.C. www.fmi.org.
FMI. 2011a. Shopping for health.
FMI. 2011b. U.S. grocery shopper trends.
French, D. 2011.Top trends driving innovation. Presented at Supply Side West, Las Vegas, Nev., Oct. 10-14.
Hartman. 2010a. Reimagining health & wellness. The Hartman Group, Bellevue, Wash. www.hartmangroup.com.
Hartman. 2010b. Beyond organic & natural report. Feb.
Hartman. 2010c.The Hartman Group eating occasions compass.
HealthFocus. 2010. U.S. trend study. HealthFocus Intl., St. Petersburg, Fla. www.healthfocus.com.
IDDBA. 2011. What’s in store? International Dairy Deli Bakery Assn., Madison, Wis. www.iddba.com.
IFIC. 2011. Food & health survey. International Food Information Council Foundation, Washington, D.C. www.ific.org.
IFT. 2012. Nuts, beans, and seeds may boast significant nutrients based on studies and research. Press release, Feb. 6. Institute of Food Technologists, Chicago, Ill. www.ift.org.
Innova. 2011. The Innova Database. Innova Market Insights, Duiven, The Netherlands. www.innova-food.com.
IRI. 2011a. IRI New product pacesetters. Times & Trends. SymphonyIRI Group, Chicago, Ill. www.infores.com.
IRI. 2011b. OTC medication report. Nov.
IRI. 2011c. Press release, May 15.
IRI. 2012. CPC 2011 year in review. Times & Trends, Feb.
Mintel. 2009a. Functional foods—U.S. August. Mintel International Group Ltd., Chicago, Ill. www.mintel.com.
Mintel. 2009b. Healthy eating and weight attitudes towards food: weight and diet—U.S. May.
Mintel. 2010a. Mintel, Energy Shots & Beverages—U.S. July.
Mintel. 2010b. Functional beverages—U.S. May.
Mintel. 2011a. Tea and RTD teas—U.S. July.
Mintel. 2011b. Vegetarian foods—U.S. Feb.
Mintel. 2012a. Nutrition and energy bars—U.S. Feb.
Mintel. 2012b. Fruit juice and juice drinks—U.S. January.
Mitchell, R. 2012. The 2012 perishables trends forecast. Jan. 2. www.perishablesbuyer.com.
MSI. 2008. Gallup 2008 study of immunity. Multi-Sponsor Surveys, Princeton, N.J. www.multisponsor.com.
MSI. 2010a. The 2010 Gallup study of nutrient knowledge and consumption.
MSI. 2010b. The 2010 Gallup study of weight.
MSI. 2010c. Study of children’s eating behaviors.
MSI. 2010d. The 2010 Gallup target market report of men in the kitchen.
MSI. 2011. The 2011 Gallup study of dinner.
NBJ. 2011a. Sales data sheets 2011. Nutr. Bus. J., Boulder, Colo. www.nutritionbusiness.com.
NBJ. 2011b. Organic finds cause to unite behind. XVI(10): 1-10.
NBJ. 2012. Sports nutrition and weight loss. XVII(2): 1-8.
NCHS. 2010. National Center for Health Statistics.
Nielsen. 2010. 2010 all channel shopper report. The Nielsen Co., Schaumburg, Ill. www.nielsen.com.
Nielsen. 2011. U.S. Healthy eating trends: part 1. Press release, Jan. 26.
NPD. 2011. A look into the future of eating. The NPD Group Inc., Port Washington, N.Y. www.npdfoodworld.com.
NRA. 2011. What’s hot 2012 survey. National Restaurant Assn., Washington, D.C. www.restaurants.org.
NRA. 2012. 2012 forecast.
NSF. 2011. 2011 sleep in America poll. National Sleep Foundation, Washington, D.C. www.sleepfoundation.org
Packaged Facts. 2010. Weight management trends in the U.S. Packaged Facts, New York, N.Y. www.packagedfacts.com.
Packaged Facts. 2011a. Natural and organic foods and beverages in the U.S. July.
Packaged Facts. 2011b. Kids’ food & beverage market in the U.S.
Packaged Facts. 2011c. Gluten-free foods & beverages in the U.S. Feb.
Packaged Facts. 2011d. Healthy 50+ Americans. April. Packaged Facts. 2012a. Targeted health and wellness foods and beverages. Feb.
Packaged Facts. 2012b. Coffee and tea foodservice trends in the U.S. Feb.
Packaged Facts. 2012c. The overall antioxidant market. March.
Saatchi. 2011. The male shopper. Saatchi & Saatchi X, New York, N.Y.
Sloan, A.E. 2012a. TrendSense™ model report. Sloan Trends Inc., Escondido, Calif. www.sloantrend.com.
Sloan, A.E. 2012b. What America eats? Food Technol. 66(1) 20-32.
SPINS. 2011. Supplements by sub-category. Year ended 5/8/11. SPINS, Schaumburg, Ill. www.SPINS.com
SPINS. 2012. Teas by sub-category. Year ended 2/18/12.
Sprinkle, D. 2012. Innovation consumers want. Presented at Nutracon, Anaheim, Calif., March 7-8. Technomic. 2010. The healthy eating consumer trend report. Technomic Inc., Chicago, IIl. www.technomic.com.
Technomic. 2012. The snacking occasion consumer trend report.
USDA and HHS. 2011. Dietary guidelines for Americans 2010. U.S. Dept. of Agriculture and U.S. Dept. of Health and Human Services. www.dietaryguidelines.gov.
Wyatt, S.L. 2012. State of the snack industry. Presented at Snaxpo, Phoenix, Ariz., March 16-19. Zegler, J. 2012. New product development survey. Beverage Industry 102(1): 52-62.