
What’s Fueling Consumers’ Focus on Freshness?
Healthier eating, a shift toward immediate consumption, and a bevy of prepared meal components are powering the unstoppable trend to fresh food.
Subway’s advertising is focused on the fact that its sandwiches feature fresh vegetables, hand-cut daily in its stores. Fresh-squeezed, cold-pressed juices are commanding unprecedented premium prices. And “made from fresh ingredients” claims appear on nonperishable items throughout the center store.
Examples like these reflect the fact that more and more, consumers are gravitating toward fresh, and the food industry is re-centering around less-processed and more-natural fare. This movement is driven by consumers’ preoccupation with health and wellness, the strength of the immediate consumption trend, and shoppers’ interest in higher-quality foods.
On the matter of health, three-quarters of consumers believe that fresh foods are healthier (Technomic, 2014a). Half of shoppers report they’re now buying fewer processed foods (FMI, 2014a).
There’s no denying the importance of the immediate consumption trend. In 2013, 15% of all eating occasions involved foods/beverages eaten within an hour of purchase. For Millennial eating occasions, that total was 40% (Hartman, 2013).
When eating alone, consumers are more likely to opt for fresh over frozen meals. In 2013, nearly half (47%) of all eating occasions were solo (Hartman, 2013). Three-quarters of consumers cite freshness as important or extremely important when choosing a snack—up 4% vs 2013 (FMI, 2014a). Half (53%) of all eating occasions last year were snacks (Hartman, 2013).
In addition to snacking frequently, consumers also are embracing cooking from scratch. In 2013, half (50%) of consumers cooked more from scratch, using fewer convenience products in order to save money, up from 47% who said they did so in 2012 (IRI, 2013). Forty-four percent of shoppers are buying more fresh ingredients, up from 34% two years ago. And 78% of consumers are now confident in their scratch cooking ability (FMI, 2014a, b).
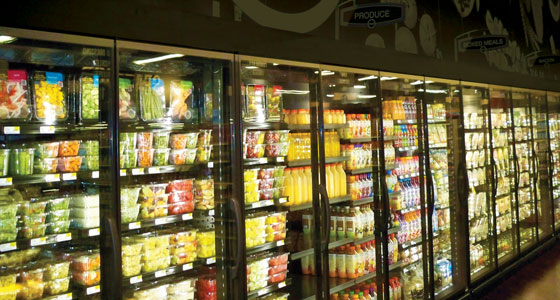
Nearly nine in 10 adults (87%) would be more likely to purchase and pay more for a food or beverage described as fresh (Technomic, 2014a). Premium/fresh-format stores that focus primarily on fresh and ready-to-eat foods are among the most successful supermarket formats. In fact, fresh-format stores are projected to have the highest growth rate through 2018 (FMI, 2014b).
High-quality fresh produce and meat departments are the reasons that 95% and 91% of adults, respectively, decide to shop at a specific grocery store (FMI, 2014b). Local/seasonal ingredients, grass-fed, free-range, farm-raised, homemade, and made-from-scratch descriptors are very strongly tied to fresh (Technomic, 2014a).
--- PAGE BREAK ---
 The New Center Store
According to Nielsen Perishables Group’s FreshFacts, fresh foods accounted for 29% of all U.S. grocery outlet sales for the year ended (Y/E) April 26, 2014, outpacing overall industry gains in both dollar and volume sales (Parker, 2014).
Produce dollar sales grew 7%; seafood and deli each grew 6%; and meat and bakery each climbed 4% during the same time period. Meat accounted for 39% of fresh sales; produce 32%, deli 16%, bakery 8%, and seafood 5% (Parker, 2014).
Trips per household to convenience stores and drug stores for perishables increased 5% vs a year ago, and trips to dollar stores for perishables were up 4%. Nielsen predicts that grocery stores will account for 64% of retail fresh food dollars, mass/supercenters 15%, club stores 12%, and the remaining market formats 8% by 2016.
Four main consumer priorities drive fresh product success. In 2013, healthy positionings contributed 37% of fresh dollar sales, convenience 18%, premium/indulgence 7%, and multicultural/global/exotic products 2% (Parker, 2014). Nielsen reports that multicultural/global/exotic fresh items enjoyed a 9% jump in dollar sales; convenience and healthy fresh product sales each rose 7%; and premium/indulgence product sales were up 4%.
When it comes to healthy, simply being fresh is no longer enough. Savvy marketers are broadening their appeal by touting claims (e.g., fresh 100-calorie portion packs) or repositioning their products as naturally high in protein.
While 22% of U.S. households—mostly affluent, health-minded couples—overspend on fresh convenience foods, on-the-go families with kids and those who buy fresh primarily as a staple underspend on fresh convenient products, representing a large, virtually untapped opportunity (Nielsen, 2012).
Baby Boomers and Millennials make up 38% and 35%, respectively, of fresh perimeter shoppers (IDDBA, 2014). Moms and Hispanics spend a higher proportion of their food budget on fresh perimeter food items (Packaged Facts, 2012).
--- PAGE BREAK ---
Center of the Plate
While price remains the top fresh meat/poultry selection factor, nutritional content, preparation knowledge/time, and the desire for immediate consumption are increasingly important (FMI, 2014c).
In 2014, 3.8 of the five home-cooked dinners served per week included meat/poultry, up from 3.6 in 2013. Nearly three-quarters of consumers (72%) cook a fresh meat/poultry entrée at least three nights per week; 19% do so five nights per week (FMI, 2014c).
Two-thirds of fresh meat department operators reported greater consumer demand for value-priced meats (e.g., flat steaks) over the past year. Value-added products are also important in the fresh meat category, however; 52% of operators reported more demand for value-added items (e.g., marinated products, kebabs). Also in relatively high demand, according to the operators, are turkey, grass-fed beef, and organic meat/fish (Major, 2014a).
Fresh chicken and fully cooked meats were bright spots in the meat case for Y/E Nov. 30, 2013, according to Nielsen. Volume sales of fully cooked pork jumped 12%, stir-fry/fajita strips were up 10%, and lamb was up 7.6% (Major, 2014a).
With the frequency of one-pot/crockpot meals increasing 22% over the past five years, it’s not surprising that casseroles and less expensive cuts (e.g., brisket) are gaining in popularity (FMI, 2014c).
Eighty-two percent of shoppers prepare marinated meats and poultry on a regular basis (FMI, 2013). Nearly half of consumers (45%) prepare ready-to-eat meat at least once a week; 42% serve heat and eat, up from 33% and 29%, respectively, in 2010 (FMI, 2014c).
Thai chili, Madeira, citrus, ponzu, and red curry are the ready-for-trial steak entrée sauce flavors; marsala, chutney, plum, mango, ginger-garlic, and cilantro-cream are trendy options for pork entrees (Technomic, 2013a). New cuts of meat (e.g., Santa Fe and merlot steaks and New York or rib eye pork chops) are rated by chefs as the sixth-most-important culinary trend for 2015 and continue to add excitement to the fresh meat case. Locally sourced meat and seafood is the top culinary trend overall for 2015 (NRA, 2014).
Sales of natural meat, fish, and poultry reached $2.7 billion in 2013, up 12% vs 2012; organic meat, fish, and poultry sales were $910 million, +11%. One-third of shoppers buy organic/natural meats; fear of hormones, steroids, and antibiotics are the top reason (NBJ, 2014; FMI, 2014c).
One in three meal preparers are cooking more fish/seafood than they were five years ago. Twenty-eight percent of consumers cook fish/seafood once a week for dinner, and 29% do so two or more times (FMI, 2014a, c).
Crustaceans, seafood sides, sauces/seasonings, fin fish, prepared seafood, and other seafood led volume growth in fresh fish/seafood departments for Y/E Dec. 28, 2013, per Nielsen (Major, 2014b). Shrimp was the most-consumed seafood in 2013, followed by salmon, canned tuna, tilapia, pollack, Pangasius, cod, catfish, crab, and clams (NFI, 2014).
Nontraditional fish (e.g., barramundi) and underutilized species (e.g. mackerel, whiting), are among the top main dish culinary trends for 2015 (NRA, 2014). Sesame, pineapple, beurre blanc, romesco, meuniere, and ginger-cream are among the up-and-coming sauces for seafood/fish entrees (Technomic, 2013a). Finally, one-third of operators report increased consumer demand for sustainable/farm-raised seafood (Major, 2014b).
--- PAGE BREAK ---
Dining Deli-Style
Sales in the $26 billion fresh prepared foods sector are projected to outpace the industry with a 6% to 7% annual growth rate through 2017 vs 2% to 3% for retail grocery food/beverages and 3% to 4% for foodservice (A.T. Kearney, 2013).
Only 14% of consumers never buy prepared ready-to-eat items (e.g., rotisserie chicken) and 22% never purchase heat-and-eat prepared foods such as fresh pizza, casseroles, or soup (FMI, 2014b).
Prepared foods accounted for 57% of sales, deli meat 21%, deli cheese 8%, and deli beverages 4% for Y/E March 30, 2014, per Nielsen (IDDBA, 2015). Turkey, ham, beef, salami, bologna, chicken, and sausage were the most-purchased deli meats; Italian specialty meats are rapidly gaining in popularity (IDDBA, 2015).
American, Swiss, Cheddar, provolone, Parmesan, and Muenster were the top-selling deli cheese varieties; Gouda and Hispanic cheeses posted the largest gains for Y/E March 30, 2014 (IDDBA, 2015).
IRI reports that pimento, mascarpone, Colby blend, queso quesadilla/Chihuahua, and queso panela were the natural cheeses with the fastest-growing sales (IDDBA, 2015). Cheeses on restaurant menus with the largest sales increases in 2013 included Taleggio, up 38%; burrata, +22%; and pecorino Romano, +11%. Hispanic Cotija, with sales up 45%, and queso fresco, +16%, were the fourth- and sixth-fastest-growing on menus overall (IDDBA, 2015).
Chicken still rules the roost, contributing 29% of deli prepared food sales for Y/E March 29, 2014, per Nielsen; deli salads contributed 16%, entrees 11%, sandwiches 11%, dips/ spreads/toppings 8%, pizza 5%, sushi 5%, snacks 4%, platters 3%, sides 2%, and soups 2% (IDDBA, 2015).
According to IDDBA, deli dips/spreads/toppings experienced the biggest sales increase, up 15.4%; dips and toppings were followed by sides, +12.7%; snacks, +9.7%; deli prepared chicken, +9.3%; sushi, +8.6%; soups, +6.3%; sandwiches, +6.0%; deli entrees, +5.2%; and deli platters, +2.8%. Italian and barbecue chicken and chicken appetizers enjoyed double-digit growth.
For Y/E May 31, 2014, fruit salad volume sales jumped 29%; turkey salad was up 22%; seven-layer salads, +18%; vegetable salads, +14%; and other specialty salads, +12%, per Nielsen (IDDBA, 2015). Pasta entrée volume sales increased 11.7%; Mexican entrées were up 8.5%; other entrees, +10.7%; and pot pies, +7.1%. Asian entrées fell 8%, per Nielsen.
After peaking in 2012, away-from-home sandwich purchases have leveled off, down from 3.8 per week to 3.6 per week in 2014 (Technomic, 2014b). Half (49%) of adults buy sandwiches from the “grab-and-go” section; 72% of men aged 25–34 do so. Over half of adults (55%) are willing to pay more for a fresh sandwich (Technomic, 2014b).
Burgers, deli sandwiches, chicken breast hoagies, and tacos/burritos are the favorite luncheon sandwiches away-from-home (Technomic, 2014b). Banh mi, lobster roll, muffuletta, pulled pork, brisket, torta, shrimp po boy, and Cuban were among the sandwiches with the fastest-growing sales in restaurants in 2013. Tilapia, fried eggs, slow roasted and smoked pork, and fried oysters are among the sandwich proteins with the greatest increases in popularity (Datassential, 2014).
Half of adults prefer their sandwiches toasted or grilled, up from 36% in 2010; 71% would order more Italian sandwiches, 66% Mexican, and 37% Mediterranean, if available (Technomic, 2014b). Gruyere, goat, Gouda, fontina, queso, brie, and fresh mozzarella were among the sandwich cheeses that showed the most sales growth in restaurants in 2013; yogurt, bourbon, mint, garlic/chipotle/pesto aioli, tzatziki, and wasabi were emerging toppings (Datassential, 2014).
--- PAGE BREAK ---
Pretzel, flatbread, brioche, onion rolls, marble rye, Texas toast, sourdough, sesame seed, panini, and Cuban breads were the fastest-growing restaurant sandwich/burger carriers (Datassential, 2014).
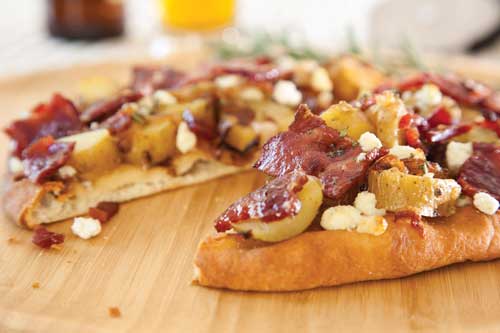 Mediterranean, buffalo chicken, pesto, BBQ chicken, Sicilian, and taco were among the fastest-growing pizza varieties in restaurants in 2013; pancetta, egg, calamari, salmon, pear, and blue cheese were up-and-coming toppers (Datassential, 2014).
Two-thirds (64%) of those aged 18–44 order sandwiches as a snack away-from-home, primarily in the midafternoon; 35% of those aged 45+ do so. One-third (35%) want more mini-sandwiches they can eat as a snack, up from 26% who expressed that preference in 2010 (Technomic, 2014b).
The emerging fresh protein snack category represents a $19 billion store-wide opportunity (Dudlicek, 2014). Volume sales of other deli snacks jumped 74%, and meat/cheese snack sticks were up 22% for Y/E May 31, 2014, per Nielsen (IDDBA, 2014).
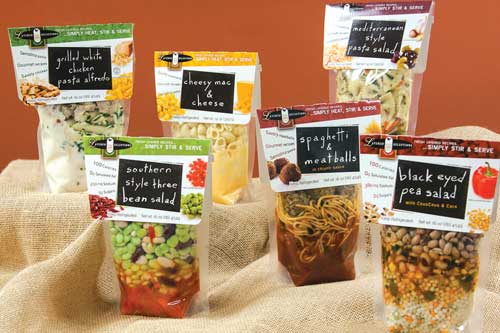
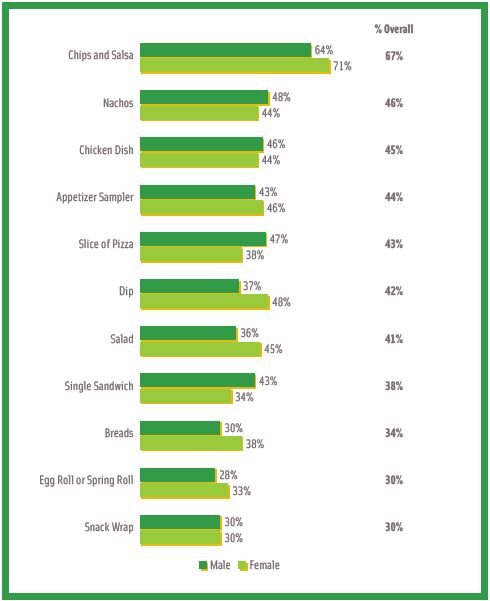
With 28% of consumers eating four to five mini meals per day in 2013, 66% wanting snacks that provide sustenance, and 45% seeking portable snacks, savory on-the-go fresh deli snacks (e.g., empanadas or handheld pot pies) will find a welcome market (Wyatt, 2014). For perspective, frozen snack appetizer sales grew 11.5%, frozen handheld non-breakfast entrees 3.4%, and refrigerated handheld non-breakfast entrees 3.2% in 2013, per IRI (Wyatt, 2014). (See Figure 1 for an overview of some of consumers’ snack preferences.)
Only 4% of purchases in the deli involved breakfast items, according to ICC Decision Services (IDDBA, 2015). Flatbread/panini breakfast sandwiches, Cubano sandwiches, breakfast pizza, and parfaits were among the fastest-growing early morning fare in restaurants (Datassential, 2014).
One-third of adults would be willing to pay more for fresh soup if it delivered a full serving of vegetables, was heart healthy, and/or high in protein. Interest in Asian-style and tortilla soups is growing (Technomic, 2014c).
Salsa is the dip most likely to be ordered away from home; 42% of consumers would order seafood dips, 42% spinach/artichoke dips, and 40% cheese dips (Technomic, 2013b). Hoisin, sweet chili, and salsa verde were among the appetizer sauces with the fastest-growing sales in restaurants in 2013 (Datassential, 2014).
Growing Sales
According to the Produce for Better Health Foundation, produce consumption is about the same as it was five years ago; 45% of fruits and vegetables are consumed in fresh form (Pivonka, 2014).
Random weight fruit and vegetables accounted for 29% and 28%, respectively, of the $56.2 billion produce sector sales for Y/E July 26, 2014; prepared salads accounted for 9.6%, organic 7.2%, local 5.5%, fresh-cut fruit 3.7%, packaged fresh-cut veggies 3.5%, and specialty exotics 2.3% (Major, 2014c).
Bananas were the most-purchased fresh fruit in 2013, bought by 85% of consumers, followed by apples 82%; grapes 70%; strawberries 65%; oranges 56%; watermelon 54%; peaches/blueberries/lemons, each 47%; and cantaloupe and avocados 42% (Packer, 2014).
--- PAGE BREAK ---
Tomatoes were the most-purchased vegetable, bought by 74%, followed by potatoes 72%; onions 71%; carrots 69%; bell peppers 63%; broccoli/celery, each 58%; cucumbers 57%; lettuce/salad mix, each 53%; mushrooms 47%; and cabbage/garlic, each 44% (Packer, 2014).
Pineapples, pears, value-added fruit, melons, and grapes posted the largest volume gains for fresh fruits for Y/E July 26, 2014, per Nielsen. Value-added cooking greens, value-added vegetables, potatoes, cooking vegetables, squash/pumpkin, cucumbers, packaged salads, and peppers were the fresh vegetables that showed the most sales growth (Major, 2014c).
Sales of single-serve fresh produce snacks are soaring, led by celery, +13% in 2013; cucumbers, +11%; apples, +9%; peppers, +7%; berries/tomatoes, each +6%; and carrots, +4% (Wyatt, 2014). See Favorite Away-from-Home Snacks (Based on responses consumers gave when asked which snacks they purchased at least once every 90 days and were told to check all that apply)
Branded fresh fruits and vegetables, with sales up 14% and 12%, respectively, for the same period, is another explosive produce trend (Strailey, 2014). Green Giant Fresh has introduced a line of fresh herbs.
Microwavable steam-in-the-bag vegetable side dishes with sauce (e.g., Green Giant Fresh’s Whole Baby Potatoes with Three Chile Sauce, continue to grab customer attention; 24% of consumers steam or boil fresh vegetables at least once a week (Packer, 2014). Mann’s Veggie Mac-n-Cheese meal kits contain fresh broccoli, ready-to-heat fresh pasta, and a cheese sauce.
High protein, all natural, and whole grain salads are gaining in popularity. Earthbound Farm Organic offers a new Blueberry & Quinoa & Baby Spinach PowerMeal Bowl.
Jackfruit, orange finger limes, Buddha’s Hands, Kiwano®, cherimoya, mandarinquats, and mangosteen were among the new specialty fruits showcased by Frieda’s at the Produce Marketing Association Fresh Summit held this past fall.
Caesar, garden/tossed, chef, grilled chicken, and taco are Americans’ favorite salad varieties; ranch, Caesar, Italian, French, balsamic, and blue cheese are the most popular dressings (Technomic, 2014c).
Kale, oyster mushrooms, pickled vegetables, brussels sprouts, sweet potato fries, and roasted butternut squash were the vegetables with the fastest-growing sales in restaurants in 2013; blood orange, quince, cipollini/spring onions, and roasted beets were fast-emerging newcomers (Datassential, 2014).
Fruit/vegetables sides, whole grain items, and entrée salads are among the hot kids’ menu trends for 2015; heirloom and hybrid varieties, uncommon herbs, and exotic fruits are popular for adult menus (NRA, 2014).
Sales of organic fruits and vegetables reached $13.4 billion, up 15% in 2013; 34% of consumers bought organic vegetables; 56% bought organic fruits (NBJ, 2014). Lastly, a full serving of vegetables or fruit is the claim most likely to convey health for nine in 10 consumers (Technomic, 2014a).
--- PAGE BREAK ---
Dairy Highs and Lows
Refrigerated dairy dips, spreads, and snacks posted the largest volume gains in the traditional dairy sector, followed by yogurt, for Y/E May 10, 2014, per Nielsen; milk sales dropped 1.2%. Sales of sour cream and cream cheese grew slightly; cottage cheese sales were down (IDDBA, 2015).
Less than 50% of American adults now drink milk, driving 2013 milk sales to their lowest point since 1984 (Anon., 2014). Protein-enriched milks/shakes, flavored milks, and milk from pasture-grazed cows are among the bright spots in fluid milk.
 Dean Foods, Lucerne, Borden, and Organic Valley all offer high-protein milk beverages. Organic Valley’s Organic Balance™ and Organic Fuel™ have 16 g and 26 g of protein, respectively.
Dean Foods’ TruMoo chocolate milk enjoyed a 45% jump in sales for Y/E Sept. 7, 2014, per IRI (Cernivec, 2014). Nestlé’s Nesquik comes in Girl Scout cookie flavors (e.g., Thin Mint). Hiland and other dairies are finding success with seasonal flavors like pumpkin and apple spice.
With more than 20 supportive clinical studies, the Milk Processor Education Program continues to promote chocolate milk as a natural solution for post-workout recovery. Shamrock Farms’ Rockin’ Refuel Muscle Recovery Milk contains 20 g of protein.
MilkSplash milk flavoring in mini squeezable characters targets kids with its Cookies N’Cream and Coco Loco flavors. Kroger’s Turkey Hill brand rolled out a fresh milk Ooo-La-Latte single-serve coffee drink; Kimball Brook Farm offers a milk-based iced cappuccino line.
Aussie, Bulgarian, European, and Vietnamese-style yogurts are among the new yogurt styles. Tarté Asian yogurt, by Tarte Foods, is lighter in texture, less sweet, and higher in protein than other yogurts. Greek yogurt now accounts for 44% of U.S. yogurt sales (Kennedy, 2014a).
Sweeter yogurts marketed as dessert; high protein yogurt; vegetable flavors; savory additives (e.g., olives, cilantro, or grains); and unusual flavors (e.g., watermelon) are among the hot yogurt trends (IDDBA, 2015).
Cream on top, rich whole milk, and full-fat yogurts are returning to the marketplace. Stonyfield Farm’s Smooth & Creamy is a whole milk yogurt. Dannon is broadening its reach into the dessert category with its Creamery brand pudding- and cheesecake flavor–inspired dairy desserts. Stonyfield’s spoonable sweet cheese, Petite Crème, is modeled after fromage blanc in France and eaten like a yogurt.
--- PAGE BREAK ---
Shredded, sliced, chuck, loaf, and string are the top-selling cheese forms in the dairy case; soft and mini cheeses posted gains (Kennedy, 2014b). Natural cheeses outsell processed varieties. Kraft Singles processed cheese slices now boast a “no artificial preservatives or flavors” banner on the package.
Norseland Inc.’s Jarlsberg Minis are mini cheese wheels dipped in wax and sealed in cellophane. Arla Foods Inc. USA’s Castello Burger blue cheese slices are cut to match the size of a standard burger.
Butterfield’s Lactose-free Butter is made with canola oil, filtered water, and butter fat and is casein-free. Unilever’s I Can’t Believe It’s Not Butter, now boasts, “100% Taste, 0 artificial preservatives.”
The NestFresh brand features non-GMO free range eggs. Zilk’s Green Chili Tzatziki Green Yogurt Dip is made with with chunks of cucumber, dill, garlic, and green chilies.
Organic dairy product sales topped $4.7 billion in 2013, up 8% over the prior year; sales of all natural dairy products were $3.8 billion, +15% (NBJ, 2014).
Drink Up
Refrigerated juice sales were relatively flat for Y/E May 10, 2014. Vegetable juice/drinks, cider, cranberry juice/drinks, and other juices also posted gains, according to Nielsen (IDDBA, 2015).
Pomegranate, celery, cranberry, carrot, apple, and pineapple were among the juices with the fastest-growing sales in restaurants in addition to juices described as natural, organic, or fresh-squeezed and those containing ginger (Datassential, 2014).
 Bolthouse Farms’ new Stone Fruit juice smoothie combines apricots, plums, peaches, and nectarines with ground chia seeds. Pomegranate, avocado, chocolate peanut butter, vanilla bean, mixed berry, apple, acai, cinnamon, and passion fruit round out the list of the top 10 fastest-growing smoothie varieties sold in restaurants in 2013 (Datassential, 2014).
For the year ending Sept. 7, 2014, IRI reports that refrigerated almond milk now leads sales in the dairy alternative drink category, up 47%. Coconut milk dollar sales jumped 35% in 2013; soy milk sales fell 16%, per Euromonitor (Cernivec, 2014).
WhiteWave Foods launched Silk Almondmilk Protein + Fiber; Dunkin Donuts added Blue Diamond Growers’ Vanilla Almond Breeze Almondmilk to its menu.
Dollar sales in the refrigerated tea category were up 6.5% to $928 million for Y/E Aug. 8, 2014, and refrigerated ready-to-drink coffee sales totaled $169 million, up 25.4%, according to IRI (Kennedy, 2014c).
On a Roll
Sales of all major fresh in-store bakery categories grew in 2013, topping $15 billion, up 6.4% vs the previous year (IDDBA, 2015). Breads, cakes, cookies, doughnuts, and rolls were the best-selling bakery items in 2013 (Major, 2014d).
Desserts, the largest fresh bakery category, accounts for 49% of sales, bread/rolls 29%, breakfast bakery 21%, and other/specialty items 2% (IDDBA, 2015).
--- PAGE BREAK ---
Bakery operators rank single/smaller-portion sizes, signature/gourmet items, gluten-free, celebration cakes, whole grain, and sugar-free among the up-and-coming opportunities in the market (Major, 2014d). Six in 10 adults eat whole/multigrain bread most often; 41% opt for white bread most frequently (IDDBA, 2015).
Two-thirds of consumers bought tortillas in 2013; 42% bought wraps/general flatbreads (nonethnic); 41% croissants; 41% Italian breads (e.g. focaccia, ciabatta); 37% seasonal breads (e.g., pumpkin); 36% European loaf breads (e.g., baguettes, pumpernickel); 36% flavored/artisan breads (e.g., rosemary); 35% Middle Eastern breads (e.g., pita, lavash, naan); 29% egg-based breads (e.g., challah, brioche); 28% pretzel bread; and 27% Indian breads (e.g., naan or chapati) (Mintel, 2014).
Preservative-free products; iced and oval cookies; handheld pies; spoonable desserts (e.g., puddings, custards); hybrids (e.g., cronuts); and lots of layers are among the hot bakery dessert trends (IDDBA, 2015).
Other fast-emerging trends in the bakery category include crunchy textures; lemon; pineapple; superfood (e.g., pomegranate); tea flavors; liquor-based flavors; seasonal fruit inclusions; honey; and ancient grains (e.g., kamut, spelt, amaranth).
Dawn Foods’ new Vortex cakes have a bottom layer of brownie or cookie and a top layer of cake with buttercream icing in between.
Non-wheat flours (e.g., rice, millet, peanut); ethnic flours (e.g., fufu, teff, cassava/yucca); and seeds (e.g., chia, flax) are among the hot 2015 culinary trends that involve breads (NRA, 2014).
Tarts account for 31% of fresh specialty dessert sales in in-store bakeries, followed by éclairs 19%, and dipped/covered treats 15%, cannoli 6.3%, baklava 4.9%, fudge 4.5%, cream puffs 3.7%, and cobblers/crisps 1.9% (IDDBA, 2015).
Desserts with the fastest-growing sales in restaurants include panna cotta and vanilla custard; coconut, caramel, and crème cakes; shortbread and Italian cookies; mini-tarts; crème pies; churros; ganache; and nut brownies (Datassential, 2014). Expect to see savvy bakery operators introducing more of these offerings.
Gluten-free made up less than 1% of total bakery sales in 2013 (IDDBA, 2015). Sales of organic bread/grains reached $3.8 billion in 2013, +12%; sales of natural bread/grains were $3.7 billion, +10% (NBJ, 2014).
With more than half of consumers trying to get more protein in 2014 and breakfast consumption shifting from high-carbohydrate foods (e.g., cereal, toast) to high-protein foods/drinks, protein-packed breads and breakfast bakery items are a very big idea (Jargon and Gasparro, 2014).
Gourmet and ethnic breakfast bakery items, Hispanic sweet goods, take-and-bake breads, and assemble-at-home cakes remain relatively untapped opportunities.
A. Elizabeth Sloan, Ph.D., a professional member of IFT and contributing editor of Food Technology, is president, Sloan Trends Inc., Escondido, Calif. ([email protected]).
References
Anon. 2014. Dairies must balance exports with growing domestic sales. Dairy Foods 115(11): 16-18.
A.T. Kearney. 2013. Fresh prepared food a growth driver for your company? Joint report with Technomic Inc. Available via Technomic Inc., Chicago, Ill. www.technomic.com.
Cernivec, S. 2014. Health in a nutshell. Beverage Industry 105(11): 12-14.
Datassential. 2014. Food and menu trends from Datassential. QSR 189(1): 4-25.
Dudlicek, J., Goldschmidt, B., and McTaggart, J. 2014. Strengthening the shopper experience. Progressive Grocer 93(11): 35-82.
FMI. 2013. The power of meat. Food Marketing Institute, Arlington, Va. www.fmi.org.
FMI. 2014a. Shopping for health.
FMI. 2014b. U.S. grocery shopper trends.
FMI. 2014c. The power of meat.
Hartman Group. 2013. Modern eating report. The Hartman Group, Bellevue, Wash. www.hartman-group.com.
IDDBA. 2014. Engaging the evolving shopper. Dairy-Deli-Bakery Association. Madison, Wis. www.iddba.org.
IDDBA. 2015. What’s in store.
IRI. 2013. MarketPulse Survey. IRI, Chicago, Ill. www.infores.com.
Jargon, J. and Gasparro, A. 2014. As cereal slips, a new battle over breakfast dollars. Wall Street Journal, July 22.
Kennedy, S. 2014a. The newest big thing is up for grabs. Dairy Foods 115(11): 82, 84, 86, 88.
Kennedy, S. 2014b. Fancy cheeses take spotlight. Dairy Foods 115(10): 42, 43.
Kennedy, S. 2014c. Sales for RTD and refrigerated tea, coffee are jumpin’. Dairy Foods 115(10): 22.
Major, M. 2014a. Meating in the middle. Progressive Grocer 93(2): 59-60, 62, 64, 66-67.
Major, M. 2014b. In the swim. Progressive Grocer 93(3): 79, 80, 82-84.
Major, M. 2014c. Horn of plenty: Progressive Grocer’s 2014 retail produce review. Progressive Grocer 93(10): 117, 118, 120, 122, 124.
Major, M. 2014d. Daily bread: Progressive Grocer 2014 in-store bakery review. Progressive Grocer 93(7): 89-92, 94, 96, 97.
Mintel. 2014. Bread and bread products—U.S. Sept. Mintel International, Chicago, Ill. www.mintel.com.
Nielsen. 2012. Fresh convenience. Fresh Perspective, Nov./Dec. Nielsen Perishables Group, Schaumburg, Ill. www.freshfacts.nielsen.com.
NBJ. 2014. Saving natural. Nutrition Business Journal. XIX(8): 1, 3-8.
NFI. 2014. Top 10 consumed seafood. National Fisheries Institute, MacLean, Va. www.aboutseafood.com.
NRA. 2014. What’s hot chef’s survey. National Restaurant Assn., Washington, D.C. www.restaurant.org.
Packaged Facts. 2012. Moms as food shoppers: grocery store and supercenter patterns and trends. November. Packaged Facts, Rockville, Md. www.marketresearch.com.
Parker, J. 2014. Understanding today’s produce consumer and reaching them in new ways. Presented at United Fresh Convention, Chicago, Ill., June 12.
Pivonka, E. 2014. Fruit & vegetable consumption. Presented at Campbell Vegetable Summit, Oct. 4.
Strailey, J. 2014. Budding brands. Progressive Grocer. 83(10): 126, 128, 130, 132, 134.
Technomic. 2013a. The flavor consumer trend report. Technomic Inc., Chicago, Ill. www.technomic.com.
Technomic. 2013b. The starters, small plates and sides report.
Technomic. 2014a. The healthy eating consumer trend report.
Technomic, 2014b. The sandwich consumer trend report.
Technomic. 2014c. The left side of the menu soup and salad report.
The Packer. 2014. 2014 Fresh trends survey. www.thepacker.com.
Wyatt, Lyons S., 2014. The state of the snack food industry. Presented at SNAXPO Snack Food Assn. Annual Meeting, Dallas, Texas, March 1-4.