Top 10 Functional Foods Trends
‘Senior Boomers,’ personalized nutrition plans, and men in the marketplace are changing the dynamics in the functional food sector.

Consumers are taking a more holistic view of health and nutrition—a view that reflects a rising fear of chemicals and artificial ingredients, a belief that fresh whole foods offer greater nutritional value, and the realization that foods can help prevent or mitigate even serious health conditions.
Fifty-five percent of U.S. households have members who are watching their diet. Of these households, 66% are doing so for general health reasons; 55%, to lose weight; 40%, to limit fat, sugar, sodium, etc.; 38%, to prevent future medical issues; 37%, to maintain weight; 22%, to treat a current medical condition; and 10%, to control a real or perceived food allergy/intolerance (Packaged Facts 2015a).
Three-quarters of Millennials think their diets could be healthier; 64% of those aged 70-plus feel that way (FMI 2015a). Younger adults aged 18–34 are the most likely to use functional foods (MSI 2014a).
Functional food sales topped $55.1 billion in 2015, up 7.7%, and are projected to reach $63.3 billion by 2017. Functional beverage sales are projected to reach $41.4 billion in 2017, which is up from $35.6 billion in 2015 (NBJ 2016).
Products associated with general heart health, cholesterol, digestion, energy, bone health, immunity, weight, and blood pressure are among the most consumed functional foods (MSI 2014a).
Although the traditional drivers of food selection—taste, price, convenience, health, safety, social impact, and, for some, sustainability—remain important, 51% of consumers are relying more heavily on a new group of “evolving drivers” when making food purchase decisions; these purchase influencers tend to be focused on clean labels and nutrition (Deloitte 2015).
These progressive health shoppers can be broken out into three groups. Members of the first group are described as “balanced buyers;” they are interested in balanced nutrition, nutrient content claims, fewer ingredients, no preservatives or artificial ingredients, and limited or no processing. A second group includes those who seek foods that are free from harmful elements, and the third group comprises naturally oriented buyers who prefer foods that are organic, all-natural, antibiotic- and hormone-free, and not genetically modified (Deloitte 2015).
This powerful bloc of more naturally driven shoppers is less trusting of large, national food/beverage brands and instead favors niche brands from smaller companies. Most important, the way consumers respond to these new drivers is very similar across all geographic regions, age groups, and income levels (Deloitte 2015).
Chemicals were the top food safety consumer concern in 2015, with the number of those who listed chemicals as their top concern up 13% over 2014; foodborne illness was next on the list of consumer concerns. Only 11% of adults said they were very confident in the safety of the U.S. food supply (IFIC 2015). Nearly half of adults changed a food purchase due to recent negative information about food chemicals (FMI 2015a).
The demand for cleaner labels continues to grow. In 2015, 25% of consumers looked for foods with short ingredient lists, up 10% from five years ago; 26% sought local foods, up 5%; and 27% looked for labels that contain only ingredients they recognized, up 7% (FMI 2015a).
All-natural, recognizable ingredients, and no artificial preservative ingredients remain the most desired attributes for clean labels; organic, gluten-free, etc. are second-tier concerns (MSI 2013).
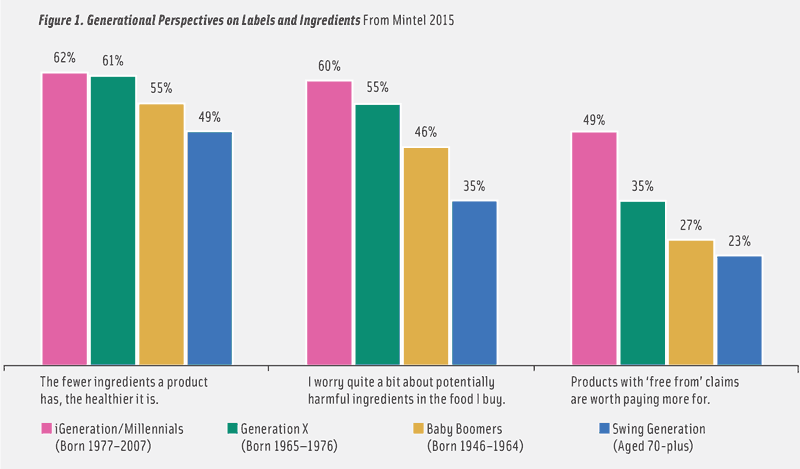
Millennial consumers tend to be more concerned than other demographic groups with clean eating; 75% of Millennials bought “cleaner” foods/beverages in 2015 versus 60% of consumers overall. So it is certain that simpler and less chemical-laden labels will become a long-term trend (Mintel 2015a; Figure 1).
Here’s a look at the top 10 trends shaping the functional foods market.
1. Gray Matters
By 2019, half of the U.S. population will be over 50 years old. Those 50-plus account for more than half of all consumer product spending, dominating dollars in 119 of 123 categories (IRI 2014). Hell-bent on redefining aging, they’ll drive the market for the next 20 years (U.S. Census 2010).
Adults aged 55–64 are the most likely to be trying to lose weight; those aged 65-plus are the most likely to be trying to maintain weight (Packaged Facts 2014a).
Over the past five years, the number of those 55 or older who work out at a gym jumped 14%. The increases were even more dramatic in several other areas. The number of those 55-plus who run/jog was up 87%, the number of those doing aerobic exercise climbed by 46%, and the number of those exercise walking increased by 25% (NSGA 2015).
Aging Boomers are trying to manage nearly 10 different conditions; they are treating 3.7 and trying to prevent another 5.8 (Hartman 2015a). Continuing normal activities and retaining mental sharpness with age are priorities for those aged 65-plus. Other top concerns include eye health, bone health, heart health, cancer, arthritis/joint pain, and muscle tone (HealthFocus 2015).
With older Boomers turning age 70 in 2016 and the youngest turning 52, stroke, circulation, mobility, sarcopenia, diverticulitis, regularity, and diabetes will all be very real concerns for those in this age group (AHA 2016).
By 2021, the number of Hispanics over age 50 will increase by 63% to represent 42% of the U.S. Hispanic population (U.S. Census 2010). Six in 10 Hispanic women aged 55-plus are watching their diet; 49% are doing so because of cholesterol concerns; 47%, blood sugar; 45%, high blood pressure; 36%, diabetes; 41%, weight; 27%, fat; and 25%, sodium (Mintel 2013).
On an average day, two-thirds of those 65-plus take a multivitamin; 46%, a calcium supplement; 45%, a fiber supplement; and 36%, a digestive remedy (IRI 2014). Sixty-five percent of those aged 50-plus are making an effort to consume more fiber; 61% are trying to consume more whole grains; 59%, more olive oil; 57%, more vitamin D; 56%, more antioxidants; 55%, more calcium; 53%, more nuts; 51%, more omega-3s; 44%, more plant-based protein; 39%, more oat bran; and 36%, more probiotics (Hartman 2015a). Older adults are the most likely to be watching their intake of sugar, salt, fat, and low-calorie sweeteners (IFIC 2015).
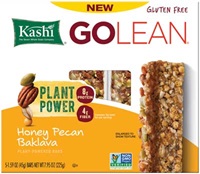 Women aged 55-plus are second only to adults aged 18–34 as the heaviest users of nutrition bars. Older consumers are key contributors to strong incremental sales for bars, energy/sports drinks, and refrigerated tea (IRI 2014). Boomer women, traditionally the heaviest diet soda users, are driving the trend to sparkling water. Older adults are the heaviest coffee and tea drinkers (BMC 2015).
Fifty-five percent of older adults regularly eat alone (Hartman 2014a). Right after Millennials, seniors are the most likely to eat frozen meals or use the microwave oven (Packaged Facts 2014b). Older adults are the most frequent breakfast eaters and least likely to substitute a snack for a meal. They’re more likely than others to snack on nuts, seeds, crackers, and chocolate candy (FMI 2015a, MSI 2014b).
Seniors average 81 more annual “eatings” of fruit than the average person and 87 more vegetable eatings (PBHF 2015). Older consumers are also the most likely to include salad side dishes, bread, and desserts with dinner (NPD 2015a). Those aged 55–64 are the highest per capita spenders at restaurants (NRA 2016).
 2. Chemical Consciousness
Clean claims now have more appeal than generally healthy descriptors. Preservative-free is second only to no trans fat/no partially hydrogenated oils as the most important consumer food claim (Mintel 2015a).
Eight in 10 adults define preservative-free foods/beverages as healthy, and 78% say no artificial ingredients translates to healthy. Other attributes associated with healthfulness include antibiotic- or hormone-free, natural, unprocessed, organic, not genetically modified, clean, and real (Technomic 2014a).
Fifty-one percent of adults are trying to avoid monosodium glutamate, and 49% are avoiding artificial colors/flavors (Hartman 2015a). Claims that a product is free from artificial colors/flavors doubled on new U.S. food and drinks offerings over the past five years. Millennial moms are the key target (Mintel 2015b).
Mars, General Mills, Smucker’s, and Campbell Soup are among the food companies that have announced at least partial removal of artificial colors/flavors. Half of beverage R&D executives plan to increase use of natural flavors in 2016; 8% plan to increase use of natural colors (Jacobsen 2016).
After removing 150 additives from its menu, Panera Bread is projected to post a sales gain of 5.4% in 2016 and 18.6% in 2017 (Zacks 2016). Noodles & Co., Subway, Yum Brands, Wendy’s, Taco Bell, and Pizza Hut are following suit. Whole Foods started banning ingredients in 2014 and currently has a list of 82 ingredients that may not be used in products sold in Whole Foods stores; Kroger’s Simple Truth line steers clear of 101 ingredients.
Consumers are most concerned about additives in frozen foods, snacks, and breakfast cereals (Mintel 2015a). Over the past decade, the percentage of adults who “agree a lot” that frozen foods had little nutritional value jumped 40%; the number of those who agree somewhat climbed by 20% (Packaged Facts 2014b).
Just over half of consumers (55%) tried to limit or entirely avoid sugars in general. Breaking it out further, 48% avoided high fructose corn syrup; 45%, low-calorie sweeteners; 37%, aspartame; 33%, fructose; 31%, saccharin; 29%, glucose; 25%, sucralose; 20%, stevia; 13%, acesulfame-K; and 9%, erythritol (IFIC 2015).
From July 2012 to June 2015, use of non-nutritive sweeteners in new U.S. foods/beverages fell 16%; use of aspartame declined 34%; acesulfame-K, -15%; and sucralose, -8%. Use of natural non-nutritive sweeteners increased 18%; use of monk fruit as a sweetener jumped by 55%, and use of stevia climbed 15% (Mintel 2015b).
Natural sweeteners (e.g., agave, honey, concentrated fruit juice, and maple syrup) are among the hot culinary ingredient trends for 2016 (NRA 2015). Six in 10 consumers would pay more for a beverage that is naturally sweetened (Technomic 2014b). Consumers most often watch sugar content in carbonated soft drinks, juice, ice cream, yogurt, and cookies (Mintel 2015c).
More than one-third of consumers are willing to pay more for antibiotic- and hormone-free foods; 51% avoid products with antibiotics and hormones (Hartman 2015b). Four in 10 shoppers bought organic meat/poultry in 2015; free-from hormones/antibiotic was the major reason (FMI 2016). Avoiding pesticide residues is driving purchases of organic produce (FMI 2015b). Unilever’s Breyers and Ben & Jerry’s brands are now hormone- and antibiotic-free.
Half of dog owners and 44% of cat owners look at the ingredient list first, origin second. Sales of natural pet foods reached $12 billion in 2014 (Packaged Facts 2015b).
 3. Personalized Nutrition Plans
Americans are experimenting with specialized eating styles/diet plans and designing personalized eating strategies (e.g., intermittent spurts of fasting, detox cleanses, or vegetarian eating) that best meet their own nutritional goals.
In 2015, 30% of food shoppers participated in at least one specialized eating plan (FMI 2014). Millennials, who were the most likely to adopt a specialized eating approach as well as the most likely to try more than one plan, tended to favor vegetarian, juice cleanse/detox, Paleo, or vegan styles of eating; older generations were the most likely to go lactose-free (FMI 2015a).
Also last year, 71% of shoppers regularly or occasionally prepared more meatless, plant-based, or meat alternative meals for dinner. Seventy-eight percent served eggs as the protein source; 61%, beans, lentils, or legumes; 28%, quinoa/whole grains; 24%, veggie burgers; 18%, seeds/nuts; and 14%, soy/tofu/tempeh (FMI 2015c).
In 2014, 2% of consumers (vegans) avoided all animal products; 17% made some effort to follow a vegetarian diet (MSI 2014a). Soy dominates as the protein source; it is found in 71% of U.S. meat alternatives, followed by wheat protein, 34%; pea protein, 18%; and milk protein, 3% (Mintel 2015d).
Almond milk now accounts for 65% of sales in the alternative beverage segment; soy milk accounts for 25%; and rice milk, 5% (Jacobsen 2016). Lactose-free whole and skim milk enjoyed gains of 15.4% and 6.6%, respectively, for the year ended Aug. 9, 2015 (IRI 2015a).
In 2015, 12% of shoppers had a household member with a food allergy/sensitivity (FMI 2015a). Four million kids under the age of 17 suffer from true food allergies (NCHS 2015). One in five adults tried to avoid gluten in 2015; 6% ate gluten-free foods daily (Hartman 2015a).
While the relatively small group of core gluten-free users continues to grow, consumers’ belief in the movement’s fundamental drivers (i.e., that gluten-free foods are healthier) fell from 46% in 2010 to 25% in 2014. The number who are going gluten-free to manage their weight dropped from 30% to 19% (Packaged Facts 2015c).
In 2015, 59% of adults made an effort to lose weight; 29% made an effort to maintain their weight (IFIC 2015). Calorie counting remains the most popular weight-loss behavior, used by half of those trying to lose weight, followed by meal replacement shakes/bars, chosen by 24%; raw food, vegetarian, or vegan diets, chosen by 19%, and a high protein diet, selected by 18% (Mintel 2015e).
Four percent of adults participated in the Weight Watchers program in 2015; 3% chose Atkins, Mediterranean, Paleo, or vegan diet regimens; and 1%, South Beach Diet, Jenny Craig, or NutriSystem programs (FMI 2015a).
Four in 10 parents would buy a weight-loss food/beverage for their child (HealthFocus 2015). More than one-quarter of all food shoppers look for low-calorie claims, down 9% over the past five years (FMI 2015).
One in five shoppers looked for low-carb claims on the label in 2015, down 19% over the past five years (FMI 2014, 2015a). Two-thirds of adults look for foods to help them feel fuller longer (HealthFocus 2015).
 4. A New Natural Hierarchy
For 2016, minimally processed foods/natural ingredients were cited for the first time among the top “hot” culinary trends identified by American Culinary Federation chefs (NRA 2015).
One-quarter of consumers say that their food habits characterize them as living a minimally processed lifestyle; 30% are making a strong effort to eat more minimally processed foods (NBJ 2015a; MSI 2014a). Fresh eatings rose 20% over the past decade and are projected to increase another 6% by 2018 (NPD 2015b).
In 2015, natural and non-GMO tied as the second most preferred “less processed” claims, behind no artificial ingredients/preservatives. Thirty-seven percent of shoppers sought out no preservative claims; 26%, non-GMO or natural; 20%, certified organic; and 10%, gluten-free (FMI 2015a).
Although half of consumers are still unsure of the definition of GMO, after hearing a brief definition, 45% would avoid GMOs if they could (FMI 2015a). Four in 10 (39%) bought a food product with a GMO-free label in 2015. Moms with kids under age 11 are the most concerned about GMOs (Packaged Facts 2015d).
Campbell Soup announced it will label GMOs on its products; Hershey will remove all GMOs from its chocolate candy. Specialty food retailers project non-GMO will be the most important label claim in three years (SFA 2015).
Thirty-five percent of consumers bought organic in part to avoid GMOs (Packaged Facts 2015d). According to the latest data available, in 2014, organic foods/beverages posted $36 billion in sales (OTA 2015).
Fruits/vegetables is the largest organic category with sales of $13 billion, followed by dairy at $5.6 billion. Other leading categories for organic food sales include packaged foods, $5.3 billion; beverages, $4.3 billion; breads/grains, $4.1 billion; snacks, $2 billion; and meat, poultry, and fish, $758 million (OTA 2015).
Seventy-three percent of consumers buy organic products occasionally; 9% do so daily. Millennials have the strongest tie to organics; 86% of Millennials buy organic products at least occasionally, followed by 72% of Gen Xers and 63% of Baby Boomers.
“Made with organic ingredients” is a fast-emerging trend important to 41% of Millennials, 29% of Gen Xers, and 19% of Boomers (Hartman 2015b). Organic is the top hot beverage trend for 2016 (Jacobsen 2016).
Although the U.S. Food and Drug Administration is currently seeking public comments through May 10, 2016, on defining the term natural, recent class action lawsuits have caused many food manufacturers to minimize their use of the term despite its strong consumer appeal.
Third-party certifications increasingly are playing an important role in verifying product quality; 71% recognize the USDA organic seal; 51%, non-GMO verified; and 34%, the Fair Trade Certified logo (NMI 2016).
Eighty-three percent of consumers occasionally buy local foods; 40% believe they are healthier. With four in 10 consumers defining local foods as being from their state, state-branded foods, such as Michigan tart cherries or Indiana Grown products, also enjoy a healthy halo (FMI 2015a).
Estate brands, hyper-local sourcing, and hydroponic gardens are other emerging concepts signaling healthy foods. In 2015, 24% of consumers thought a lot and 47% thought some about how their food was produced (IFIC 2015). Two-thirds are very interested in meat and poultry grown or raised in the United States, and 59% feel that way about produce (FMI 2016). Foods that are grass-fed, farm-raised, or free-range/cage-free are considered healthier by consumers (Technomic 2014a).
 5. Lifestyle Enhancers
Consumers, especially women and younger adults, are increasingly concerned about conditions that impact their ability to function day by day, (e.g., stress, tiredness, muscle/joint pain, mental alertness, neck/back pain, or frequent colds/infections).
Having too much stress and too little energy are the top reasons that Millennials and Gen Xers initially become involved in health/wellness; 53% and 45%, respectively, are trying to manage these issues (Hartman 2013).
Food/beverages that provide energy throughout the day appeal to 30% of adults; 26% are looking for mental energy; 14%, morning energy; and 7%, an energy boost later in the day (HealthFocus 2015).
Despite health concerns, sales of energy beverages, up 6% in 2015, and ready-to-drink coffee, up 7%, posted the strongest growth in the beverage sector, albeit from a smaller base (BMC 2015). In mass channels, sales of energy shots fell 2.8% for the year ended June 14, 2015 (IRI 2015b).
Six in 10 Millennials used energy drinks/shots in 2015; young Hispanic men are the heaviest consumers. The majority of users mix energy drinks/shots with other beverages to dilute ingredients and improve taste. Extra protein and all-natural ingredients are the top two attributes that would increase the appeal of these products (Mintel 2015f).
A healthy mind, cited by 66%, is now nearly as important as a healthy body, cited by 73%, as a key reason for living a healthier lifestyle (NMI 2015). One-quarter of adults are interested in buying foods/drinks that promote mental alertness (HealthFocus 2015).
Cognitive health is among the top 10 hot beverage trends for 2016, according to industry executives surveyed by Beverage Industry magazine (Jacobsen 2016). Twenty-nine percent of all new global sports/energy drinks launched between November 2014 and October 2015 carried a brain and/or nervous system claim (Mintel 2015f). Omega-3s, ginkgo biloba, maca, B-vitamins, and botanicals are among the hot ingredients (NBJ 2015b).
Mainstream consumers are also looking to the $33 billion sports nutrition sector to more rapidly improve their everyday performance, weight loss, or anti-aging efforts (NBJ 2015c). Just over half of adults are giving the amount of physical activity they get a lot of thought, up from 41% in 2014. Fifty-five percent of adults consider themselves moderately active; 11% say they are vigorously active (IFIC 2015).
Ninety-six million adults are exercise walkers, and 39 million do aerobics; teen workouts are also on the rise (NSGA 2015). Sales of sports nutrition powders topped $4.8 billion, +11.2% in 2015; weight loss meal replacement sales were $3.7 billion, +10.8; and hardcore sports drinks, $599 million, +16.8% (NBJ 2015c).
With 61% of kids active in outdoor and/or team sports, sports bars/drinks formulated specifically for the needs of children are a very big idea (PAC 2015).
Although not yet widespread functional food/drink concepts in the United States, products that support the immune system, help burn fat and calories, or aid sleep are important to nearly five out of 10 consumers (47%). In addition, 41% say they would be interested in products for healthier skin (HealthFocus 2015).
 6. Definitely Deficient
According to the 2015 Dietary Guidelines for Americans, some nutrients are consumed by many Americans in amounts below the Estimated Average Requirement or Adequate Intake levels; such nutrients include potassium, dietary fiber, choline, magnesium, calcium, and vitamins A, D, E, and C. Iron is under consumed by teenage girls and women aged 19 to 50. Calcium, potassium, fiber, iron, and vitamin D shortfalls were identified as a public health concern (USDA 2015).
Sixty-four percent of adults regularly looked for foods/beverages with added vitamins/minerals in 2015. Although this percentage has dropped 9% over the past five years, 82% feel that fortified foods are a convenient way to get their nutrients and that they’re extremely important for kids (Hartman 2015a; MSI 2014a).
Six in 10 adults made an effort to eat more dietary fiber; 56%, more whole grains; 54%, more protein; 53%, more vitamin D; 52%, more calcium; 51%, more antioxidants; 46%, more omega-3s; 39%, more fish oil; 39%, more iron; 36%, more probiotics; and 26%, more potassium (Hartman 2015a, IFIC 2015).
Multivitamins, followed by omega-3s, vitamin D, B-vitamins, calcium, vitamin C, magnesium, iron, and vitamin E, are the most frequently taken supplements (NBJ 2015d). Use of vitamin D, magnesium, iron, coenzyme Q10, and biotin are at historically high levels. Vitamin D, vitamin A/carotenoids, and B vitamins led vitamin sales gains; magnesium, chromium, selenium, iron, and zinc—in descending order—were the mineral “hot spots.”
Sales of probiotics were up 12.4% last year; omega-3s, glucosamine, and melatonin led specialty supplement sales; turmeric and multi-herb formulations were also double-digit winners (NBJ 2015d).
In 2014, 57% of consumers were aware of amino acids, 37%, whey protein; 34%, krill oil; 32%, lycopene; 31%, coenzyme Q10; 31%, acidophilus; and 30%, lutein (MSI 2014a).
Eight in 10 consumers believe that protein can help maintain muscle during aging; 77% think it enhances recovery from exercise; 73% say it helps with satiety; and 65% say it aids weight loss. Seventy-one percent agree that it is important to distribute protein intake throughout the day (IFIC 2015).
Half of consumers would be more likely to buy a beverage if it were antioxidant-rich (Technomic 2014b). Vitamin/nutrient enhancement would persuade 23% of adults to buy one juice over another (Mintel 2014a).
Milks fortified with protein, extra calcium, and vitamin D enjoyed brisk sales for the year ended Aug. 9, 2015 (IRI 2015a).
Two-thirds of nutrition bar users and 53% of those who consume cereal/granola bars seek out foods with nutrients that target specific conditions (Packaged Facts 2015e).
Consumers say that getting nutrients in the morning is even more important than avoiding negatives, having real food, or using the best quality ingredients (FMI 2015a). Four in 10 moms say that they would buy fortified breakfast/cereal/snack bars or yogurt for their kids (HealthFocus 2015).
Gallup reports that those making a strong effort to consume nutrients, probiotics, fiber, calcium, protein, omega-3s, and organic foods and to limit additives—about 30% of adults—are also making a strong effort to eat more fresh foods, suggesting nutrient-conscious fresh advocates would be receptive to more widespread fortification of fresh fare (MSI 2014a).
The timing is perfect for the expanded fortification of fresh foods; 44% often or always choose fresh foods/drinks because of the nutrients they contain (HealthFocus 2015).
7. Food MD
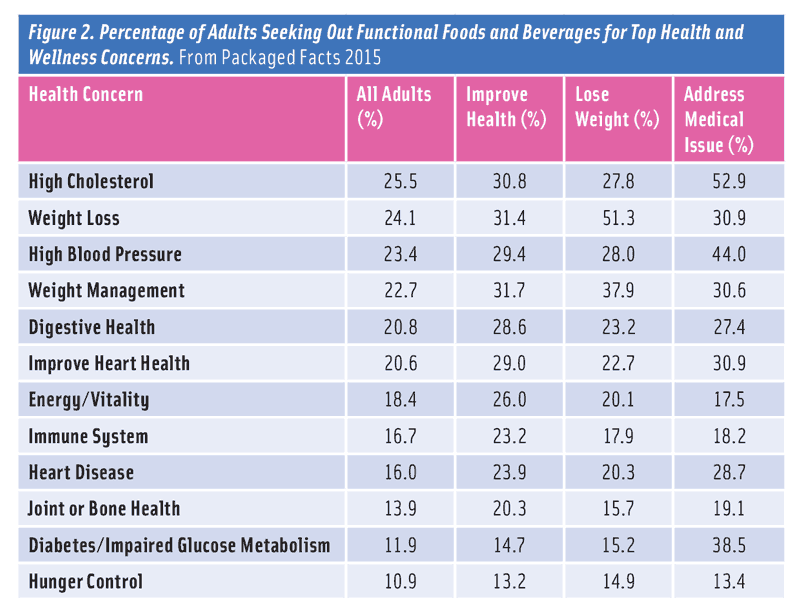
High cholesterol, followed by weight loss, high blood pressure, weight management, digestive health, improving heart health, energy, immunity, and joint/bone health are the top health concerns motivating consumers to seek out functional foods/beverages (Packaged Facts 2015a; Figure 2).
One hundred million U.S. adults have cholesterol levels over 200 mg/dL and 31 million have cholesterol levels over 240 mg/dL; 74 million have undesirable LDL cholesterol levels, and 45 million have low HDL levels. White women and Hispanic men have the highest prevalence of high cholesterol (AHA 2016).
Although the percentage of food shoppers who said a trans fat, saturated fat, or general fat content claim is very important has fallen over the past five years, trans fat claims were still very important to 49% of consumers, saturated fat to 47%, and general fat content to 45% in 2015 (FMI 2014, 2015a).
One in five food shoppers (22%) looked for a heart-healthy claim, and the same percentage sought a cholesterol-lowering claim (FMI 2015a). Eighty million adults have high blood pressure, and 30% of adults have prehypertension. African Americans are the most likely to be afflicted (AHA 2016). Salt/sodium claims were very important to 42% of shoppers in 2015 down 17% from five years ago (FMI 2014, 2015a).
Omega-3s, fiber, antioxidants, and magnesium are the top heart health ingredients; hydroxytyrosol and pterostilbene are among the emerging natural cholesterol-lowering ingredients. Global sales of phytosterols are projected to grow 8.7% annually to $721 million by 2020 (R&M 2015).
Digestive issues affect 60–70 million adults and increase with age (NIDDK 2015). Seventy-eight percent of consumers are aware of probiotics, and 44% are aware of prebiotics. Eight in 10 adults link probiotics to digestive health and 49% to immunity. One-third are very/extremely interested in probiotics for digestive health and 31% for immunity (HealthFocus 2015).
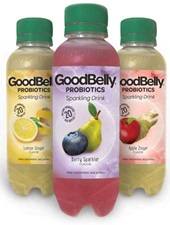 Sales of probiotic supplements jumped 14.2% to $1.2 billion in 2014 (NBJ 2015d). The yogurt category’s dollar sales grew 3.2% to $7.4 billion for the year ended Aug. 9, 2015, while unit sales were at a standstill (IRI 2015a). Inulin received a health claim approval in the European Union in 2015.
Nearly half of consumers say they would be very interested in foods/beverages that promote healthier/stronger bones, and 45% would be very interested in products that promote joint flexibility. Fifty-four million people have osteoporosis or low bone mass (HealthFocus 2015b, NAF 2015).
One in five adults—50 million—has arthritis; two-thirds are under age 65. One in five people under age 44 suffered from occupational joint pain in the last month; Hispanics suffer disproportionately from joint pain (NOF 2015).
Among those treating a medical issue with diet, diabetes ranked third (Packaged Facts 2015a). In 2014, 29.1 million Americans had diabetes and 86 million prediabetes; there are 1.4 million new cases diagnosed each year (ADA 2015).
While those that are not affected by diabetes don’t believe they are at risk, about half of shoppers are aware of/very interested in low glycemic foods (HealthFocus 2015).
Protection against diseases later is life is a health issue that half of mothers are extremely/very concerned about. Fifty-three percent are concerned about mental development, and 42% have concerns about proper eyesight development (HealthFocus 2015).
With two National Eye Institute AREDS studies identifying important ingredients that affect eye health, eye health is no longer an elusive opportunity for food marketers. A growing number of people are aware of its importance.
 8. Wholly Functional
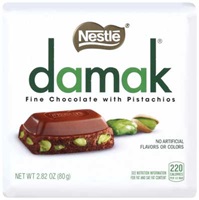
When it comes to staying healthy, consumers have long thought that Mother Nature knows best. One-third strongly agree that naturally occurring nutrients in foods are better for them than added nutrients; 36% agree somewhat; and 30% of adults describe themselves as living a “whole foods” lifestyle (Packaged Facts 2015a, NBJ 2015a).
Six in 10 prefer to get their antioxidants from foods; 47% want to get calcium that way; 44%, omega-3s; and 41%, probiotics (Hartman 2013).
For nine in 10 consumers, “contains a full serving of vegetables or fruits” is the claim most likely to convey health, followed by “high in nutrients” and “high in protein.” Moreover, 59% of consumers think foods with a full serving of fruit are tastier, and half (50%) feel that way about vegetables (Technomic 2014a).
Chips and breads that deliver a full serving of vegetables are among the hot product trends. One in five adults drink vegetable juice; 62% are expected to increase use (Technomic 2014b).
Varietals that naturally deliver higher levels of nutrients, such as high vitamin D mushrooms or meats/dairy sourced from animals fed higher-nutrient feeds (e.g., high omega-3 eggs), will be in demand.
Despite widespread interest in healthful eating, per capita fruit and vegetable consumption has declined 7% over the past five years. This has been driven primarily by decreased consumption of vegetables (-7%) and fruit juice (-14%). Fruit consumption has increased among children and those aged 18–44 (PBHF 2015).
More than half (56%) of consumers believe that superfoods provide exceptional health benefits (Packaged Facts 2015a). Anthocyanins joined polyphenols as the most marketable mass market phytonutrients followed by flavonoids and resveratrol (Sloan 2015).
Spices and herbs are fast being recognized for their nutritional properties and great taste. Cinnamon, ginger, and mint are projected to be among the top 20 best-selling beverage flavors for 2016 (Jacobsen 2016).
Cranberry, cinnamon, and flaxseed/oil were among the best-selling herbal supplements in mass channels; turmeric, grass (wheat and/or barley), flaxseed/oil, aloe vera, spirulina, blue green algae, elderberry, and mace were best sellers in the natural channel (Herbalgram 2015).
Cold-pressed juices and oils, which help retain higher levels of natural nutrients, pickled and fermented foods (e.g., kefir and kombucha), and cold-brewed coffee are gaining in popularity (IRI 2015a). One-third of Millennials want sparkling flavored waters made with real juice (Packaged Facts 2014c).
Ancient grains ranked 15th out of the top 250 hot culinary trends identified by American Culinary Federation chefs for 2016. High-protein grains made the list for the first time. Kamut, spelt, amaranth, lupin, chia, quinoa, flax, non-wheat flours (e.g., peanut, millet, barley, and rice), ethnic flours (e.g., tutu, teff, cassava, yucca, and farro), lentils, and exotic rice are also among the strong grain/pulse-based trends (NRA 2015).
High-protein nuts and seeds are making significant nutritional contributions to a wide variety of food products. Marketers would be wise to more specifically call them out. Authentic ingredients are very important to nearly half of Millennials (Technomic 2014a).
Interest in whole foods is spawning a lucrative new supplement sector—whole food supplements—for which sales are projected to reach $2.7 billion by 2017; fruit/vegetable supplements have enjoyed three years of double-digit growth (NBJ 2015d).
 9. Healthy Convenience
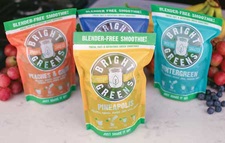
Americans are on the move, and they want to take their healthy habits with them. Half of away-from-home snacks are eaten en route, when driving or walking; 43% of such snacks are consumed at work (Technomic 2014c).
One in five adults eats on the run, grabbing food whenever they can (Wyatt 2015). Fifty-five percent of households have at least one brown bagger; 20% bring beverages from home (Acosta 2015).
Snacks account for nearly half of all meal occasions; 16% of all eating occasions are immediate consumption, with food eaten within 60 minutes of purchase (Hartman 2014a).
Millennials eat round the clock; 12% of their eating occasions are at breakfast; 16% are an early morning snack; 15%, lunch; 17%, an afternoon snack; 18%, dinner; and 20%, an evening snack (Hartman 2014a).
Twenty-one percent of those aged 18–34 snack on hummus; 15% go for nutrition bars; 15%, veggie chips and/or dried meat snacks; and 11%, rice cakes. In addition, 25% drink fruit smoothies; 16%, herbal tea; and 14%, vitamin-enhanced water and/or drinkable yogurt (MSI 2014b).
Apple chips, ready-to-eat popcorn, meat snacks/jerky, and seeds posted the highest gains in the salty snack category for the year ended April 19, 2015 (Levin 2015). A new early morning snack occasion holds great promise; breakfast liquid meal replacements are another timely trend (Wyatt 2015).
Refrigerated snacks were among the best-selling grocery snacks in 2015; fresh snack packs topped $19 billion in sales (Nielsen 2015a).
Mini meals are a missed opportunity for food marketers; more than a quarter of consumers (28%) eat four or five mini meals a day (Wyatt 2015). Half of adults want the foods they eat as snacks to be different from those consumed at mealtimes (Technomic 2014c).
One-third of adults are eating more mini meals than they did a few years ago; only 22% snacked more instead of having a smaller meal (Packaged Facts 2014b). America’s 48 million foodies are 47% more likely than the general population to eat several small meals per day; 56% prefer to snack only on healthy foods (Packaged Facts 2015f).
Refrigerated lunches were the fastest-growing food/beverage category for the year ended Nov. 1, 2015, +14.2% (IRI 2015c). Grab-and-go meal solutions topped $17 billion in mass channels for the year ended January 18, 2015, per IRI (Anon. 2015).
Deli-prepared grab-and-go items displayed top dollar growth in fresh departments in 2015; sales of seafood sides were up 21%; deli drinks, +18%; deli prepared breakfast foods, +16%; deli prepared soups, +15%; and produce beverages, +14% (Nielsen 2015b).
Lettuce wraps, ahi tuna, hummus, meatballs, flatbread, cheese dip, and tempura are the fastest-growing appetizers in foodservice (Datassential 2015). Frozen appetizers/snacks are among the top five categories consumers say are very important for delivering new products, cited by 39% (Acosta 2015).
Granola/cereal bars are projected to reach $3.2 billion in sales by 2017, up 1.4%. Nutrition bar sales will jump 9.2% to $3.6 billion (Packaged Facts 2015e).
When it comes to home food preparation, convenience, price, and healthfulness have become equally important to home preparers (FMI 2015a).
While packaged meal kits, frozen stir-fry dinner kits, refrigerated/frozen entrees, and refrigerated heat-and-eat potatoes are among Millennials’ most purchased convenience foods, these products would benefit from a health upgrade (MSI 2014d).
 10. Men in the Aisles
With men accounting for 43% of primary food shoppers, 46% of men helping with daily food preparation, and single male households on the rise, catering to the health/wellness goals of America’s 114 million men is a smart marketing strategy (FMI 2015a).
Claims related to sodium content are very important to 56% of male shoppers, followed by claims related to sugar content, which are very important to 52%; calories, 50%; total fat, 50%; trans fat, 49%; cholesterol, 48%; saturated fat, 47%; and protein, 46% (Packaged Facts 2015a).
After general health, men are most likely to take supplements for heart health, energy, immunity, aging, and joint health. They’re more likely than women to use omega-3s, protein, and energy supplements (MSI 2014c).
Men are most likely to be watching their diet to control heart disease, cholesterol, or hypertension (Packaged Facts 2015a). Forty-five million men have cholesterol levels over 200 mg/dL; 35 million have high LDLs; 32 million have low HDLs; 38 million have high blood pressure; and 11 million have diabetes (AHA 2016).
Over the past five years, men drove 69% of the growth in the weight control sector; men aged 18–34 accounted for 43% of the gains in the weight maintenance segment (Packaged Facts 2014a). Eighty-two million men are overweight; 39% are obese (AHA 2016).
The number of men who exercise regularly jumped 12% over the past five years (Packaged Facts 2014a). Thirty-seven million men are exercise walkers, 25.9 million exercise with equipment, 18.6 million work out at a club, and 16.9 million are runners (NSGA 2015).
Four in 10 men regularly use a sports nutrition product (TABS 2015). Forty-two percent of men use a liquid protein supplement, and 16% consume a liquid meal replacement (Mintel 2014b).
Although men are less likely to experiment with nutritional eating styles than women—67% versus 73% in 2015—they were slightly more likely to try a lactose-free diet, detox cleanse, or the Mediterranean diet. Last year 6% of men tried a vegetarian regimen; 5%, gluten-free; 4%, dairy-free or a raw food diet; 3%, Weight Watchers, Atkins, or a vegan regimen; and 2%, the Paleo diet (FMI 2015a).
Four in 10 men would avoid GMOs if they could, slightly fewer than women. Men are most likely to equate preservative-free descriptors with healthy food, followed by no artificial sweeteners, antibiotic-free, natural, hormone-free, unprocessed, GMO-free, organic, clean, and real (Technomic 2014a).
Health is very important to more than a quarter of male meal preparers (26%). Male cooks show above average use of value-added produce (FMI 2015b). Men under age 45 consume fruits, vegetables, and fruit juice at below average intake rates (PBHF 2015). Four in 10 men are trying to snack more healthfully (Technomic 2014c).
For the first time in 2015, male specialty/gourmet food shoppers outnumbered women (SFA 2015). One-quarter of men would buy more prepared meals if they were healthier (FMI 2015a).
A. Elizabeth Sloan, PhD, a professional member of IFT and contributing editor of Food Technology, is president, Sloan Trends Inc., Escondido, Calif. ([email protected]).
References
ADA. 2015. National Diabetes Statistics Report. American Diabetes Assoc., Chicago. diabetes.org.
AHA. 2016. Heart Disease and Stroke Report. American Heart Assoc., Dallas. heart.org.
Anon. 2015. “On-the-Go Continues to Grow.” Progressive Grocer Products Showcase. Spring.
BMC. 2015. U.S. Liquid Refreshment Beverage Report. Beverage Marketing Corp., New York City. beveragemarketing.com.
Datassential. 2015. The Keynote Report: Appetizers. Chicago. datasssential.com.
Deloitte. 2015. Capitalizing on the Shifting Consumer Food Value Equation. Deloitte Consulting, Washington, D.C. deloitte.com.
FMI. 2014. U.S. Grocery Shopper Trends. Food Marketing Institute, Arlington, Va. fmi.org.
FMI. 2015a. U.S. Grocery Shopper Trends.
FMI. 2015b. The Power of Produce.
FMI. 2015c. The Power of Meat.
FMI. 2016. The Power of Meat.
Hartman. 2013. The Culture of Health & Wellness. The Hartman Group, Bellevue, Wash. hartman-group.com.
Hartman. 2014a. 2013–14 Compass Modern Eating Database.
Hartman. 2014b. The Organic & Natural Report.
Hartman. 2015a. Health & Wellness Report.
Hartman. 2015b. Sustainability Report.
HealthFocus. 2015. The 2015 HealthFocus Trend Report. HealthFocus Intl., St. Petersburg, Fla. healthfocus.com.
Herbalgram. 2015. “Sales of Herbal Dietary Supplements Increase by 7.9% in 2014.” No. 103: August–October.
IFIC. 2015. 2015 Food & Health Survey. International Food Information Council Foundation, Washington, D.C. foodinsight.org.
IRI. 2014. “Aging America: Carving Out Growth in Mature Markets.” Times & Trends, June. Information Resources Inc. Chicago. infores.com.
IRI. 2015a. MULO year ended Aug. 9, 2015.
IRI. 2015b. MULO year ended June 9, 2015.
IRI. 2015c. MULO year ended Sept. 6, 2015.
Jacobsen, J. 2016. “2016 New Product Development Outlook for Beverages.” Beverage Industry 107(1): 62, 63, 66, 70, 72.
Levin, L. 2015. “Snacking & Treating: What We Learned That Will Surprise You.” Presented at the Sweets & Snacks Expo, Chicago, May 19.
Mintel. 2013. Hispanic Diet and Wellness—U.S. March. Mintel Group Ltd., Chicago, mintel.com.
Mintel. 2014a. Fruit Juice & Juice Drinks—U.S. Nov.
Mintel. 2014b. Nutritional and Performance Drinks—U.S. Jan.
Mintel. 2015a. Free-from Food Trends—U.S. May.
Mintel. 2015b. “The Demise of Artificial.” Presented at IFT15 by Stephanie Mattucci. Institute of Food Technologists, Chicago, July 11–14.
Mintel. 2015c. “Consumers Souring on Sweet.” Presented by Stephanie Mattucci at IFT15.
Mintel. 2015d. “Meat Alternatives Benefit From WHO Push to Reduce Meat Consumption.” Dec.
Mintel. 2015e. “Weight Management Brands Can Tap into Demand from Metrosexual Males.” Dec.
Mintel. 2015f. Energy Drinks—U.S. May.
MSI. 2013. The 2013 Gallup Study of Clean Food & Beverage Labels. Multi-sponsor Surveys, Princeton, N.J. multisponsor.com.
MSI. 2014a. The 2014 Gallup Study of Nutrient Knowledge & Consumption.
MSI. 2014b. The 2014 Gallup Study of American Snacking Behavior.
MSI. 2014c. The 2014 Gallup Study of the U.S. Market for Vitamins & Other Dietary Supplements.
MSI. 2014d. The 2014 Gallup Study of Dinner.
NAF. 2015. Statistics. National Arthritis Foundation, Atlanta, Ga. arthritis.org.
NBJ. 2015a. “The Food Tribe Landscape in 2015.” Nutrition Business Journal. XX(2): 1–21. newhope360.com.
NBJ. 2015b. “Conditional Acceptance.” XX(9): 1–34.
NBJ. 2015c. “Looking for Bright Spots.” XX(5): 1–31.
NBJ. 2015d. Data Sheets. Top 100 Best Selling Supplements: Sales and Growth.
NBJ. 2016. Data Sheets. Functional Foods Sales and Statistics.
NCHS. 2015. FastStats. National Center for Health Statistics. cdc.gov/nchs.
Nielsen. 2015a. “Advanced Fresh Perspective. Year ended 6/27/15.” Nielsen Perishables Group, Schaumburg, Ill. nielsen.com.
Nielsen. 2015b. “Tops of 2015: U.S. Grocery.” Press release, Dec. 28. Nielsen.
NIDDK. 2015. National Institute of Diabetes and Digestive and Kidney Diseases, Bethesda, Md. niddk.nih.gov.
NOF. 2015. Statistics. National Osteoporosis Foundation, Arlington, Va.
NMI. 2016. 2016 Supplements/OTC/Rx 16th. Natural Marketing Institute, Harleysville, Pa. nmi.org.
NMI. 2015. Spectrums of Healthy Aging in America.
NPD. 2015a. The 29th Annual Eating Patterns in America Report. The NPD Group, Port Washington, N.Y. npd.com.
NPD. 2015b. “U.S. Consumers Are Eating Nearly as Much Fresh Food as 30 Years Ago.” Press release, July 21.
NRA. 2015. What’s Hot Chef Survey. National Restaurant Assoc., Washington, D.C. restaurant.org.
NRA. 2016. 2016 Restaurant Forecast.
NSGA. 2015. Sports Participation in the U.S. National Sporting Goods Assoc., Mount Prospect, Ill. nsga.org.
OTA. 2015. “Quick Stats.” Organic Trade Assoc. Washington, D.C. ota.com.
Packaged Facts. 2014a. Weight Management: U.S. Consumer Mindsets. Aug. Packaged Facts, Rockville, Md. packagedfacts.com.
Packaged Facts. 2014b. What America Eats. Nov.
Packaged Facts. 2014c. Bottled Water. April.
Packaged Facts. 2015a. Functional Foods: Key Trends by Product Categories and Benefits. Feb.
Packaged Facts. 2015b. U.S. Pet Market Outlook. April.
Packaged Facts. 2015c. Gluten-free Foods in the U.S.
Packaged Facts. 2015d. Non-GMO Foods. July.
Packaged Facts. 2015e. Nutritional and Cereal Bars in the U.S. Feb.
Packaged Facts. 2015f. Foodies in the U.S. May.
PAC. 2016. Overview Report from the Physical Activity Council. Physical Activity Council. physicalactivitycouncil.com.
PBHF. 2015. State of the Plate. Produce for Better Health Foundation, Hockessin, Del. pbhfoundation.org.
R&M. 2015. Phytosterol Market. London, UK Researchandmarkets.com.
SFA. 2015. The State of the Specialty Food Industry. Specialty Food Assoc., New York City. specialtyfood.com.
Sloan, A. E. 2015. TrendSense Predictive Model Report. Sloan Trends, Escondido, Calif. sloantrend.com.
TABS. 2015. The 2015 Sports Nutrition Category Insights. tabsgroup.com.
Technomic. 2014a. Healthy Eating Consumer Trend Report. Technomic, Chicago. technomic.com.
Technomic. 2014b. The Beverage Consumer Trend Report.
Technomic, 2014c. The Snacking Occasion Consumer Trend Report.
U.S. Census. 2010. U.S. Census Bureau, Washington, D.C. census.gov.
USDA. 2015. Dietary Guidelines. 2015–2020 Dietary Guidelines for Americans, 8th Edition. U.S. Dept. of Agriculture. health.gov.
Wyatt Lyons, S. 2015. “Snack Food State of the Industry” webinar. Aug. 26. IRI.
Zacks Investment Research. 2016. “Panera Bread Company Analyst Forecasts Earning Growth.” nasdaq.com/symbol/pnra/earnings-growth.


