Food Science Salaries in the Spotlight
Earnings have been slow to rebound postrecession, but demand is strong for professionals with solid skill sets. IFT’s exclusive new research delivers the latest information on wages, benefits, and how food scientists and technologists feel about their jobs.
Article Content

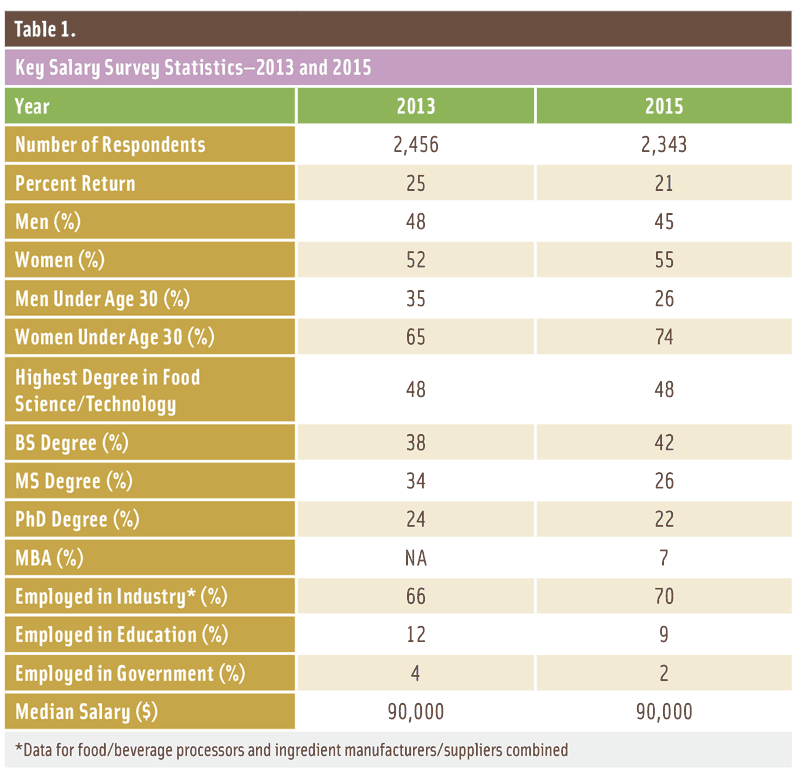
The median salary of $90,000 for food science professionals was flat in 2015—exactly the same median IFT’s biennial salary survey showed for members in the United States* two years ago. But that doesn’t mean that the outlook for food scientists isn’t positive. For the 72% of 2015 survey respondents who reported receiving a pay raise within the past 12 months, the median increase was 3.4%. And those working in the science of food enjoy their jobs: 84% of respondents in the 2015 IFT Employment and Salary Survey said they would definitely or probably choose the profession again.
Compensation expert Kerry Chou, senior practice leader in the Scottsdale, Ariz.–based office of WorldatWork, a nonprofit human resources association that surveys employers across a range of industries about planned and actual salary increases, says IFT’s survey findings align with what he sees in the market overall. “The compensation climate has been pretty tepid [since the recession of 2009],” says Chou. “We’ve really improved unemployment; it’s down to about 5%. Job openings are fairly high. So those are good news things. You would think that salaries would be increasing at a faster pace. [But] we’re not seeing that.”
Prerecession, annual salary increases averaged in the range of 3.5%–4%, but according to WorldatWork’s recent survey, the average pay raise in 2015 was 3%. “Companies continue to be cautious since the recession,” Chou observes. “Companies are keeping money under their mattresses so to speak.”
Like Chou, Laurie Hyllberg, vice-president with Kinsa Group, Franklin, Wis., a recruiting firm that specializes in the food and beverage industry, links the relatively flat compensation environment with a postrecession mindset among employers. “Salary figures were growing so rapidly in the late ’90s and early 2000s, that I think it caused a bit of a bust in 2009, and it’s been slower to recover in this last growth period than it has been in the past,” says Hyllberg. “I think that’s why the median hasn’t changed drastically.”
Chou also notes that IFT salary survey data showing a median raise of 3.4% in the past year isn’t inconsistent with data indicating that the overall median salary has not increased from two years ago. The pool of respondents varies each year as employees retire or change roles and new employees are hired. So comparing one survey with the next isn’t an apples-to-apples kind of process, he explains. (See Table 1 for a comparison of data highlights from the 2013 and 2015 surveys.)
--- PAGE BREAK ---
 The fact that the percentage of women who completed the survey—55%—was higher than in any prior year is another likely contributor to the overall flat salary figure because women’s reported median salary of $79,000 in 2015 was the same as in the 2013 survey although the median for men—$105,000—was up 2.9%. (See Table 2 for details on salaries, bonuses, and earnings from stocks in 2015.)
With a salary gap of this size between males and females, perhaps it’s not surprising that 45% of the women survey respondents said they did not think that their opportunities for advancement and compensation in the profession were equal to men’s. (See related story about women’s careers and compensation.)
A Robust Job Market
Despite the fact that salary growth has been anemic, recruiters say that the job market was robust in 2015, and they expect a continuation of that in 2016. In fact, for midcareer food scientists with strong résumés, it’s clearly a candidates’ market, several recruiters told Food Technology.
“This is a candidates’ market more than any time that I’ve seen in the past,” says Cathleen Allen, a recruiting contractor for Sparks, Md.–based McCormick & Co., who has worked in the recruiting profession for two decades.
Hyllberg agrees. “If you’re a top performer and you have skills in a particular product category or multiple product categories, you’re in demand and employers are seeking to attract you to their organization,” she says. “I would definitely say it’s candidate-driven right now.”
Moira McGrath, president of OPUS International, a food science–focused executive search firm based in Deerfield Beach, Fla., adds that she’s seeing opportunities across a broad cross section of the discipline. “It’s more across the board this year. Some years it was more food safety–driven. This year we’ve seen [job opportunities in] just about everything from regulatory to product development to quality assurance to food safety.”
According to McGrath, there’s a shortage of qualified candidates with about 10 to 15 years of experience who are well-positioned to ascend the corporate ladder into a managerial role. “What’s still missing is the young professional—that 30- to 40-year-old who is ready to move into a leadership position,” says McGrath, who attributes the gap to the fact that food science graduates were in relatively short supply a decade or so ago. Flavorists, flavor chemists, and food scientists with expertise related to the Food Safety Modernization Act are in particularly high demand, according to recruiters interviewed for this article.
--- PAGE BREAK ---
A Labor of Love
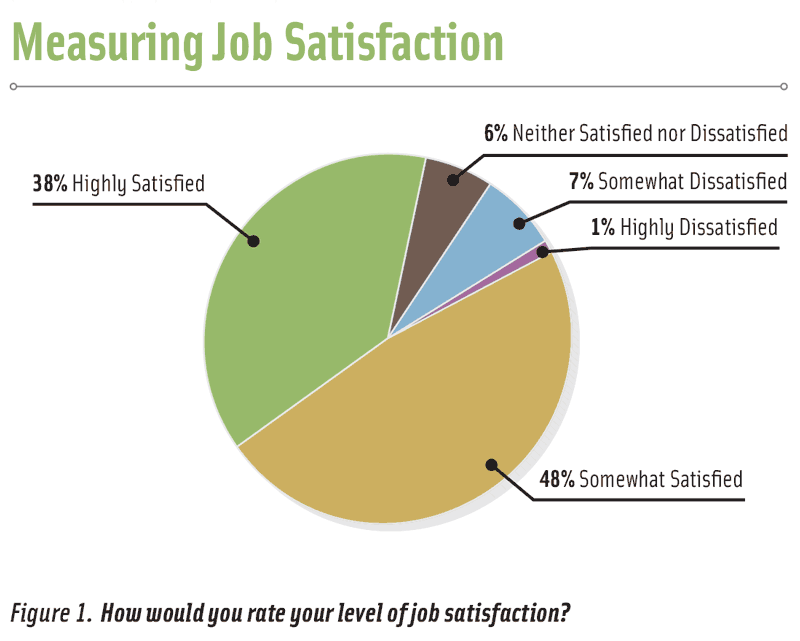
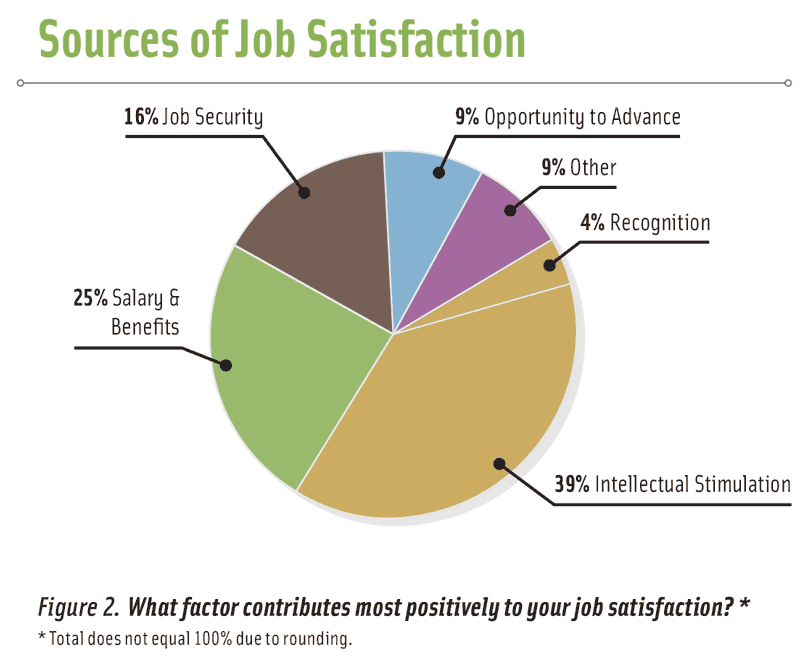
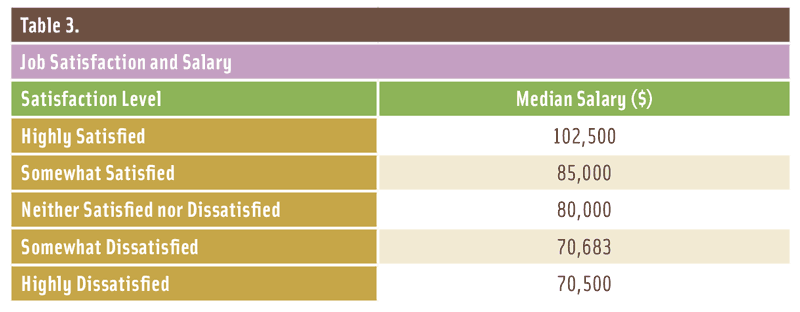
Those working in the science of food continue to have a positive perspective on their professional lives. Levels of job satisfaction identified in the 2015 survey were nearly identical to those reported two years earlier. The vast majority reported that they were either highly satisfied (38%) or somewhat satisfied (48%) with their jobs. As it did in 2013, intellectual stimulation led the list of factors that contribute to job satisfaction; it was cited by 39% of respondents in 2015, followed by salary and benefits, noted by 25%. (See Figures 1 and 2 for breakouts on job satisfaction and the factors responsible for it.) Not surprisingly, there is a strong correlation between salary and degree of satisfaction, with the median salary for highly satisfied employees coming in at $102,500 versus $70,500 for those who described themselves as highly dissatisfied. (See Table 3 for the rest of the details.)
Comments from survey respondents indicate that many find their professional lives to be meaningful. “I consider the field so vital to human existence,” said one respondent, adding that “it’s particularly satisfying to practice food science and technology, especially in a developing country, where there are a lot of postharvest challenges.” Other responses were more pragmatic but equally enthusiastic. “People will always need to eat, and as our population grows and market expectations change, companies will need food scientists to stay relevant and meaningful.” Many respondents said they enjoy the diverse challenges their jobs afford. “Food science is an ever-changing profession, and there are many areas to utilize various individual strengths,” said another. “With food science, there is always a challenge and improvement opportunity to keep one energized.”
This year’s survey asked participants if they would consider the field of food science and technology if they were currently preparing to enter the job market, and only 6% said they would not compared with 60% who definitely would consider it and 24% who probably would do so, leaving 10% who said they probably would not. Among those who said they would make a different career choice if given the opportunity to do so, many cited other scientific professions, including engineering, medicine, and pharmacy. Other frequently mentioned alternatives include sales, marketing, finance, and other areas of business.
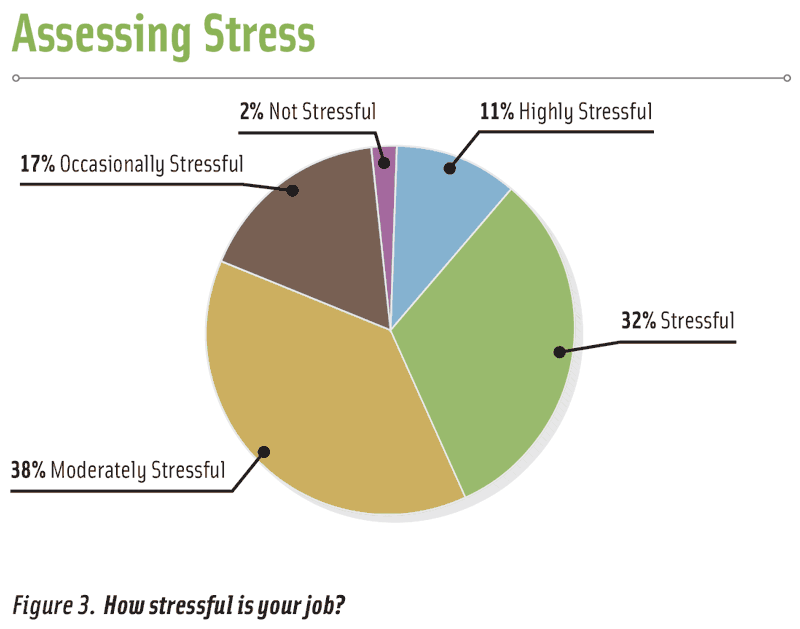
Every job has its stressors, of course, and the science of food is no exception. Nearly one-third (32%) of respondents described their jobs as stressful, and 38% rated them as moderately stressful. Only 11% labeled them as highly stressful. (See Figure 3 for a full breakout.) There is a generally positive correlation between stress and salaries. Those who rated their jobs as stressful had a median salary of $100,000 versus a median of $63,000 for those who said their jobs were not stressful.
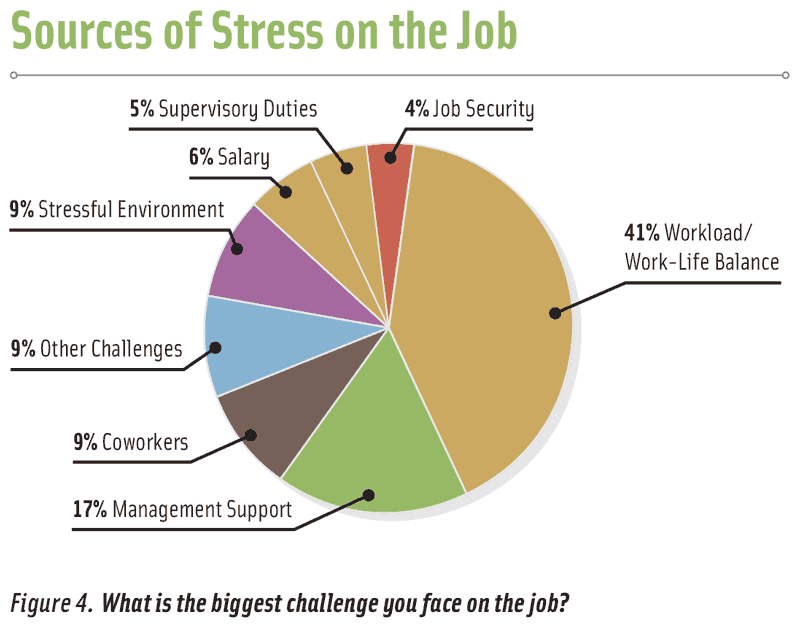
Participants in the survey ranked work-life balance as No. 1 on the list of job challenges; it was cited by 41% of respondents. Management support—or, probably more accurately, lack of support—came in second, noted by 17%. (Figure 4 provides more details on sources of stress.)
While it’s often said that Millennials demand more work-life balance than older employees, particularly work-obsessed Baby Boomers, 29-year-old Bridget McClatchey, a food scientist who works at the Kraft Heinz R&D center in Glenview, Ill., believes that Millennials face some different challenges. “I think the work-life balance for people of my generation and younger is even more difficult … because we have technology at our fingertips all the time,” says McClatchey. “If you have your email synced to your phone, if you’re always connected, then you feel like you can never disconnect or are never fully removed [from work].” To keep stress in check, she recommends finding a job at a company where the corporate culture matches up well with one’s personal priorities for work-life balance.
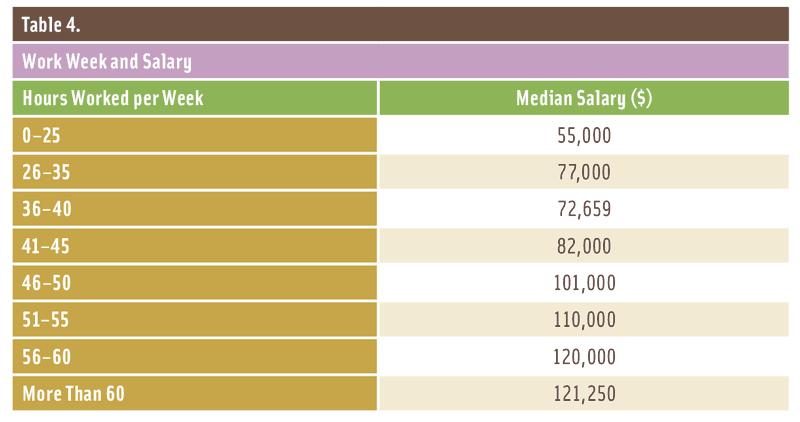
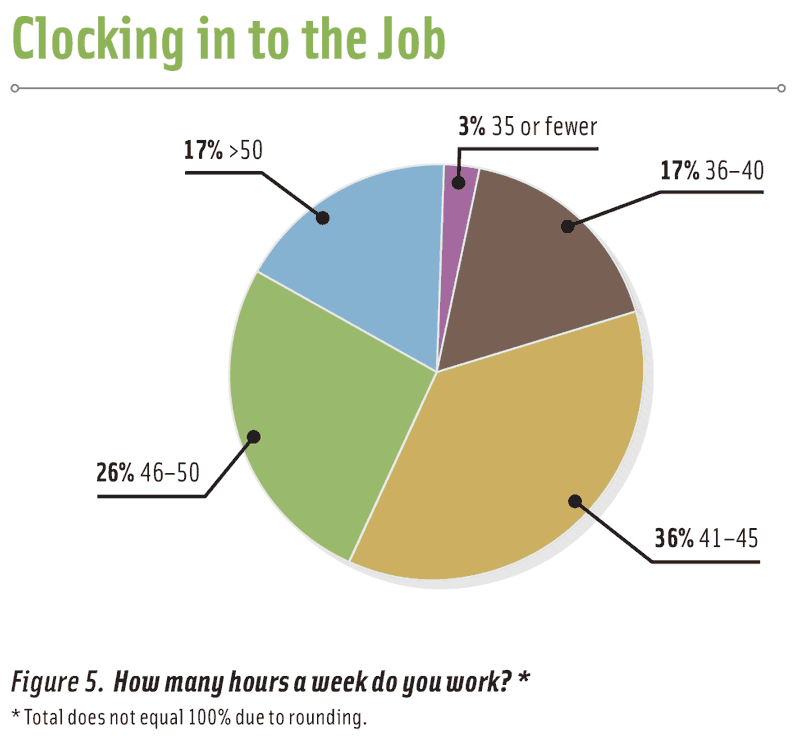
The median workweek for survey respondents is 45 hours; 17% of respondents said they worked more than 50 hours a week. (Figure 5 shows how the workweek breaks out for respondents, and Table 4 shows median salaries by hours worked.)
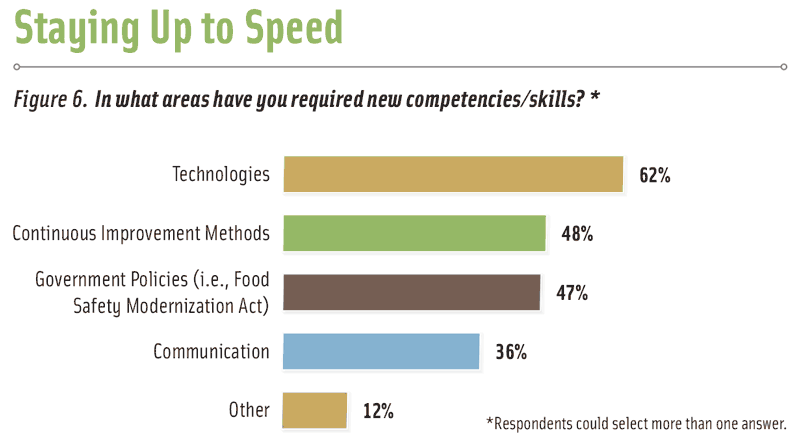
Almost three-quarters (73%) of respondents said that their jobs have demanded new competencies.
Asked about new skill requirements, survey respondents put those related to new technologies at the head of the list, followed by skills associated with continuous improvement methods, skills necessary because of new government policies (such as the Food Safety Modernization Act), and, finally, communication skills. (See Figure 6 for more details on how responses break out.) The new skills respondents specifically mentioned include everything from accounting, finance, and budget controls to culinary expertise. Leadership, management, and new product development knowledge were other competencies survey participants said they sought.
--- PAGE BREAK ---
A Healthy Benefits Package
Health-care coverage is the benefit that is most important to employees (SHRM 2015a), and IFT’s 2015 survey respondents said that their employers are delivering well on that front. For the majority of respondents, however, coverage costs more than it used to.
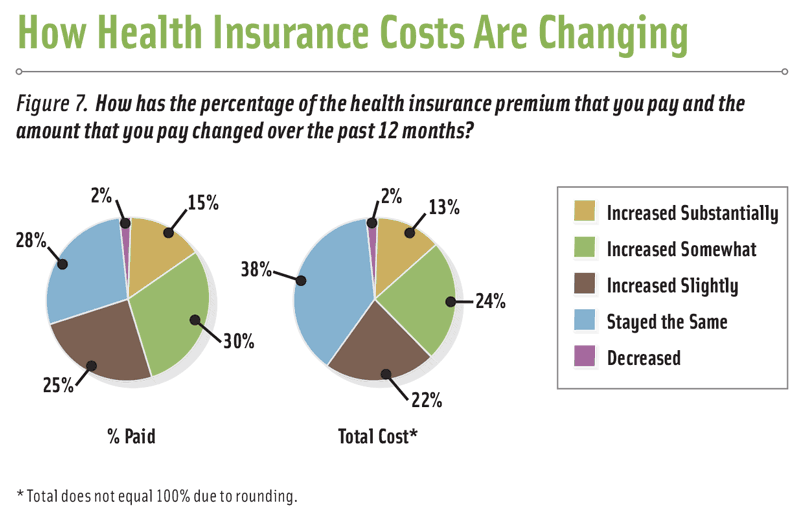
More than nine out of 10 survey respondents (93%) report that their employers provide health insurance—the same percentage as in the 2013 survey. On average, employers cover 68% of the cost of an employee’s health insurance premium, and the employee pays the remaining 32%, which amounts to $2,340 annually.
Seventy percent of survey respondents reported paying a greater percentage of their health insurance premiums, and 59% said the total cost of insurance had increased. (See Figure 7 for more specifics.)
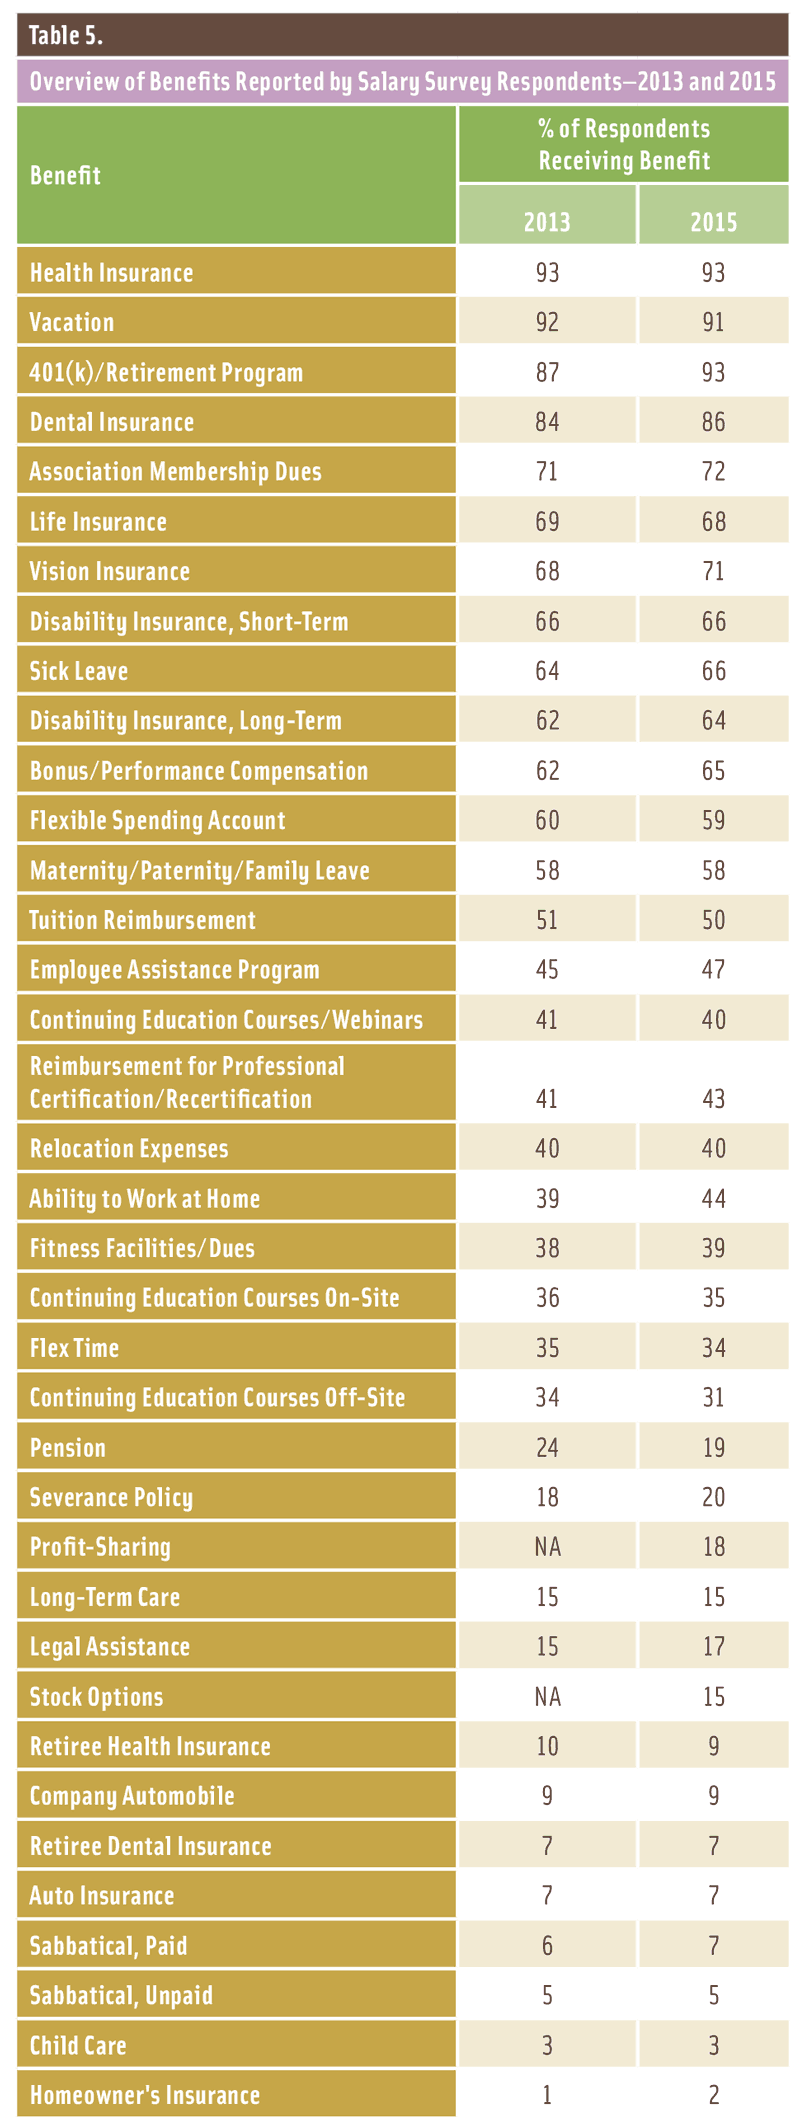
Other benefits survey respondents commonly receive are vacation time, cited by 91%, and dental insurance, noted by 86%—percentages similar to those reported in the 2013 survey. Benefits that are more common since 2013 include the ability to work at home, sick leave, vision insurance, and long-term disability programs.
Flexible work arrangements are important to employees of all ages, according to recruiters. Such flexibility is becoming an expectation for many, especially for those in the Millennial generation for whom staying connected via technology has been the norm for much of their lives. But older employees also value flexible work schedules; flexibility can be especially critical for members of the “sandwich generation,” who face the dual demands of caring for aging parents while staying actively involved in their children’s lives.
Slightly less than one-fifth (19%) of survey participants reported receiving a pension in 2015, down from nearly a third (32%) who had a pension just four years earlier in 2011. Retirement programs such as 401(k)s are increasingly common; 93% of 2015 survey respondents said they had a 401(k) program. (See Table 5 for more details on benefits.)
Getting to Know the Survey Respondents
IFT’s 2015 survey paints a richly detailed picture of the profession. Here’s a look at some additional data highlights.
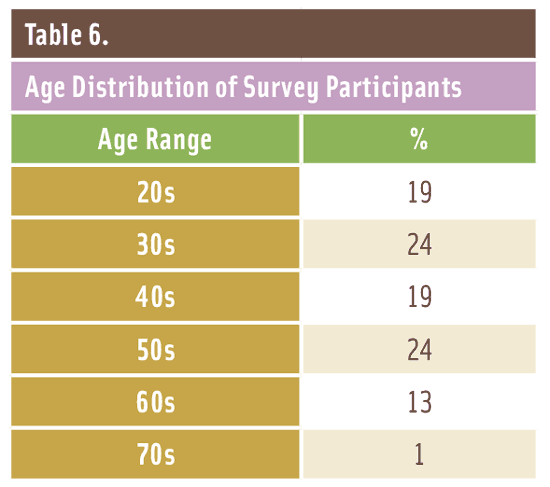
• Survey participants range in age from their 20s to their 70s, with the majority between ages 30 and 59. (See Table 6 for a detailed look at age distribution.)
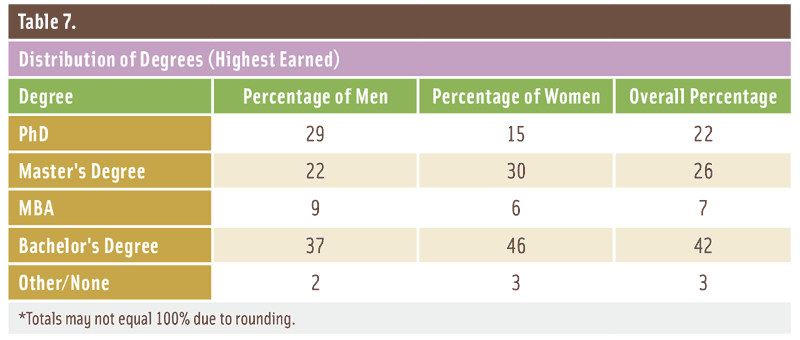
• More than one-fifth (22%) of survey respondents have a doctorate; 26% have a master’s degree; 7%, an MBA; and 42%, a bachelor’s degree as their highest degree. (Table 7 shows the distribution of degrees earned for men, women, and both sexes combined.)
• The median salary for survey respondents whose highest degree is a bachelor’s degree is $78,800; for those with a master’s degree, it is $88,000; for a doctorate, $110,000. Those respondents with an MBA earn the most—$120,000.
• The median starting salary in 2015 was $50,000, the same as in the 2013 survey, and there was less of a gap between men’s and women’s starting salaries in 2015. Starting salaries for men were $52,000 in 2015, down 5.5% from $55,000 in 2013, while women’s median starting salary of $50,000 matched their 2013 median.
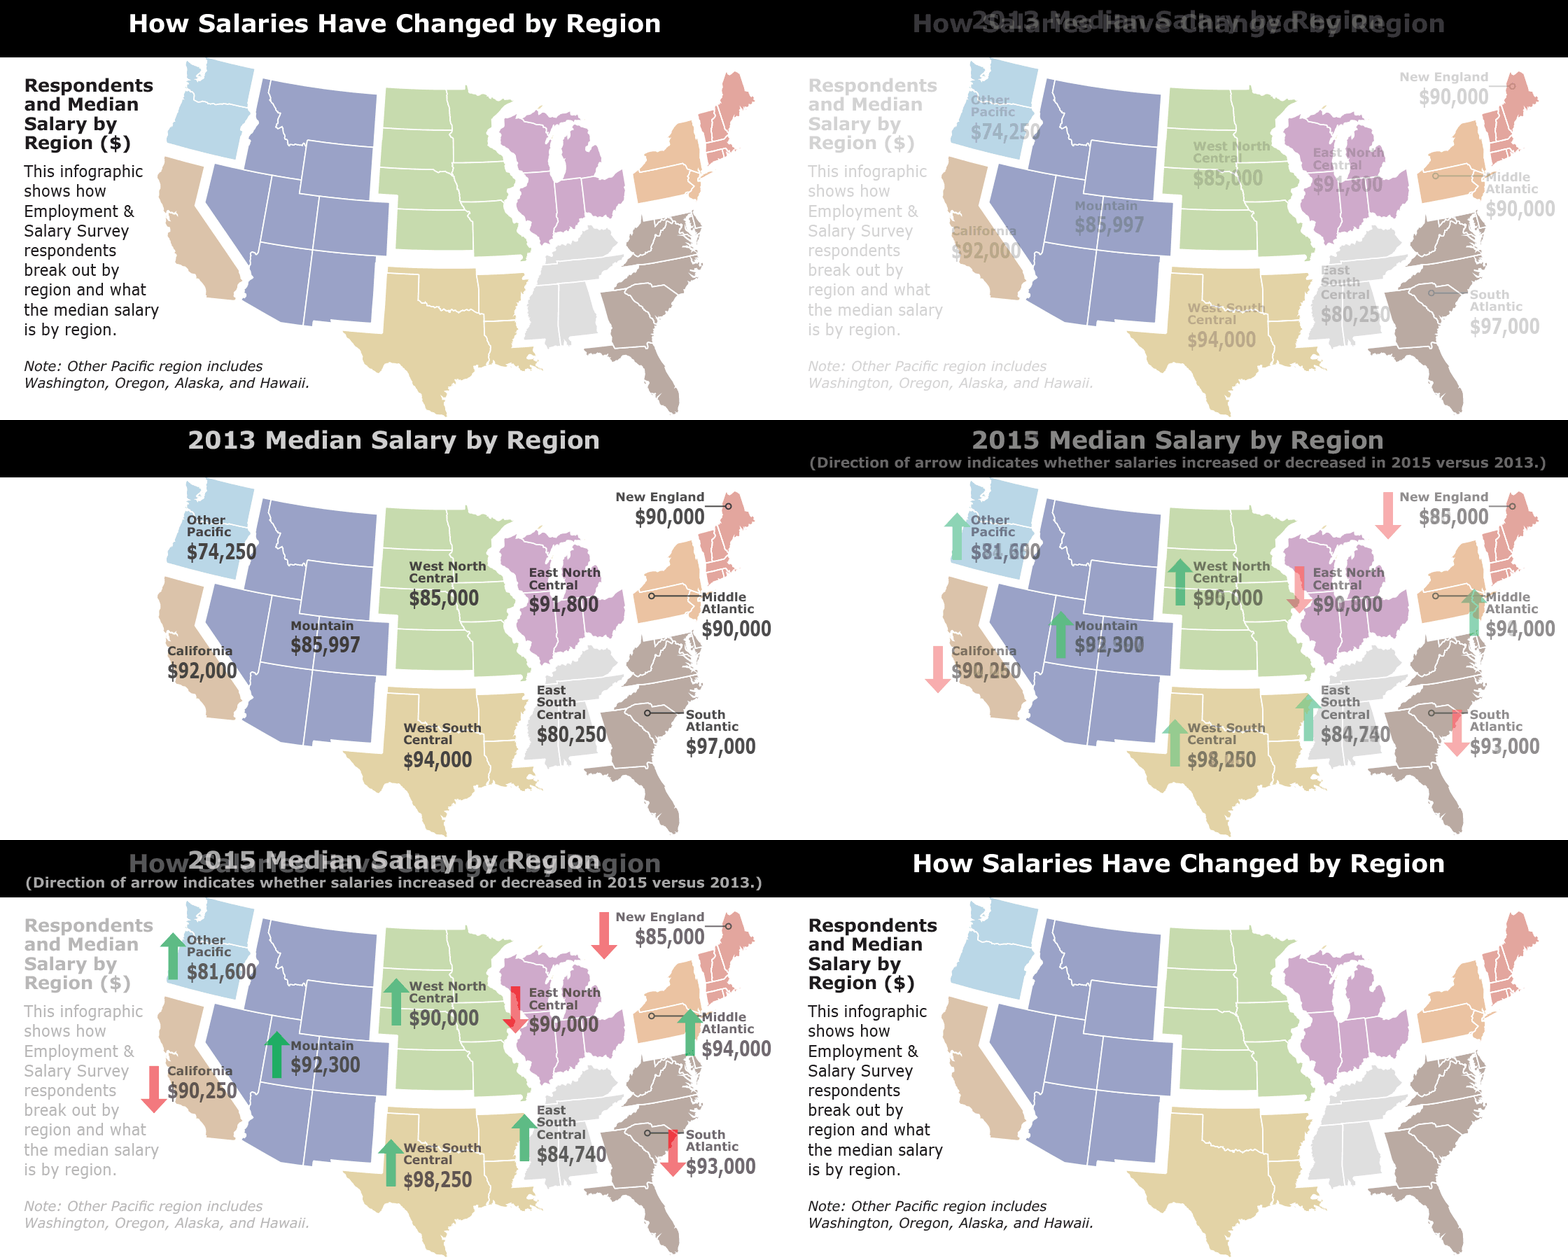
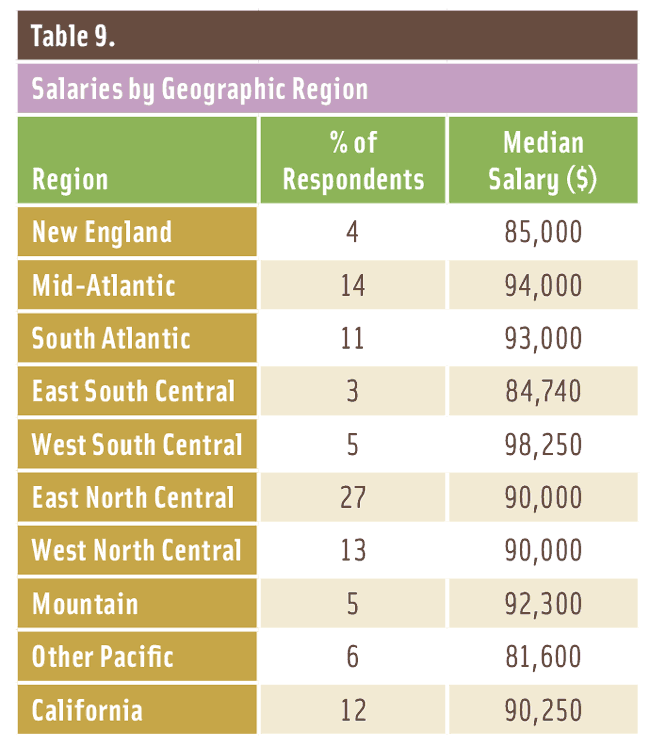
• Geographic location affects salary levels. Respondents in the West South Central region reported the highest median salaries, followed by the Mid-Atlantic, South Atlantic, and Mountain regions. Those in the other Pacific region excluding California, East South Central region, and New England did not fare as well in terms of salaries. (See Table 9 for a complete look at salaries by geographic region as well as the percentage breakout of respondents by region.)
• The largest number of survey respondents (46%) work for food and beverage manufacturers/processors, followed by food ingredient manufacturers/suppliers, 25%; academic/educational institutions, 9%; consulting, 5%; and government, 2%.
• Nearly a third of respondents (31%) work for organizations with 5,000 or more employees; 29% work for organizations with 500–4,999 employees; 22% with organizations that employ 100–499; and 18% for employers with fewer than 100 people on staff.
--- PAGE BREAK ---
Perspectives on Pay
So just how important is salary anyway? Certainly the figure on one’s paycheck matters for all kinds of practical and psychological reasons, but it’s not necessarily an employee’s top priority. Compensation was No. 4 on a list of job satisfaction factors, behind respectful treatment of employees, trust between employees and senior management, and overall benefits, according to a recent study by the Society for Human Resource Management (SHRM 2015b).
Compensation expert Chou says the importance of salary to an employee tends to be strongly correlated with that employee’s marketability. “Your average worker, if we were to ask them: ‘How important is pay for you to stay at this company?’ Pay is usually up there, but it might not be at the top of the list,” says Chou. “What might be No. 1 is your relationship with your manager.”
But, Chou continues, salary will very likely be far more important to an organization’s top performers. “Pay is important to just about everybody,” he says, “but it’s particularly important to the highest performers. They’re marketable. They’re getting calls all the time. … They have much more bargaining power.”
Chou says that WorldatWork research shows that more than 90% of companies have a “pay for performance” program, which means that salary increases are based on merit, with the highest increases going to the highest performers. In 2015, according to research from employee benefits and compensation consulting firm Mercer, base pay increases for the highest performers averaged 4.8% versus 2.7% for those who performed at an average level and 0.2% for the lowest performers (Mercer 2015).
*Note: Unless otherwise specified in this article, statistics cited apply to United States–based members of the Institute of Food Technologists.
Survey Methodology
The 2015 IFT Employment and Salary Survey, conducted this past September, drew a 21% response rate among U.S. members, 2,343 of whom responded to the survey. Survey emails were managed by a private consulting firm, which kept all responses confidential. The 2015 survey, like the one conducted in 2013, included some nonmembers in the United States as well as international participants (both members and nonmembers). A total of 3,328 individuals took the survey. Unless otherwise specified, the findings highlighted in this article apply to members based in the United States.
Learning More About Earnings
IFT’s 2015 Employment and Salary Survey research yielded a wealth of facts and figures, and only select highlights appear in this article. To delve more deeply into the data, check out the 2015 IFT Employment and Salary Survey Report. It is available free of charge to IFT members and to nonmembers for $99.
The Benefits of Bonuses
It used to be that only an organization’s most senior executives reaped the benefit of added income from bonuses awarded to recognize performance. Times have changed over the past two or three decades, however, and employees at all levels on the organizational chart now often are eligible for bonuses. In IFT’s 2015 salary survey, 65% of respondents reported receiving a bonus.
“While base pay increases have been increasing but at a relatively slow level, bonuses and incentives remain very popular,” says Kerry Chou, senior practice leader based in the Scottsdale, Ariz., office of WorldatWork. “One of the key reasons they remain so popular [is that] you give someone a bonus, and it’s a onetime event. It’s not baked into the pie. It doesn’t go into their base pay. Next year, the company sets new objectives, and the employee has to re-earn the bonus.”
Thus, bonuses are considered strong motivational tools for employees, and they have the added advantage of allowing companies to tie compensation spending to organizational performance. If earnings aren’t strong for a given year, for example, a company can simply rein in spending on employee bonuses. Then if things pick up in the following year or the year after that, bonuses can be reinstated, creating what employers are likely to view as a win-win situation.
Employers and IFT
Data from the 2015 IFT salary survey show that employers are supportive of membership in IFT; 89% cover the cost of IFT membership dues. A substantial majority (70%) pay for travel expenses associated with attending the IFT annual event, and two-thirds (66%) provide time off to attend it. More than one-third (36%) pay for employees to attend IFT section meetings, and about the same number (35%) provide time off to attend the meetings.
A Look at Wages Around the World
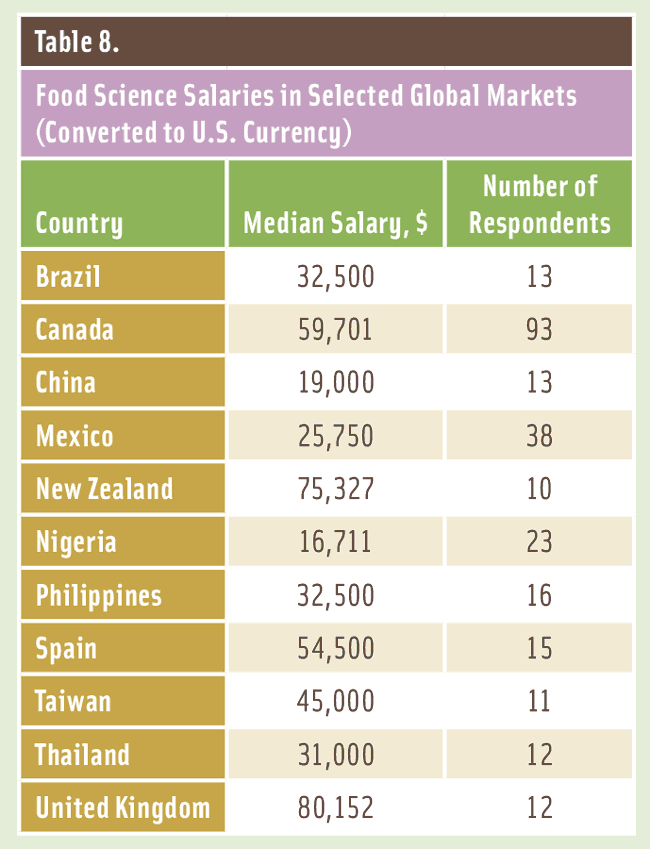
In 2015, for only the second time in its history, the IFT Employment and Salary Survey invited responses from food science professionals (members and nonmembers) from outside the United States. The response rates were not high enough to be statistically significant in many countries, but median salaries for countries in which the response rate was 10 or more can be found in Table 8. Currency exchange rates that prevailed at the time of the survey were used to convert salary data to U.S. dollars.
Mary Ellen Kuhn is executive editor of Food Technology magazine ([email protected]).
References
Catalyst. 2015. “Women’s Earnings and Income.” http://www.catalyst.org/search/node/Women%27s%20Earning%20and%20Income.
Mercer. 2015. “U.S. Salary Increase Budgets Remain Flat Despite Upswing in the Economy and Job Market, Mercer Survey Finds.” Press release, Nov. 12. Mercer, New York City. mercer.com
SHRM. 2015a. “Benefits Take on New Importance in Recruiting and Retaining Employees, SHRM Survey Finds.” Press release, Oct. 15. Society for Human Resource Management, Alexandria, Va. shrm.org.
SHRM. 2015b. Job Satisfaction and Engagement Report.
WorldatWork. 2015. “Base Pay for U.S. Employees to Make Modest Gains in 2016.” Press release, Aug. 4. WorldatWork, Washington, D.C. worldatwork.org.
