
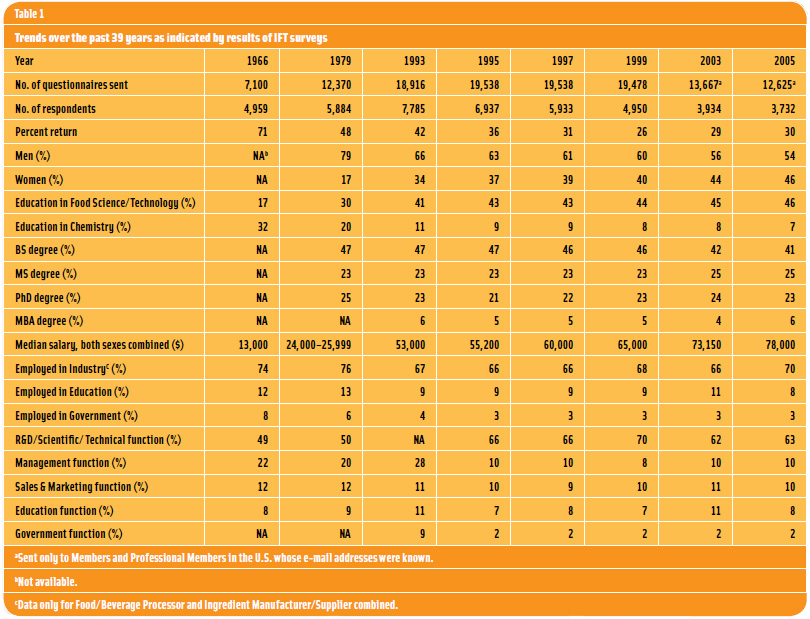
2005 IFT Membership & Employment Salary Survey
Over the past two years, median salaries rose 6.6% to $78,000, and female membership increased to 46% of the total membership.

[DUE TO THE AMOUNT OF GRAPHICS IN THIS ARTICLE, IT IS ADVISED THAT YOU DOWNLOAD THE PDF VERSION FOR BETTER READABILITY]
Members of the Institute of Food Technologists earned a median salary of $78,000 in late 2005, a 6.6% increase from the $73,150 in late 2003, according to the results of a recent IFT Membership Employment & Salary Survey.
IFT—a nonprofit professional scientifc society whose 22,000 members worldwide are active in all aspects of the food field, including industry, government, and academia —surveyed its members in the United States in 1966 and 1979, then every two years since 1993, with the exception of 2001 when it conducted a starting salary survey only.
The results of each survey were provided to IFT members via publication in Food Technology. In addition, IFT has received numerous requests for survey results from nonmembers and from Human Resource personnel in food companies.
The surveys prior to 2001 were conducted by mail, but the subsequent surveys were conducted via the Internet. For the current survey, an e-mail invitation to participate was sent in October–November 2005 to the 12,625 IFT Members and Professional Members in the U.S. for whom we had valid e-mail addresses. The e-mail message provided instructions on how to access a 32-question survey on the Internet. The results were kept completely anonymous and confidential, and all returns were tabulated by Data Lab Corp., Niles, Ill. By the cutoff date, 3,732 responses had been received, for a 29.6% return.
This article summarizes the results in three sections— membership demographics, employment data, and median salary data for full-time employees. Illustrations are not drawn to scale, and percentages may add up to more or less than 100% because of rounding.
Demographics
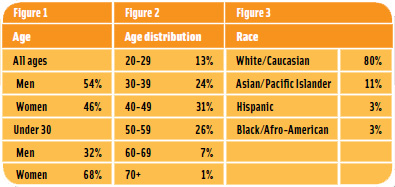
- Among the respondents, there are slightly more men than women, but respondents under age 30 are predominantly women (Figure 1).
- Two-thirds of the respondents are under age 50 (Figure 2).
- Respondents are predominantly white (Figure 3).
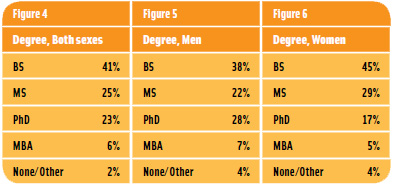
- More than half of the respondents—and more of the men than the women—have advanced degrees (Figures 4, 5, and 6).
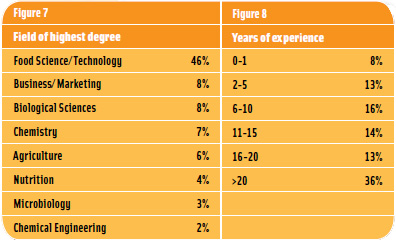
- Nearly half of the respondents have their highest degree in Food Science and Technology (Figure 7).
Employment
- More than one-third of the respondents have had less than 11 years of professional food-related work experience, and more than one-third have had more than 20 years (Figure 8).
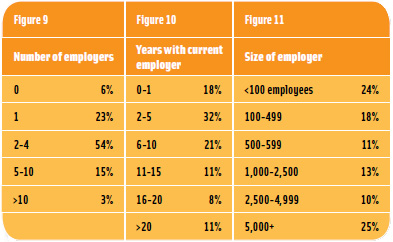
- Three-fourths of the respondents have worked for more than one employer, and more than half have had 2–4 employers (Figure 9).
- Half of the respondents have worked for their current employer for less than 6 years (Figure 10).
- Half of the respondents work for companies with more than 1,000 employees; one-fourth for companies with more than 5,000 employees (Figure 11).
- The great majority of the respondents (93%) are employed full-time. Of the 30 who reported being unemployed (2%), 27% have been out of work for more than one year, and 70% are seeking full-time employment.
--- PAGE BREAK ---
- Most respondents work in the R&D/Scientific/Technical category (63%), followed in order by Management (10%), Sales/Marketing (10%), Education (8%), Consulting (3%), Government (2%), Purchasing (1%), and Other (1%).
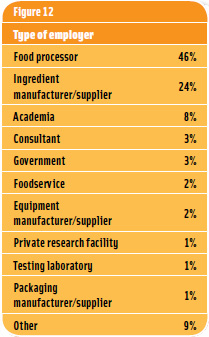
- Almost three-fourths of the respondents (70%) work for food and beverage companies and ingredient suppliers; the next largest percentage (8%) work in academia (Figure 12).
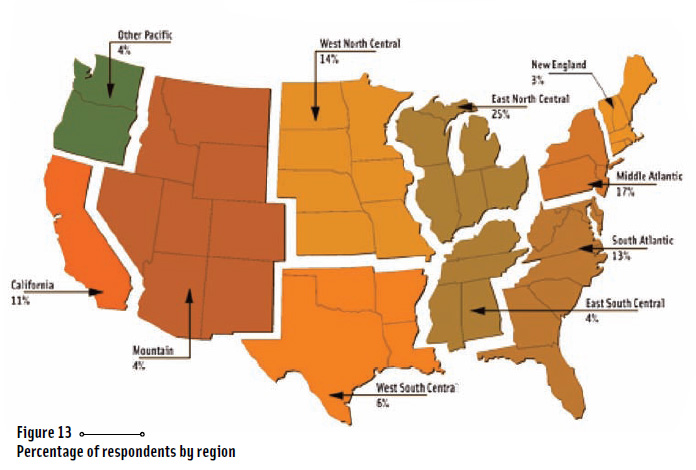
- The majority of respondents are in the Eastern half of the United States (Figure 13). Nearly one-third work in the East Coast states. Of the U.S. Census Bureau’s geographic divisions of the U.S., the East North Central region (Wisconsin, Illinois, Indiana, Michigan, and Ohio) has the highest percentage of respondents (25%).
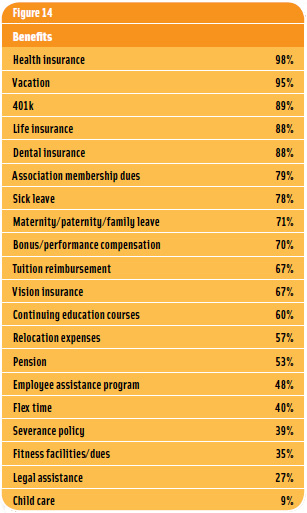
- Most employers provide the basic benefits (Figure 14).
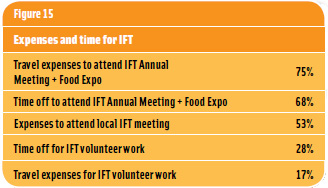
- Most employers give their employees travel expenses and time to attend the IFT Annual Meeting + Food Expo®, and a little over half of employers pay expenses for attending IFT Regional Section meetings; but less than 30% give their employees time and expenses for doing IFT volunteer work (Figure 15).
Salaries
Full-time salaries below $10,000 and salaries of $300,000 or more for persons with less than 6 years of professional food-related experience were eliminated from the tabulations, since they appear to be unrealistic. The data are presented in terms of the median salary, meaning that half of the respondents make more than that amount and half make less.
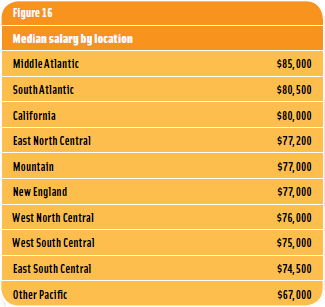
- The Middle Atlantic and South Atlantic regions had the highest median salaries (Figure 16).
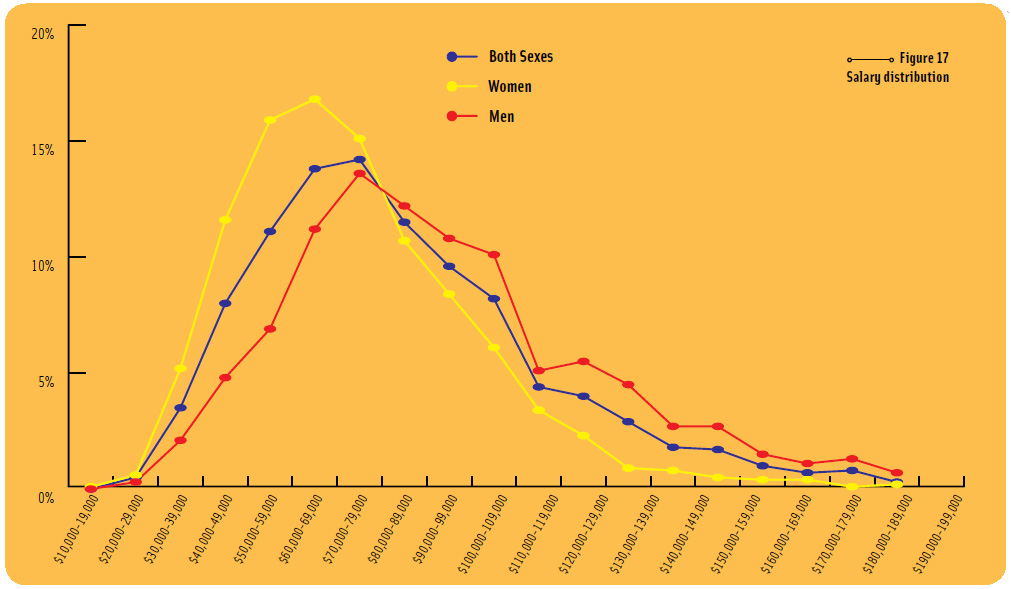
- Salaries for both sexes combined ranged from $11,400 to $750,000, but 99% were below $225,000 (Figure 17). The median salary for both sexes combined was $78,000, a 6.6% increase from the $73,150 in 2003.
- Salaries for men ranged from $25,000 to $750,000, but 99% were below $250,000; the median salary for men was $88,000, an increase of 6.0% from the $83,000 in 2003.
- Salaries for women ranged from $19,550 to $300,000, but 99% were below $175,000; the median salary for women was $69,500, an increase of 7.8% from the $64,500 in 2003.
- Part of the difference in median salaries for men and for women may be due to the fact that men have been working in the food field longer than women and therefore tend to have higher salaries. Nevertheless, men appear to receive higher salaries for the same degrees and years of experience.
--- PAGE BREAK ---
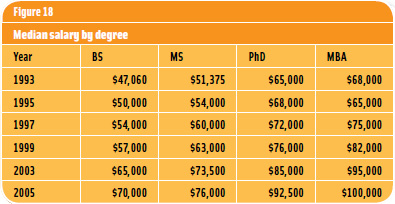
- Median salaries continued to increase for all degree levels (Figure 18).
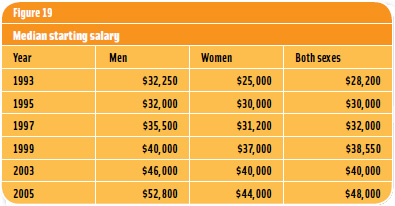
- Starting salary—considered here as the median salary for those with one year or less of professional food-related work experience since receiving the BS degree— continued to increase for both men and women (Figure 19), but men still receive a higher median starting salary than women.
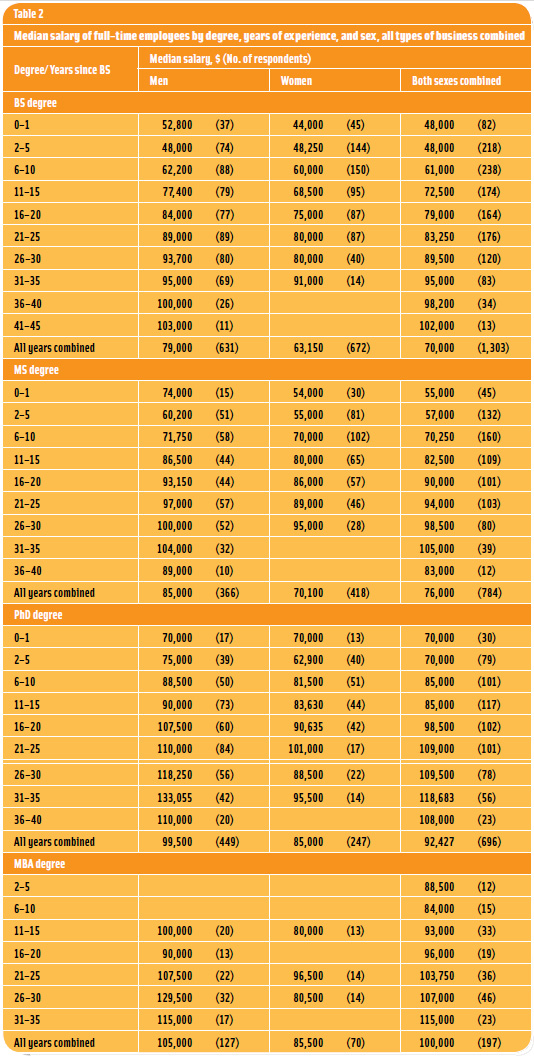
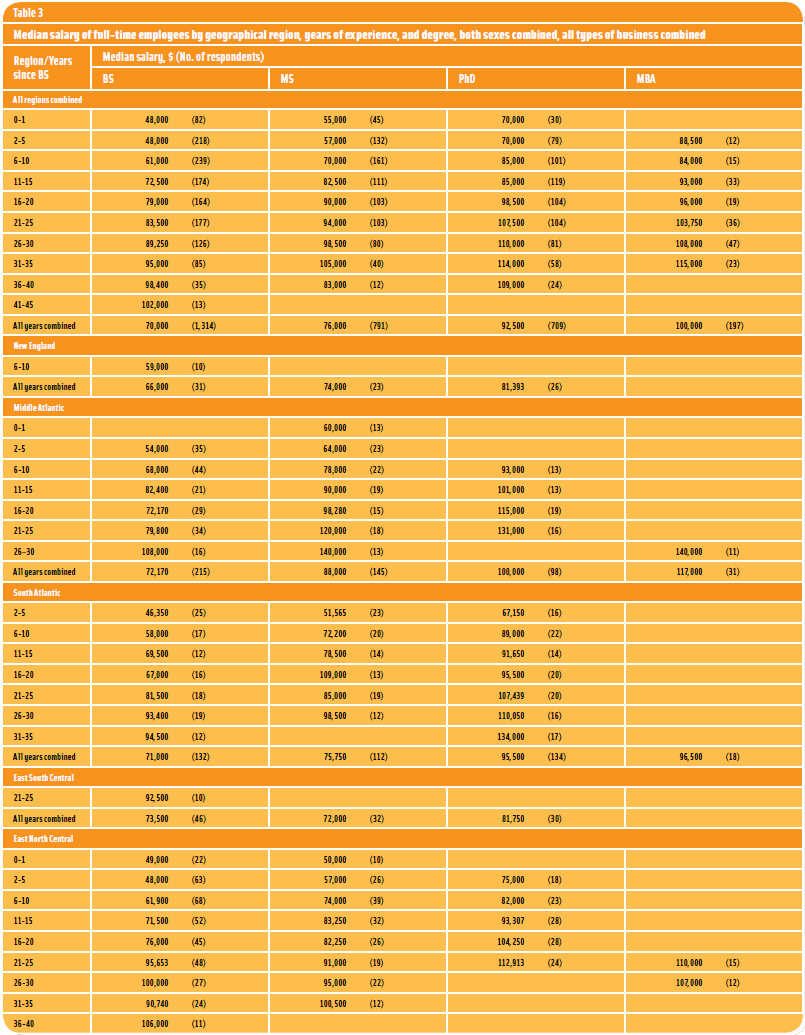
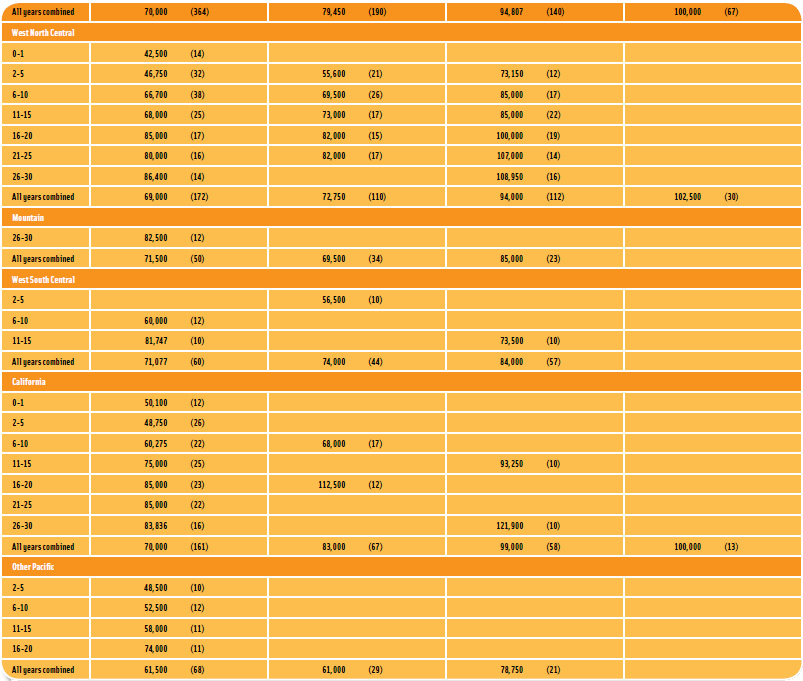
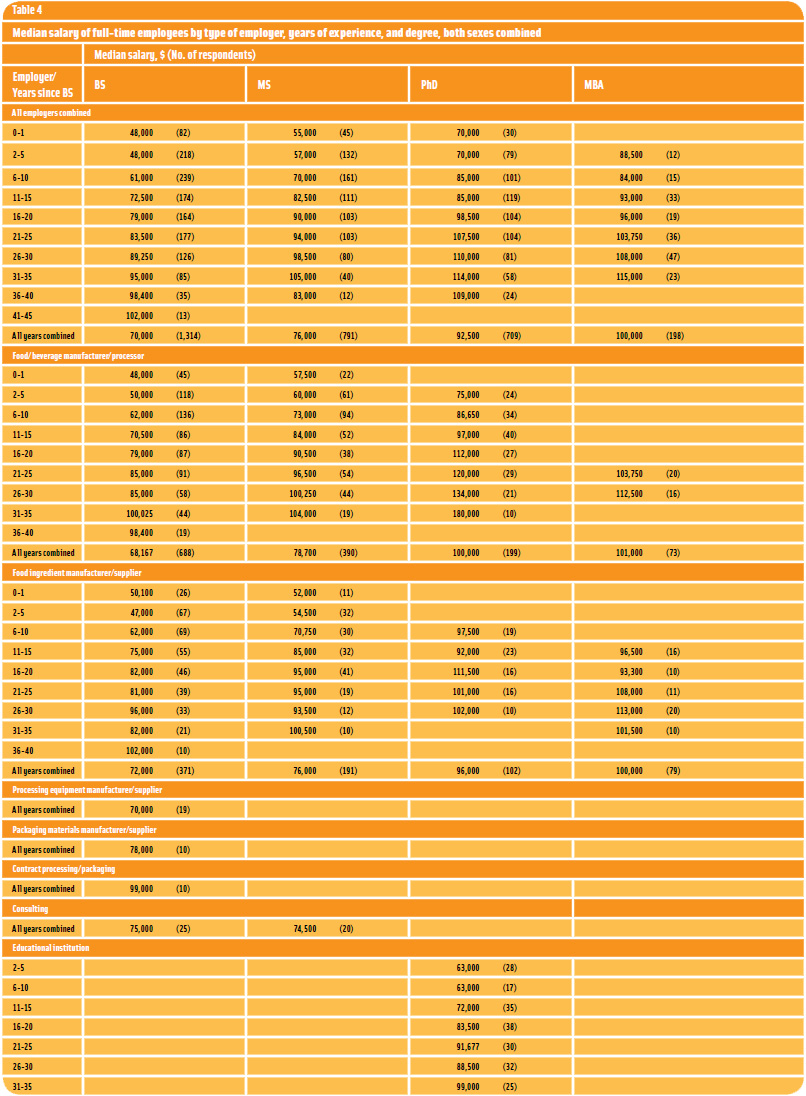
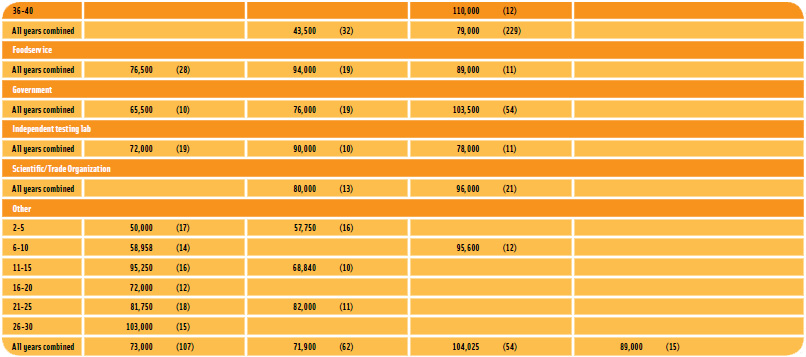
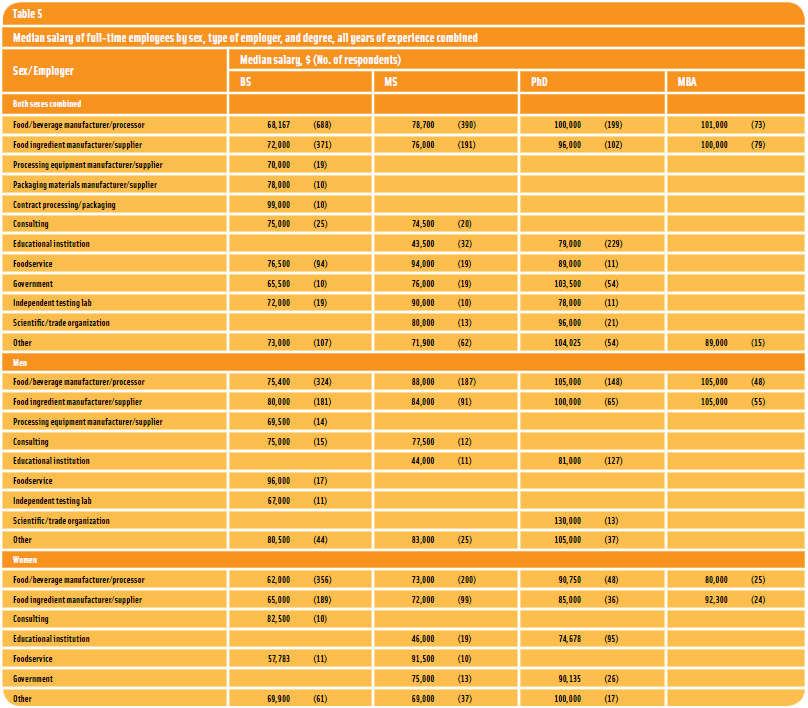
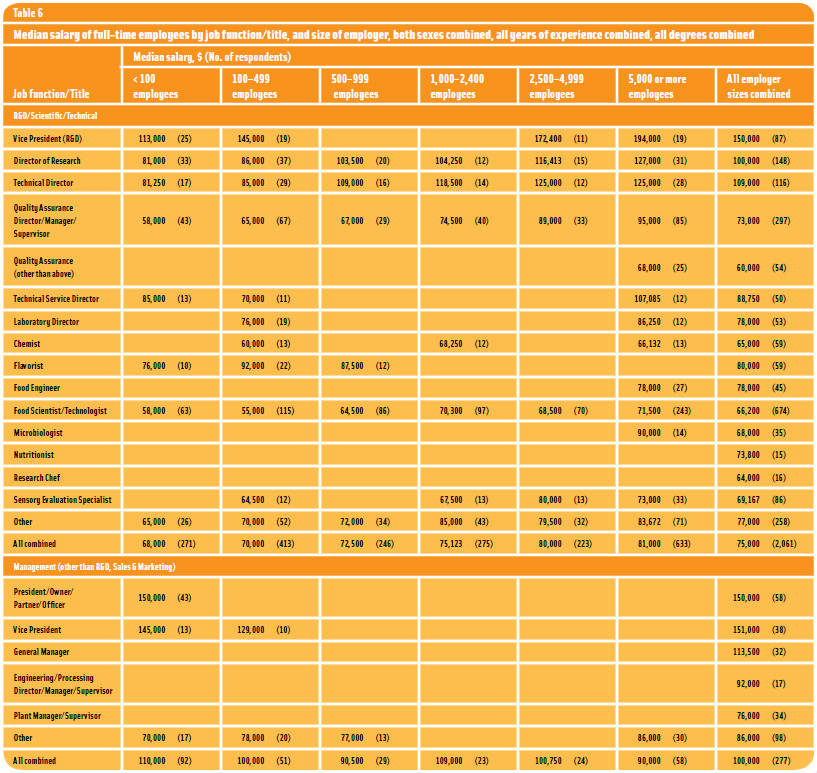
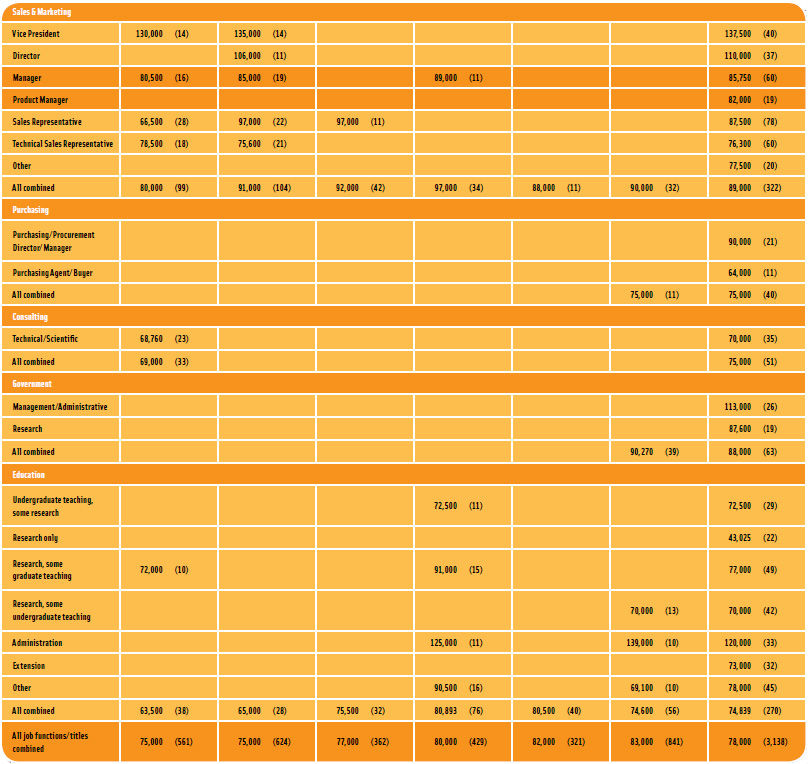
- Median salary data for fulltime employees are presented in Tables 2–6 on pages 29–35; data for fewer than 10 respondents are not reported. Table 2 shows the median salary by degree, years of experience, and sex; Table 3 by geographical region, degree, and years of experience; Table 4 by type of employer, years of experience, and degree; Table 5 by sex, type of employer, and degree; and Table 6 by job function/title and size of employer.
--- PAGE BREAK ---
About the Author
