
2009 IFT Membership Employment & Salary Survey
Despite the recessionary climate, the median salary for food scientists polled by IFT increased by 4.4% over the past two years.
[DUE TO THE AMOUNT OF GRAPHICS IN THIS ARTICLE, IT IS ADVISED THAT YOU DOWNLOAD THE PDF VERSION FOR BETTER READABILITY]
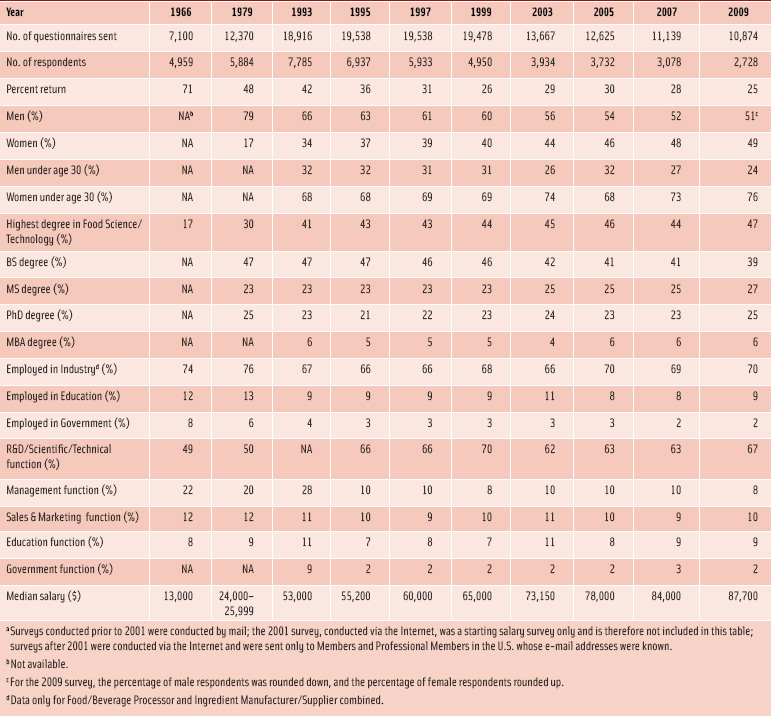
The median salary for members of the Institute of Food Technologists in the United States climbed a relatively modest 4.4% to $87,700 over the past two years, according to the results of the 2009 IFT Membership Employment & Salary Survey conducted this past fall. In the 2007 survey, the median salary of $84,000 represented a 7.7% increase from 2005’s $78,000—a figure that was up 6.6% from the 2003 median of $73,150.

That the salary increase for the past two years was lower than in the past comes as no surprise to those who keep close tabs on the employment scene. It seems likely that the economic downturn triggered by the stock market freefall late in 2008 had an effect on the job market last year.
“There was a much more conservative approach to filling positions in the past 12 months than I’ve seen in my 16 years in the business,” observed recruiter and Professional Member Moira McGrath.
“In this economy, companies are not ‘buying’ candidates,” said McGrath, President of OPUS International Inc., a Deerfield Beach, Fla.-based recruiting firm that specializes in food science professionals. “They are trying to fill positions with the best quality candidates, and they’re willing to wait for the best candidate to come along.
 “We’re finding that jobs are staying open longer and that candidates who are getting the job offers are those who are ‘perfect’—who can bring the perfect technical skills the employer seeks,” she continued. “Candidates who are looking or that 7.7% increase are not going to get the job.”
 “Companies were holding their breath as long as possible,” when it came to filling positions last year, agreed recruiter Maureen Knowlson, a partner in M.K. and Associates, a Butler, Pa.–based food industry recruitment company. “I think they were all watching the news too much.”
Both Knowlson and McGrath pointed out that in last year’s environment, it wasn’t unusual for companies to wait up to a year to fill positions as they sought candidates with skill sets that very closely matched job openings.
The precipitous drop in home values that accompanied the recession has had a major impact on both employers and job seekers over the past year or so, the recruiters noted. “The relocation issue is a big, big problem,” said McGrath, noting that home ownership can make it tough for a prospective employee to make a career transition—even when presented with an attractive job offer. “If they take a $30,000 or $40,000 loss on their home, who pays for that?” she mused.
“There’s a whole group of people who would move and would take new jobs if the real estate market was back to normal where they could reasonably sell their house,” agreed Knowlson.
John Floros, Professor and Head of the Dept. of Food Science at the Pennsylvania State University, said that he noticed the impact of the economic slowdown on recruitment of the 2009 graduating class, but that the situation proved to be temporary.
“Most years, we’ve placed a very significant number of our students before they graduate. They have already signed on the dotted line before May graduation,” he observed.
--- PAGE BREAK ---
 In 2009, however, the pace of placement for graduating seniors was “not as brisk as in the past,” he said. But, nonetheless, by September, all of Penn State’s 2009 food science graduates had been placed, Floros noted. Additionally, at Penn State, all December 2009 graduates had been placed by early January 2010.
 Despite the sluggishness of the job market in 2009, the recruiters forecast continued strong demand for food scientists. “Overall, the industry is very stable,” said McGrath. “We’re so lucky to be in a field where there is an understanding that t’s an absolute necessity for food to be safe and to taste good in order to sell it.”
For a detailed data breakout on salaries in 2009, see the final section of this article that begins on page 35 under the subhead “Salary Statistics,” but first, here’s some background information on this survey and how it was conducted.
History and Methodology
The Membership Employment & Salary Survey has a long history at IFT. The organization surveyed its members in the U.S. in 1966 and 1979, then every two years since 1993, with the exception of 2001 when it conducted a starting salary survey only. The surveys have served as a valuable resource for members, as well as for nonmembers and Human Resources personnel in food companies.
The surveys were conducted by mail prior to 2001 and via the Internet since then. For the current survey, an e-mail invitation to participate was sent in October 2009 to the 10,874 IFT Members and Professional Members in the U.S. for whom valid e-mail addresses were available. The e-mail message provided instructions on how to access a 33-question survey on the Internet. The results were kept completely anonymous and confidential, and all returns were tabulated by Data Lab Corp, Niles, Ill. By the cutoff date, 2,728 responses had been received, for a 25% return.
 When reviewing this report, readers should note that illustrations are not drawn to scale, and percentages may add up to more or less than 100% because of rounding.
--- PAGE BREAK ---
Detailing the Demographics
Data summarized in Table 1 puts the survey findings in historical context and provides a snapshot of the demographics of IFT membership. It should be noted that the number of survey questionnaires disseminated has been declining since 1999. This is due partially to a decline in membership and also to the fact that earlier surveys were sent to all Members and Professional Members in the U.S. by mail but the subsequent surveys were sent only to those whose e-mail addresses were known. Here’s a look at some of the demographic highlights the 2009 survey revealed.
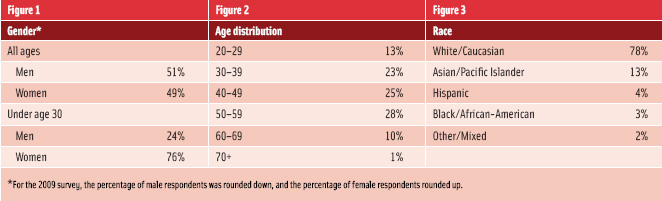 • Response to the survey was split almost equally between men (51%) and women (49%), with the percentage of male respondents rounded down, and the percentage of female respondents rounded up. More than three-fourths of the respondents under the age of 30 are women (Figure 1).
• Just over 60% of the respondents are under age 50 (Figure 2).
• More than three-fourths of the respondents are White/Caucasian, followed next by Asian/Pacific Islanders (Figure 3).
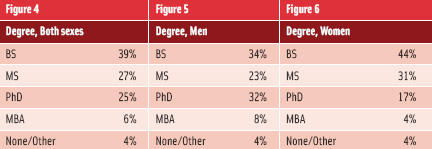 • More than half (58%) of the respondents—and a higher percentage of men (63%) than women (52%) have advanced degrees (Figures 4–6).
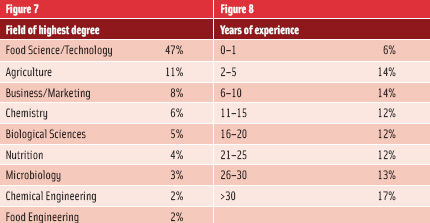 • Nearly half (47%) of the respondents obtained their highest degree in Food Science/Technology, with the next highest area being Agriculture (Figure 7). The fact that 39% of respondents obtained their BS degree in Food Science/Technology indicates that some respondents switched their major to Food Science/Technology for their higher degrees.
 Employment Highlights
• Approximately one-third (34%) of the respondents have had 10 or fewer years of professional food-related work experience since receiving their BS degree, and well over one-third (42%) have had more than 20 years of experience (Figure 8).
• Nearly three-fourths (72%) of the respondents have worked for more than one employer, and more than half (54%) have had 2–4 employers (Figure 9).
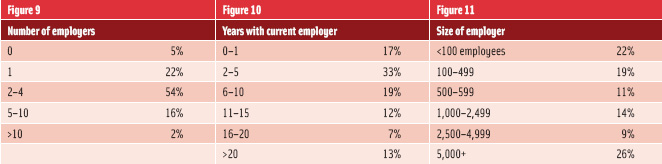 • Slightly more than half (52%) of the respondents work for companies with fewer than 1,000 employees; about one-fourth (26%) work for companies with more than 5,000 employees (Figure 11).
• The great majority (94%) are employed full-time.
• More than two-thirds (67%) of the respondents work in the R&D/scientific/technical category, while 10% are employed in Sales/Marketing, 9% in Education, 8% in Management, 2% in Consulting, 2% in Government, and 1% in Purchasing.
--- PAGE BREAK ---
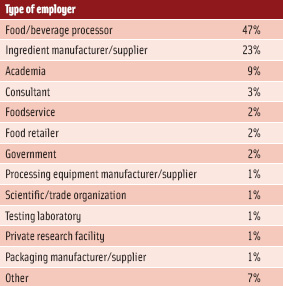 • More than two-thirds (70%) of survey respondents work for food and beverage companies and ingredient suppliers, with the next largest percentage (9%) working in academia (Figure 12).
• Of those employed in academia, 89% work for public educational institutions; 50% are full professors, 21% associate professors, and 12% assistant professors; 66% have been granted tenure, and 13% are on tenure track.
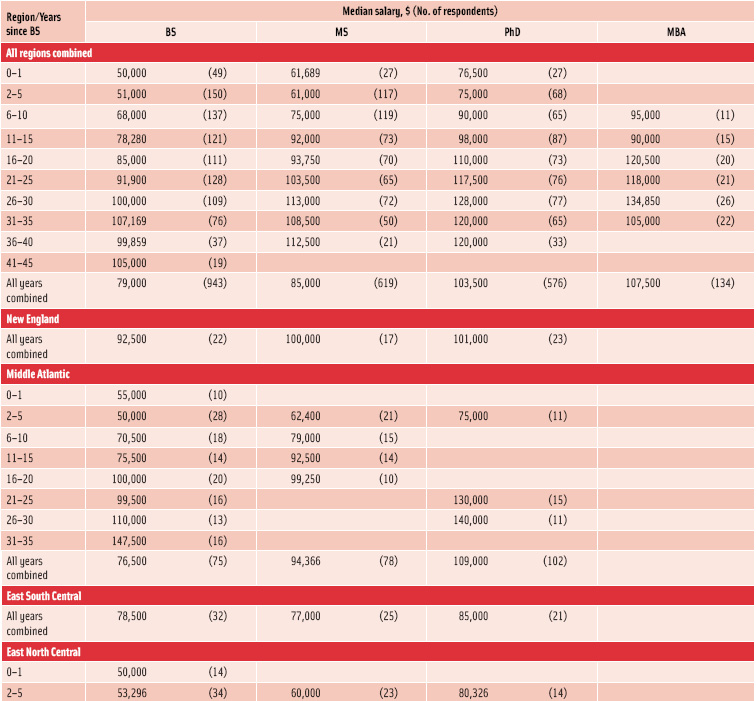
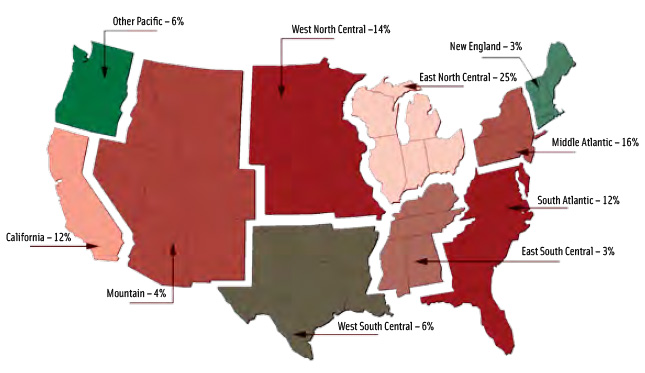 • Almost 60% of the respondents work in states east of the Mississippi River, nearly one-third in East Coast states (Figure 13). Of the U.S. Census Bureau’s geographic divisions of the U.S., the East North Central region—Wisconsin, Illinois, Indiana, Michigan, and Ohio—has the highest percentage of respondents.
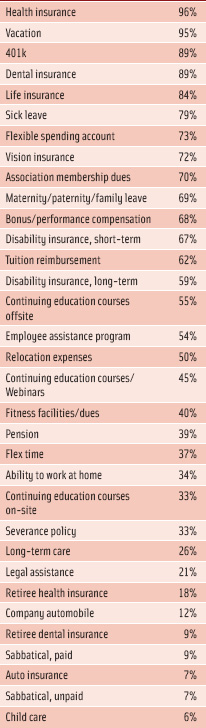 • Most employers provide the basic benefits such as health insurance, vacation, 401k, etc. (Figure 14).
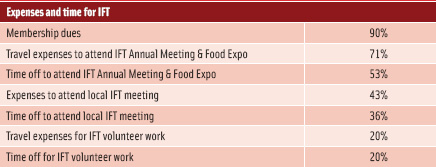 • The majority of employers pay for IFT dues for their employees and give them travel expenses and time off to attend the IFT Annual Meeting & Food Expo®, but fewer provide expenses and time off to attend local IFT meetings or do IFT volunteer work (Figure 15).
Salary Statistics
This article reports salary data only for full-time employees. The data are reported as the median salary, meaning that half of the respondents make more than that amount and half make less. Full-time salaries below $10,000 and salaries of $300,000 or more for persons with less than 6 years of professional food-related experience were eliminated from the tabulations since they appear to be unrealistic.
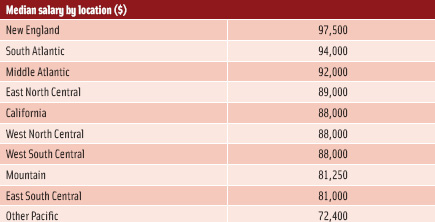 • The New England and South Atlantic regions had the highest median salaries (Figure 16).
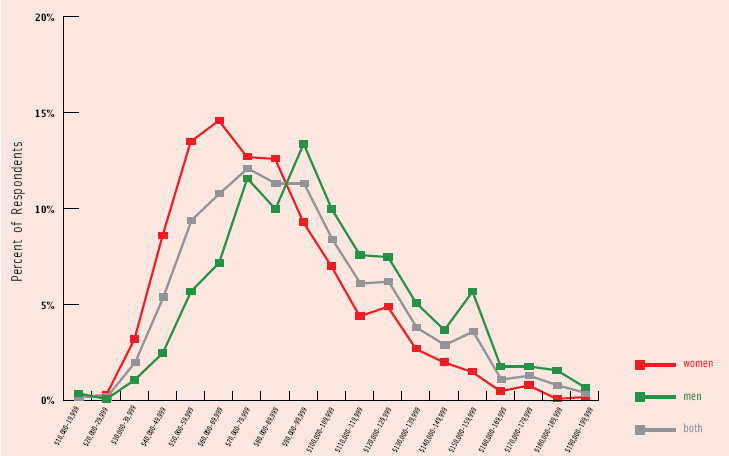 • The distribution of median salaries is shown in Figure 17. Salaries for both sexes combined ranged from $10,000 to $425,000, but 80% were $120,000 or below and 99% were $235,000 or below.
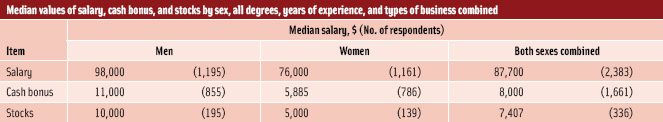
Salaries for men ranged from $10,000 to $425,000, but 80% were $137,000 or below, and 99% were $250,000 or below. The median salary for men was $98,000, an increase of 5.4% from $93,000 in 2007.
--- PAGE BREAK ---
 Salaries for women ranged from $11,880 to $318,000, but 80% were $105,000 or below, and 99% were $190,000 or below. The median salary for women was $76,000, an increase of 4.1% from $73,000 in 2007.
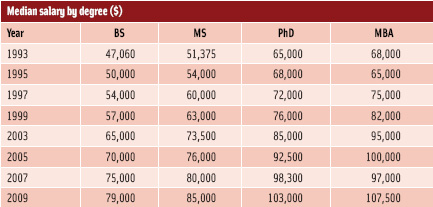 • Median salaries increased for all degree levels (Figure 18).
• The starting salary for both sexes combined—considered here as the median salary for those with one year or less of professional food-related work experience since receiving their BS degree—increased by 9.2% to $50,000 from $45,800 in 2007 (Figure 19).
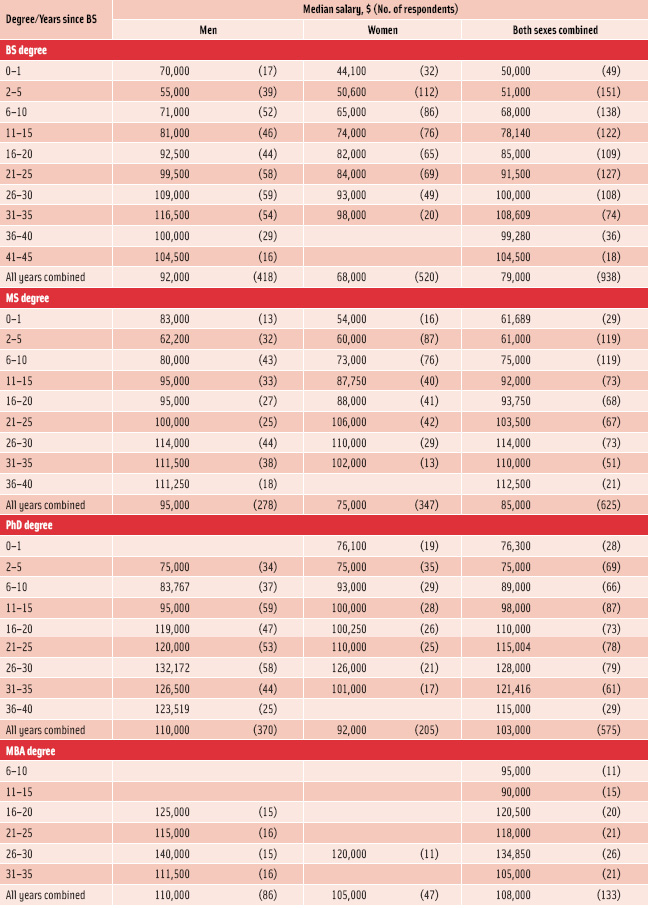
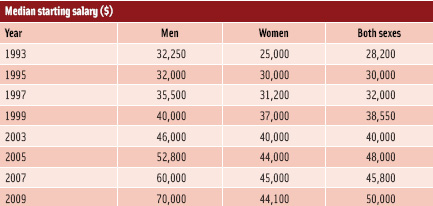 Breaking out the statistics by gender shows that the median starting salary for men was $70,000, an increase of 16.7% from the median of $60,000 in 2007. For women, the median starting salary in 2009 was $44,100, a decline of 2% from $45,000 in 2007.
Input from representatives of food science departments at universities with leading programs in the discipline suggests that these statistics may not be representative of marketplace realities. According to these university contacts, salaries vary more from employer to employer than on the basis of gender.
• In addition to having higher median salaries than women, men also received larger cash bonuses and more in stocks than women (Table 2).
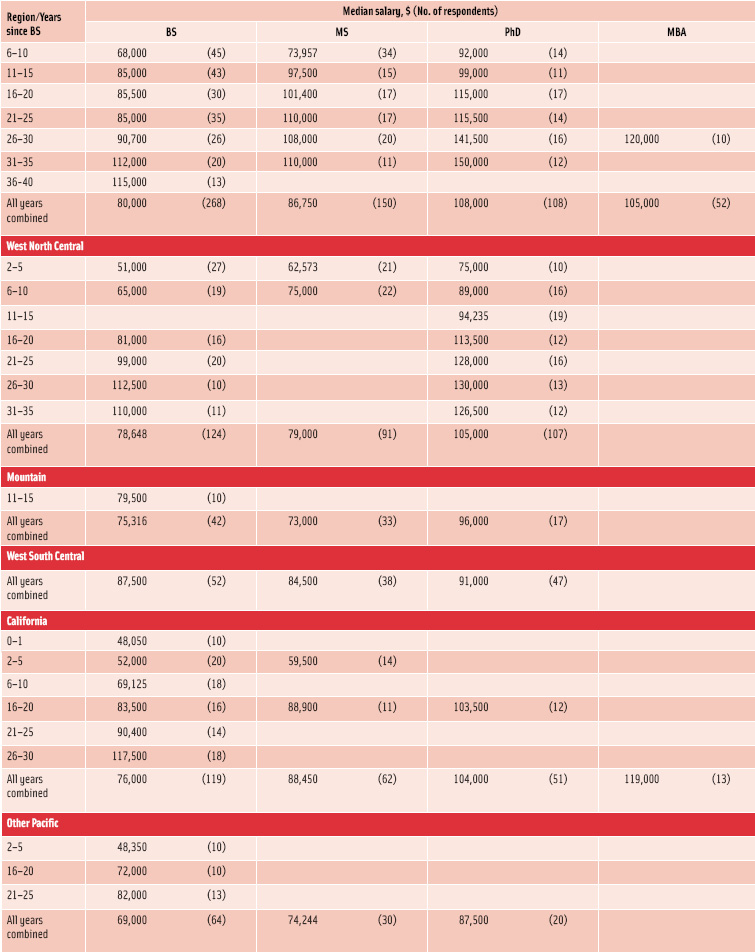
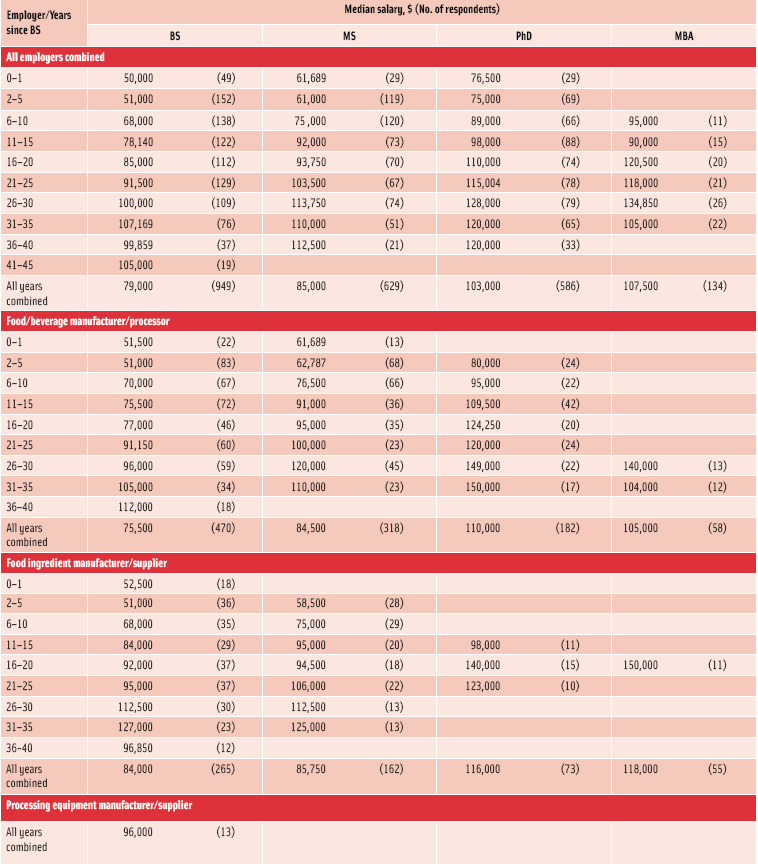
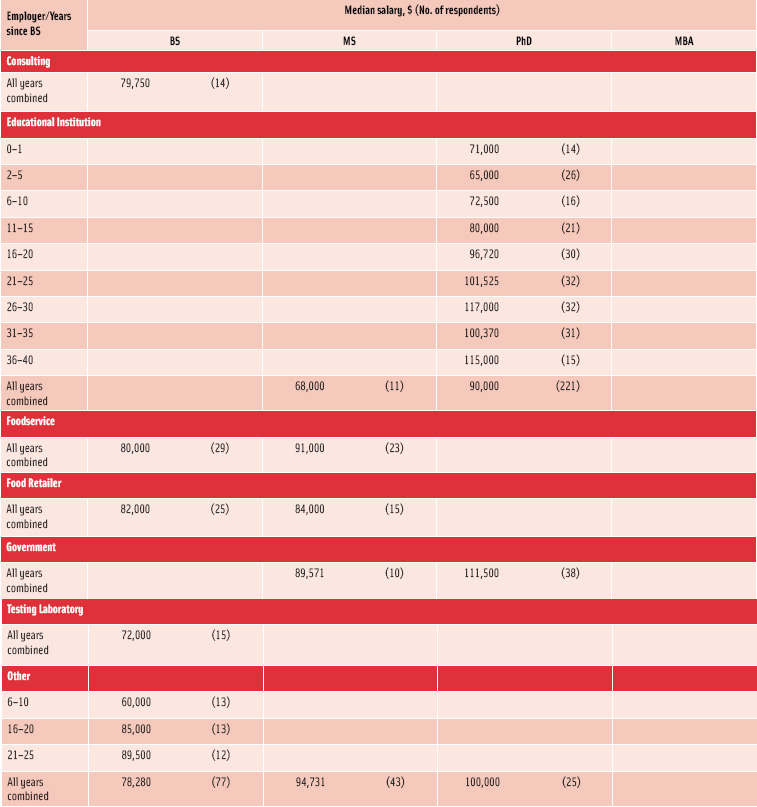
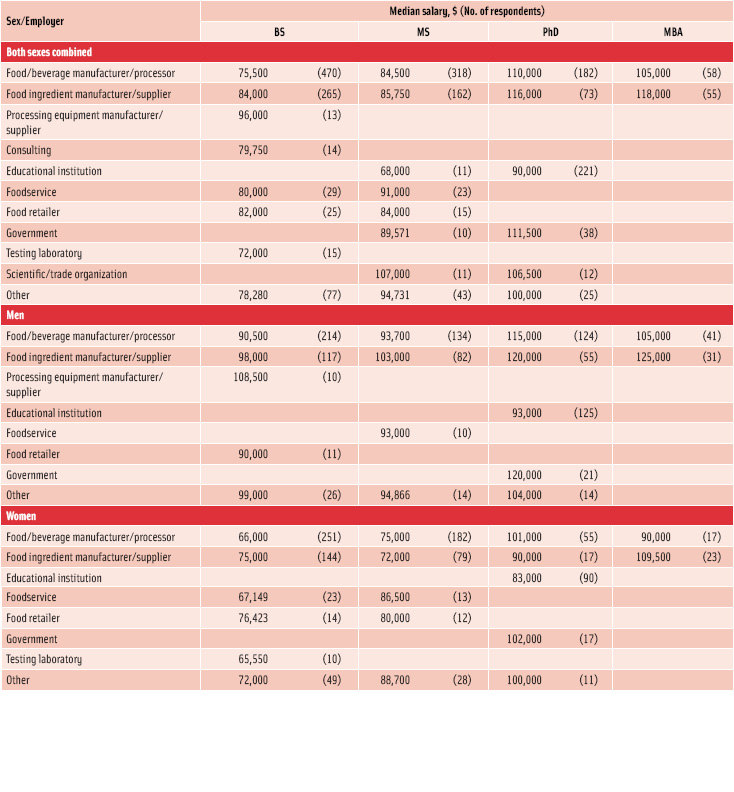
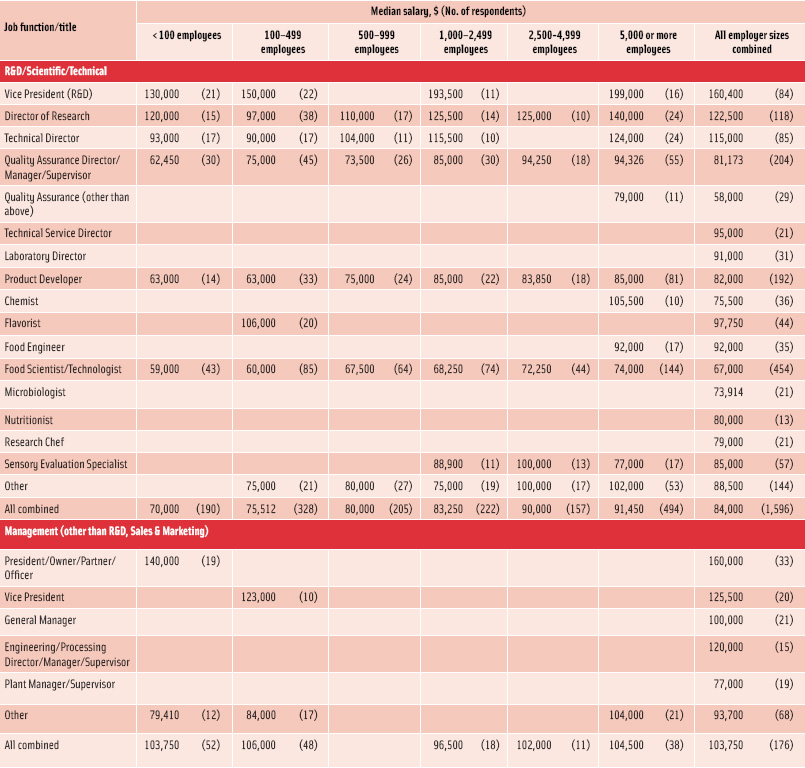
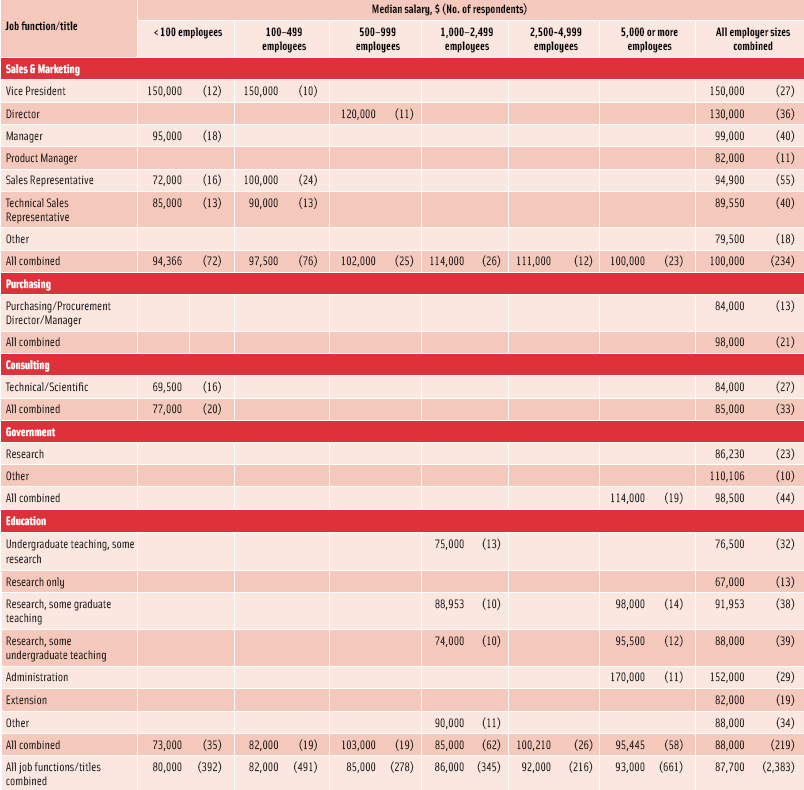
Table 3 shows median salary by degree, experience, and sex; Table 4 by geographical region, degree, and experience; Table 5 by type of employer, degree, and experience; Table 6 by sex, type of employer, and degree; and Table 7 by job function/title and employer size. Data for fewer than 10 respondents are not reported.
--- PAGE BREAK ---
A Look at Food Science and Technology Employment in the UK
There are an estimated 9,000 food scientist and technologist positions in the United Kingdom, according to data compiled by Improve Ltd., a skills development organization for the UK food and beverage manufacturing and processing sector.
 Employers surveyed in 2006 by Improve Ltd. reported that, in general, filling food science and technology positions has become more difficult and more time-consuming. The organization estimates that up to one in four food scientist/technologist positions was vacant in 2005–2006.
More than half (53%) of the employers Improve Ltd. surveyed cited a shortage of qualified food science and technology personnel. Survey participants who perceive such a shortage noted the following contributing factors: image of the industry/profession (cited by 39%); fewer young people studying science subjects at school (36%); and a general lack in “caliber or quality of applicants” (20%).
Survey respondents said that personnel shortages have affected their businesses in a variety of ways including the following: increased workload/longer hours for existing staff (17%); increased business costs, e.g., recruitment, production, pay, or training (16%); decreases in production/productivity/sales or profits (8%); and reduced competitiveness (6%). Overall, 11% of respondents said that food science and technology personnel shortages had a “significant” impact on their business.
Additional research by Improve Ltd. and the UK’s Institute of Food Science and Technology (IFST) indicates that the demand for food scientists and technologists has been growing at a rate of about 3% annually, said Jack Pearce, Past President of IFST and Chair of its Education Committee.
Pearce noted that many food science positions today are being filled only “with difficulty.” During the 1990s, he said, the number of food science and technology students decreased nationwide, and overall student numbers still have not recovered to the level of the mid-1990s. In addition, said Pearce, some university food science and technology departments have closed, and, in his view, there are fewer courses offered with rigorous science, engineering, economics, and marketing content.
A January 2009 report from the UK’s Royal Society of Chemistry and the Institute of Chemical Engineers recommended several strategies for building interest in the food science and technology profession. These include providing career advisors with improved training about food industry careers; having the food sector do a better job of promoting career opportunities; and fostering closer links between the food industry and universities.
Currently, food and beverage producers employ the majority (70%) of food scientists and technologists in the UK. The wholesale and retail sectors employ about 30%. The majority of those employed in food science and technology work for large and medium-sized companies; specifically, 78% of all food science and technology roles in the United Kingdom are with companies with 100 or more employees, according to Improve Ltd. data.
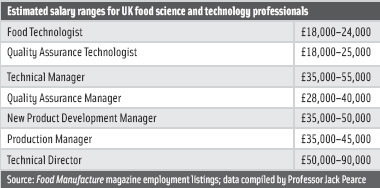
Pearce estimated that starting salaries for BS degree graduates in the UK are in the range of £18,000–20,000 and noted that senior leaders in the food science profession, working in industry, academia, and the public sector, may have salaries in excess of £100,000.
--- PAGE BREAK ---
Canadian Survey Details Food Science Salaries, Job Satisfaction, and More
What aspect of the job matters most to Canadian food scientists? Having a competitive salary heads the list, according to participants in an online survey conducted in September 2008 for Food in Canada magazine; 68% of respondents rated it “very important.” Results of the survey were published in the magazine’s November/December 2008 issue.
It’s not all about money, however. A healthy work/life balance was No. 2 on the list of priority job aspects, ranked very important by 64% of respondents. A comprehensive benefits package was very important to 55% and career growth opportunities very important to 51%. Both career/professional development support and amount of paid vacation were categorized as very important by 48% of respondents.
The mean annual salary (including bonuses and incentives) for Canadian food scientists and technologists in 2007 was $86,400, according to the survey, which was conducted with the assistance of the Canadian Institute of Food Science and Technology.
Survey findings parallel the results of IFT’s salary survey in some ways. In Canada as in the United States, male respondents reported a higher average salary than female respondents—a mean salary of $99,400 for the men vs $66,300 for the women.
The mean salary increase in 2007 for the Canadian survey respondents was 3.5%, although a quarter of those who responded said they received no increase. The survey asked participants about their work weeks, and 43% said they regularly work more than 50 hours a week.
Of those surveyed by Food in Canada, 49% reported having a university degree, 16% a graduate or post-graduate degree, 10% a college diploma (typically a two-year program in Canada), and 4% an MBA.
Most Canadian survey participants had more than a decade of industry experience; 18.4 years of employment was the mean. The mean age of survey participants was 44.8 years, and 60% of the respondents were male.
Many of those who took part in the survey appeared content with their jobs; 44% said they would likely be working in the same position for the next two years, and 25% said they anticipated being promoted by their current employer within the next two years.
Note: IFT Membership Employment & Salary Survey data is reported using median (half of salaries are above the figure, half below) figures, while the Canadian survey reported mean (average) salaries.
IFT’s Career Center
Job seekers have free access to the best employers and jobs in food science and technology through the IFT Career Center. They can browse job postings, receive e-mail notifications when new jobs are listed, and post their resumes. Employers can register to find the most talented and qualified candidates for their job openings. For more information, click on “Employment” and “IFT Career Center” on IFT’s Web site, www.ift.org.
by Mary Ellen Kuhn is Managing Editor of Food Technology magazine ( [email protected] ).