
Tracking Label Claims
The prevalence of health claims and nutrient content claims is increasing, FDA’s latest Food Label and Package Survey shows.
For more than 30 years, the Center for Food Safety and Applied Nutrition (CFSAN) at the Food and Drug Administration (FDA) has conducted studies of the labels of processed, packaged foods from the U.S. food supply through the Food Label and Package Survey (FLAPS). The latest FLAPS, conducted during 2006 and 2007, was the 13th survey of the series. The FDA uses FLAPS data to monitor the food industry’s response to food labeling regulations and to support various policy and regulatory decisions. For example, FDA uses FLAPS data to determine the extent of the quantitative labeling of nutrients (e.g., trans fat, vitamin D) and product ingredients (e.g., wheat gluten, annatto), the prevalence of various health claims (e.g., “Diets low in sodium may reduce the risk of high blood pressure, a disease associated with many factors.”) and nutrient content claims (e.g., “low saturated fat,” “high in vitamin C”), and the frequency of allergen information and food safety statements (e.g., “keep refrigerated”). This overview focuses on the prevalence of health claims, qualified health claims, and nutrient content claims on product packages. 
FDA is responsible for protecting the public health by assuring, in part, the safety of our nation’s food supply and helping members of the public get the accurate, science-based information they need in order to use foods to improve their health. Product packages, including the nutrition label, are vehicles that can help convey this type of information. The Federal Food, Drug, and Cosmetic Act (FD&C Act) and the Fair Packaging and Labeling Act are the federal laws governing food products under FDA’s jurisdiction. The Nutrition Labeling and Education Act (NLEA) of 1990 (NLEA, 1990) amended the FD&C Act and directed FDA to develop regulations to mandate nutrition labeling and nutrition label claims. The resulting Nutrition Facts panel serves as a powerful tool for improving the diets of Americans and also underpins the framework for nutrition label claims (Taylor and Wilkening, 2008a, 2008b). Title 21 of the Code of Federal Regulations (CFR) contains FDA regulations on the nutrition labeling of foods (21CFR101.9) (CFR, 2009a). Regulations for health claims (21CFR101.14, 101.70-101.83) (CFR, 2009b) and nutrient content claims (21CFR101.13, 101.54-101.69) (CFR, 2009c) specify the requirements for each type of claim, how one may petition the FDA to authorize a claim, and the claims that are currently authorized. An estimated 96.3% of FDA-regulated processed, packaged foods have nutrition labeling, with an additional 3.7% exempt from mandatory nutrition labeling requirements (Brandt et al., in press). While nutrition labeling is mandatory for most processed, packaged foods, some foods qualify for labeling exemptions. It is important to note, however, that exemptions are not allowed if a health or nutrient content claim is made (CFR, 2009d).
NLEA required that FDA issue regulations authorizing the use of a health claim about a substance/ disease relationship only for those that met the significant scientific agreement (SSA) standard (CFR, 2009e). This standard is designed to provide a high level of confidence in the validity of the substance/ disease relationship. There have been no regulations authorizing a new SSA health claim since the reporting of data from the previous FLAPS (2000–2001) (LeGault et al., 2004), but there have been several regulations to amend existing SSA health claims to expand the use of a claim to include additional substances. Since that time, there have also been four new health claims and nutrient content claims based on the Food and Drug Administration Modernization Actof 1997 (FDAMA). FDAMA permits the use of health or nutrient content claims based on currently published authoritative statements from certain federal scientific bodies and the National Academy of Sciences (FDA, 1998). The FDAMA provisions are intended to expedite the process by which the scientific basis for such claims is established. The four new claims are: 1) a nutrient content claim for choline (FDA, 2001); 2) a health claim for fluoridated water and reduced risk of dental caries (FDA, 2006a); 3) a health claim about saturated fat, cholesterol, and trans fat in foods and reduced risk of heart disease (FDA, 2006b); and 4) a health claim for dietary substitution of saturated fat with unsaturated fatty acids and reduced risk of heart disease (FDA, 2007).
Several dietary supplement manufacturers challenged the FDA decision to apply the SSA standard to dietary supplements. The lawsuit, known as the Pearson lawsuit, focused on a manufacturer’s right to make statements about the relationship between diet and disease when the science supporting the claim did not meet SSA, provided that the claim about the relationship was stated or “qualified” in such a way as to not mislead consumers. The FDA had progressed through a series of steps to implement the Pearson court ruling by issuing a Federal Register notice in December 1999 outlining its plans to implement the ruling for dietary supplements (U.S. DHHS, 1999), and in October 2000, the agency stated its intention to rely on enforcement discretion to provide for qualified health claims for dietary supplements (U.S. DHHS, 2000). During this time period, the agency was challenged over the denial of a health claim concerning antioxidant vitamin supplements and the reduced risk of cancer in a court case known as Whitaker vs Thompson. In interpreting the earlier Pearson decision, the District Court used “credible evidence” rather than the “weight of the evidence” standard in evaluating the claim. In December 2002, FDA announced “The Consumer Health Information for Better Nutrition Initiative,” which provided for the use of qualified health claims for both conventional foods and dietary supplements. The FDA has issued several letters of enforcement discretion for qualified health claims, which are available for review at http://www.fda.gov/Food/LabelingNutrition/Label-Claims/QualifiedHealthClaims/ucm072756.htm.
--- PAGE BREAK ---
The current study also provides a review of the prevalence of nutrient content claims, including those about the amount or percentage of a nutrient (e.g., trans fat) in a food product. Trans fat has been added as a mandatory nutrient to the nutrition label directly underneath the line for saturated fat (see 21CFR 101.9(c)(2)(ii)) (CFR, 2008a) and was the first change to the Nutrition Facts label since mandatory nutrition labeling began in the early 1990s. Mandatory trans fat labeling has served as a catalyst to accelerate food reformulations to reduce trans fat (Eckel et al., 2007) and also resulted in food manufacturers describing these levels of trans fat on the label of foods.
While FDA has no regulation defining nutrient content claims that characterize the level of trans fat (e.g., “trans fat free”), the label or labeling may currently contain a nutrient content claim about the amount or percentage of a nutrient (e.g., “0 g trans fat”) (see 21CFR101.13(i)(3)) (CFR, 2008c). FLAPS data that describe the overall prevalence of trans fat statements have been reported elsewhere at 12% of products sold (Brandt et al., in press),but this study examines the trans fat statements within product groups.
The data from FLAPS continue to provide a useful overview of current food labels and are a beneficial resource for FDA to assess the prevalence of claims presented on the food label. By comparing data from earlier FLAPS studies, FDA can also characterize trends by the food industry in providing these types of nutrition labeling information.
FLAPS 2006–2007: Design and Analysis
The ACNielsen (Nielsen) Strategic Planner market database of U.S. food stores served as the sampling frame of food products from which FDA drew a representative sample of food brands and items for FLAPS (ACNielsen, 2005). The Nielsen database includes sales dollars collected from food sales scanner data from more than 3,000 grocery stores with more than $2 million in revenue from nearly all chains and a representation of independents across the United States. The database generalizes by ratio estimation to 80–85% (± 3%) of the retail food sales in the U.S. Nielsen also collects retail scanner information from drug stores and mass merchandisers, but FDA did not use the food sales data from those outlets for this study.
FDA formed the sampling frame from available Nielsen data purchased under contract, which covered 44 weeks of sales, ending in November 2005. The sampling frame contained only the conventional food products regulated by FDA, including private-label brands and excluding dietary supplements as well as food products regulated by the U.S. Dept. of Agriculture. Due to the difficulty in locating and purchasing low-selling items, FDA only considered products sold in at least 2% of the stores in the retail market. The products were stratified in the sampling frame into 57 FDA-determined product groups, and the number of sampled products in each product group was set proportional to the sales dollars of each of the product groups. FDA selected the product sample using a stratified, two-stage design with selection probabilities proportional to nationally estimated sales dollars. The first stage of sampling was at the brand level within each product group. In each product group, brands were selected without replacement with probability proportional to brand sales dollars. At the second stage of sampling, one item was selected within each brand selected in the first stage with probability proportional to item sales dollars.
FDA and contract field staff purchased products from supermarkets across the U.S. Manufacturers of several products that could not be located in stores sent in a product label, and FDA ordered a few products online. For those items no longer available or unable to be located, FDA permitted careful and controlled substitution. In order to approximate the original item as much as possible, brand, label, and item size were among the factors considered in choosing the substitutes.
The final 2006–2007 FLAPS database consists of 1,227 products, providing a response rate of 94.5%. For those product groups in which not all items were located, FDA made nonresponse adjustments to the sampling weights, with the nonresponse factors calculated at he product group level (Cochran, 1977). The Nielsen market data were used to compute sampling weights for each product in the FLAPS database and thus calculate weighted estimates to reflect the percent of products old with selected label information. Estimates were calculated using PROCSURVEYFREQ, available in SAS 9.1.3 (Copyright © 2002–2003, SAS Institute, Cary, N.C.).
Any generalization relative to all food products in the marketplace is limited by the realization that products sold in less than 2% of the retail market, foods sold in retail stores and outlets other than supermarkets, and foods regulated by USDA are not included. Nevertheless, FLAPS provides the most reasonable and comprehensive overview of product label information in the U.S. today.
--- PAGE BREAK ---
What the Data Show
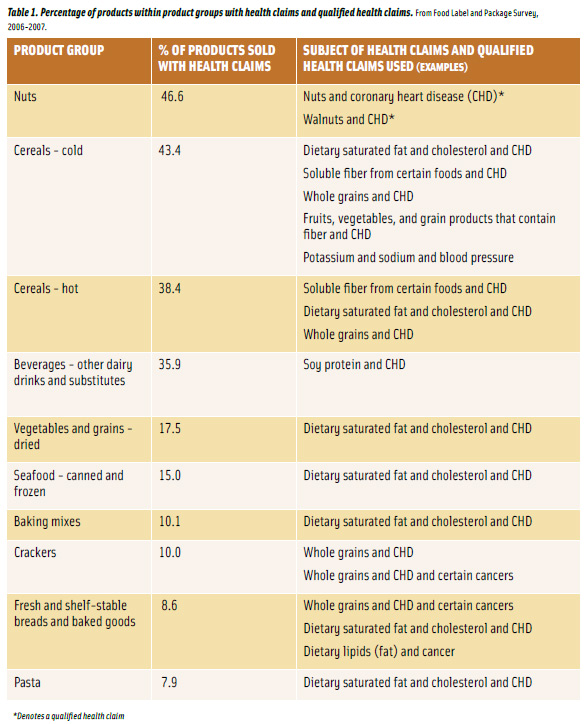
• Products with health claims and qualified health claims. An estimated 4.8% of products sold, from 25 of the 57 product groups, had either a health claim or a qualified health claim on the food package, which is an increase from the 4.2% and 4.4% reported from FLAPS 1997 and 2000–2001, respectively (Brecher et al., 2000; LeGault et al., 2004). Health claims accounted for most (4.3%), and included either SSA claims (3.9%) or those reviewed through the FDAMA notification process (0.8%). Some products had more than one health claim and explain the variation in the total percentage. There were very few qualified health claims (0.4%). Table 1 identifies the product groups with the highest percentage of health claims and qualified health claims by claim subject. The most prevalent claim was about the relationship between a diet low in saturated fat and cholesterol and a reduced risk of coronary heart disease.
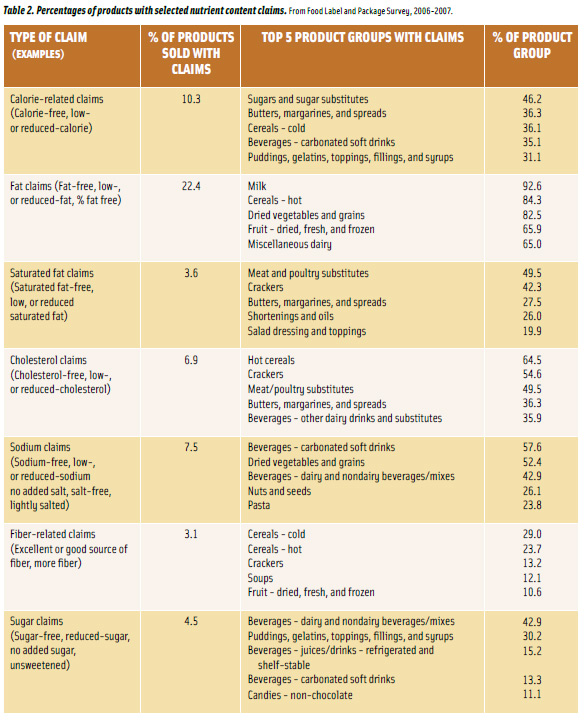
• Products with nutrient content claims. More than half (53.2%) of the products sold, from 54 of the 57 product groups, had nutrient content claims, a 3.5% increase over the 49.7% reported in FLAPS 2000–2001 (LeGault et al., 2004). The most prevalent nutrient content claims were those about total fat, identified on more than one out of every five products (22.4%). Table 2 shows the percentage of products sold with selected nutrient content claims and the five product groups having the highest percentage of products with the claims.
Significant source claims (e.g., “high protein,” “good source of vitamin A,” “enriched with vitamin C”) were found on one-fifth of the products (20.5%). The most frequently indicated nutrients included in significant source claims were calcium (7.8%), vitamin D (7.2%), vitamin A (6.2%), “essential vitamins and minerals” (3.8%), fiber (2.3%), iron (2.2%), and vitamin C (2.2%). Very few products displayed a nutrient content claim using the term “light” or “lite” (2.4%), “antioxidant” (1.6%), “omega-3 fatty acids” (0.7%), or “lean” (0.5%).
• Implied nutrient content claims. An estimated 7.6% of all products included the term “healthy,” an implied nutrient content claim, showing more than a two-fold increase over the 3.3% found in FLAPS 2000–2001 (LeGault, 2004). The most prevalent product groups displaying “healthy” included dried vegetables and grains (52.4%); cold cereals(42.4%); and beverages—other dairy drinks and substitutes (35.9%). Other implied claims, found on 5.6% of products sold, were comparison claims (e.g., “as much calcium per slice as 8 oz of milk,” “two times protein of an egg”) or beneficial preparation claims (e.g., “baked, not fried,” “non-hydrogenated,” “made with olive oil”).
• Amount claims for trans fat. Nutrient content claims about the amount of trans fat (i.e., a factual statement such as “0 g trans fat”) were spread over a broad range of product groups. A varied proportion of products with trans fat factual statements accounted for one-third or more of the products sold within individual product groups. The product groups with the greatest percentage of products bearing a trans fat factual statement out of all products sold within the groups include:1) snacks (popcorn, pretzels, and chips) (66.7%); 2) meat and poultry substitutes (49.5%); 3) dips and spreads (42.9%); 4) crackers (37.9%); 5) canned and frozen seafood (36.5%); 6) butter, mayonnaise, and spreads (36.1%); 7) snacks (granola bars and trail mixes) (33.3%); and 8) fresh and shelf-stable breads and baked goods (32.1%).
Claims as Value Added for the Consumer
Research shows that consumers repeatedly express interest and belief in foods that promote health (Kapsak et al., 2008) and named “reading food labels” as one of many strategies that could improve their health (Borra, 2006). The nutrition information provided on the label may be the only source of information available to the consumer at the point of purchase (Cowburn and Stockley, 2005). So if consumers have reliable nutrition information available at the point of purchase, and if they understand how their diet affects their risk of different diseases, they will make healthier food choices and, in turn, reduce the costs to society of treating conditions such as heart disease and some cancers (Balasubramanian and Cole, 2002).
--- PAGE BREAK ---
Increasingly, health claims on foods are recognized as important and, consequently, are being regulated in more countries around the world (Jones et al., 2008). In the U.S., health claims have been regulated since the enactment of NLEA and were designed to give consumers more scientifically valid information about the foods they eat. Consumers report that health concerns and the presence of health-related claims on food products influence their food choices. A 2001 study found that nearly 60% of sampled shoppers indicated that some personal health concern strongly affected their grocery purchases, and 76% said they felt that healthy eating was a better way to manage their health than medication. By 2002, these statistics increased to 80% and 86%, respectively (Mancino and Kinsey, 2008). The 2004 Food Marketing Institute’s Shopping for Health survey (FMI, 2004) showed that more than two out of five respondents (42%) said they had purchased foods claiming to reduce their risk of developing heart disease, and more than one-fourth (26%) reported purchasing products that claimed to reduce the risk of cancer (FMI, 2004). The 2009 Consumer Panel Survey found, however, that consumers who report that they “almost always” look at health claims (36%) are down a significant seven points from the 43% reported in 2008, but those reporting “sometimes” (48%) nearly offset this finding with a 5% increase (NGA, 2009). While it is apparent that some consumers search for foods with health claims, FLAPS data show that relatively few products (4.8%) have them.
FDA considers consumer input an integral part of its regulatory development process (Lin, 2008), but most consumers are unaware of the legal requirements, regulatory processes, and scientific evaluation that underlie health claims and qualified health claims and are unlikely to understand the subtle regulatory differences between those claims (Turner et al., 2005). Nevertheless, to ensure that labeling is truthful and not misleading to consumers, FDA has designed and implemented for industry a systematic review process that its scientists use to evaluate the science underlying health claims and qualified health claims (FDA, 2009).
Nutrient content claims on food packages provide information about the levels of nutrients in a food to assist consumers in making better food choices. According to the 2004 FMI survey, almost two-thirds (63%) of shoppers said they had purchased a food in the past month or so because of a low-fat claim on the package, and more than half said they had purchased a food because it was low in saturated fat (55%), low in calories (52%), high in calcium (51%), or high in vitamin C (51%) (FMI, 2004). FLAPS data show that more than half (53.2%) of the products identified in the survey had nutrient content claims. Comparing current estimates to those from the previous survey (LeGault et al., 2004), the prevalence of nutrient content claims on food labels increased primarily for total fat (+4.8%), “healthy” (+4.3%), and calories (+2.7%). Growth in the manufacturer use of these claims may be associated with their attempt to increase consumer awareness about healthier foods. Also, in 2005, FDA brought “healthy” to the forefront by amending its regulations concerning the maximum sodium levels permitted for foods that bear the implied nutrient content claim “healthy.” This amendment may have spurred manufacturers to reformulate so that more products are able to use this claim, which the FDA encourages since these products will be consistent with dietary recommendations.
While nutrient content claims that characterize the level of trans fat have yet to be determined (e.g., trans fat free, reduced trans fat), the use of claims about the amount or percentage of trans fat is an indication of industry’s interest in sharing trans fat information on the label. In an attempt to define nutrient content claims for trans fat, FDA issued an Advanced Notice of Proposed Rulemaking (ANPRM) (U.S. DHHS, 2003) to solicit comment and consumer research, in part, on an appropriate basis for establishing qualifying criteria for trans fat in trans fat nutrient content claims. FDA has also conducted consumer research to determine consumers’ perception of “reduced” and “free” trans fat nutrient content claims. These results, along with comments from the ANPRM and current science, will be used to determine a strategy for defining trans fat nutrient content claims.
Product label claims can play an influential role in assisting consumers wishing to identify foods that are high or low in specified nutrients and in assisting individuals with special dietary needs in making healthy dietary choices. For example, foods bearing a health claim that describes the relationship between intake of “sodium and reduced risk of hypertension” or “potassium and reduced risk of high blood pressure and stroke,” as well as foods labeled as “low sodium” or “no sodium,” will help consumers with restricted sodium diets to identify appropriate foods. Likewise, consumers wishing to increase their calcium intake can look for foods labeled as “excellent source of calcium” or “high in calcium” or bearing a health claim that describes the relationship between intake of “calcium or calcium and vitamin D and reduced risk of osteoporosis.”
The nutrition labeling regulations, survey sampling designs and methodologies, and sample weighting for FLAPS have changed since the survey’s initial implementation in 1976. Differences in surveys may thus preclude a direct comparison of estimates over time, despite the scientific and thorough nature of the schema. Nevertheless, the changes in sampling design, methodologies, and weighting have made FLAPS a better survey that allows FDA to continue to characterize the storehouse of information found on the nutrition label and make that information available to the public.
Mary Bender Brandt, Ph.D., is Applied Statistician, Food and Drug Administration, Center for Food Safety and Applied Nutrition (CFSAN), 5100 Paint Branch Parkway, College Park, MD 20740 ( [email protected] ). Julie Moss, Ph.D., a Member of IFT, is Deputy Director of the International Affairs Staff, CFSAN ( julie. [email protected] ). Kathleen Ellwood, Ph.D., is Director of the Nutrition Programs Staff, CFSAN ( [email protected] ). Martine Ferguson is Mathematical Statistician, CFSAN ( martine. [email protected] ). Aden Asefa is ORISE fellow, CFSAN ( [email protected] ).
This project was supported in part by an appointment to the Research Participation Program at the Center for Food Safety and Applied Nutrition administered by the Oak Ridge Institute for Science and Education through an interagency agreement between the U.S. Dept. of Energy and the U.S. Food and Drug Administration.
References
ACNielsen. 2005. ACNielsen (Nielsen) Strategic Planner.ACNielsen, Chicago, Ill.
Balasubramanian, S. and Cole, C. 2002. Consumers’ search and use of nutrition information: the challenge and promise of the Nutrition Labeling and Education Act. J. Marketing 66(3): 112-127.
Borra, S. 2006. Consumer perspectives on food labels. Am. J. Clin. Nutr. 83(suppl): 1235S.
Brandt, M., Moss, J., and Ferguson, M. 2009. The 2006-2007 Food Label and Package Survey (FLAPS): nutrition labeling, trans fat labeling. J. Food Comp. Anal. (in press).
Brecher, S.J., Bender, M.M., Wilkening, V.L., McCabe, N.M., and Anderson, E.M. 2000. Status of nutrition labeling, health claims, and nutrient content claims for processed foods: 1997 Food Label and Package Survey. J. Am. Diet. Assn. 100: 1057-1062.
CFR. 2009a. Code of Federal Regulations. Nutrition labeling of food. 21CFR101.9.
CFR. 2009b. Code of Federal Regulations. Health claims. 21CFR101.14, 101.70-101.83.
CFR. 2009c. Code of Federal Regulations. Nutrient content claims. 21CFR101.13, 101.54-101.69.
CFR. 2009d. Code of Federal Regulations. Nutrition labeling of food—exemptions. 21CFR101.9(j)(1)-(18).
CFR. 2009e. Code of Federal Regulations. Health claims—validity requirement. 21CFR101.14(c).
Cochran, W.G. 1977. “Sampling Techniques,” 3rd ed. John Wiley & Sons Inc., New York.
Cowburn, G. and Stockley, L. 2005. Consumer understanding and use of nutrition labelling: a systematic review. Pub. Health Nutr. 8(1): 21-18.
Eckel, R.H., Borra, S., Lichtenstein, A.H., and Yin-Piazza, S.Y. 2007. Understanding the complexity of trans fatty acid reduction in the American diet: American Heart Association Trans Fat Conference 2006: report of the Trans Fat Conference Planning Group. Circ. 115: 2231-2246.
FDA. 1998. Guidance for Industry—Notification of a Health Claim or Nutrient Content Claim Based on an Authoritative Statement of a Scientific Body.
FDA. 2001. Nutrient Content Claim Notification for Choline Containing Foods.
FDA. 2006a. Health Claim Notification for Fluoridated Water.
FDA. 2006b. Health Claim Notification for Saturated Fat, Cholesterol, and Trans Fat.
FDA. 2007. Health Claim Notification for Dietary Substitution of Saturated Fat with Unsaturated Fatty Acids.
FDA. 2009. Guidance for Industry: Evidence-Based Review System for the Scientific Evaluation of Health Claims.
FMI. 2004. Shopping for Health – Making Sense of Nutrition News and Health Claims, Food Marketing Institute, Arlington, Va. www.fmi.org.
Kapsak, W.R., Schmidt, D., Childs, N.M., Meunier, J., and White, C. 2008. Consumer perceptions of graded, graphic and text label presentations for qualified health claims. Crit. Rev. Food Sci. Nutr. 48(3): 248-256.
Jones, P.J.H., Asp, N.-G., and Silva, P. 2008. Evidence for health claims on foods: how much is enough? Introduction and general remarks. J. Nutr. 138: 1189S-1191S.
LeGault, L., Bender Brandt, M., McCabe, N., Adler, C., Brown, A.-M., and Brecher, S. 2004. 2000-2001 Food Label and Package Survey: an update on prevalence of nutrition labeling and claims on processed, packaged foods. J. Am. Diet. Assn. 104(6): 952-958.
Lin, C.J. 2008. How do consumers interpret health messages on food labels? Nutr. Today 43: 267-272.
Mancino, L. and Kinsey, J. 2008. “Is Dietary Knowledge Enough? Hunger, Stress, and Other Roadblocks to Healthy Eating,” ERR-62, U.S. Dept. of Agriculture, Economic Research Service 1.
NGA. 2009. 2009 Consumer Panel Survey. National Grocers Association, Arlington, Va.
NLEA. Nutrition Labeling and Education Act of 1990. Pub L 101-535, 104 Stat 2353.
Taylor, C.L. and Wilkening, V.L. 2008a. How the nutrition food label was developed, part I: the Nutrition Facts panel. J. Am. Diet. Assn. 108(3): 437-442.
Taylor, C.L. and Wilkening, V.L. 2008b. How the nutrition food label was developed, part 2: the purpose and promise of nutrition claims. J. Am. Diet. Assn. 108(4): 618-623.
Turner, R.E., Degnan, F.H., and Archer, D.L. 2005. Label claims for foods and supplements: a review of the regulations. Nutr. Clin. Prac. 20: 21-32.
U.S. DHHS, FDA. 1999. Food labeling: health claims and label statements for dietary supplements. Strategy for implementation of Pearson court decision. Food and Drug Admin., Fed. Reg. 64: 67289-67291.
U.S. DHHS, FDA. 2000. Food labeling: health claims and label statements for dietary supplements. Update to strategy for implementation of Pearson court decision. Food and Drug Admin. Fed. Reg. 65: 59855-59857.
U.S. DHHS, FDA. 2003. Food Labeling: Trans Fatty Acids in Nutrition Labeling; Consumer Research to Consider Nutrient Content and Health Claims and Possible Footnote or Disclosure Statements: Advance Notice of Proposed Rulemaking. Food and Drug Admin., Fed. Reg. 68: 41507-41510.