
Top 10 Food Trends
A move to three square meals a day, more home cooking, and an all-out cry to ‘get real’ are among the major trends reshaping the food industry in 2011 and beyond.
Although the consumer food products industry demonstrated definite signs of improvement last year, financially wary—and weary—consumers will continue to practice conservative food spending and eating behaviors in 2011, albeit to a lesser degree than two years ago. Rising food and gasoline prices, along with high unemployment and inflationary fears, will likely make 2011 another challenging year. One-third (33%) of consumers feel their own financial situation will get worse in 2011; 40% believe the economy will fail to improve in the next six months (IRI, 2011).
But it’s not all doom and gloom for food marketers. Just over seven in 10 meals (72%) are now prepared in the home, rejuvenating once stagnant basic ingredient, home baking, and prepared mix sectors; 18% of meals were purchased at restaurants (NPD, 2011; Sloan, 2011a).
Eating-in and take-from-home trends have rejuvenated the center store, which houses many of the 10 fastest-growing categories in unit sales in grocery, drug, mass excluding Wal-mart, and convenience stores (FDMxC) (IRI, 2011). Examples of such fast-track categories include ready-to-drink tea and coffee, snack/granola bars, and dried meat snacks (see Figure 1). Across meal-related segments, the fresh and frozen foods departments also posted above average growth, led by frozen vegetables and refrigerated lunches (IRI, 2011).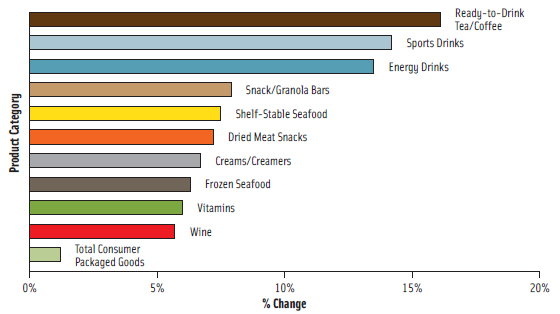
Small, indulgent treats, e.g., cheesecake and frozen novelties, enjoyed brisk sales (IRI, 2011). Among the 10 largest consumer packaged goods (CPG) food categories, chocolate candy, salty snacks, and bottled water made significant gains in FDMxC in 2010 (IRI, 2011). New/unique varieties, recipes, and flavor combinations topped the list of claims found on some of the most successful new foods/drinks introduced from 2009 to 2010 (IRI, 2010a). Claims that relate to technological advances (packaging that permits steam cooking in the microwave, for example) are now second only to flavor claims among the year’s best-selling new foods and beverages (IRI, 2010a).
In 2010, selecting groceries to prepare nutritious/wholesome meals was a priority for food shoppers, second only to taste. Shoppers also said they were purchasing products in order to help manage a specific health condition and to lose weight (IRI, 2010a).
Although consumers say they’ll continue to eat out less frequently this year than they did a few years ago, U.S. restaurant industry sales are projected to reach an all-time high of $604 billion after three years of declines (IRI, 2011). Sixty percent of quick-service restaurants (QSRs), 86% of fine dining establishments, 84% of casual restaurants, and 68% of family dining restaurants plan to add new menu items this year (NRA, 2011).
Private-label share gains slipped in both dollar and unit sales in 2010, down 0.5% across all channels (IRI, 2011). However, at $88.5 billion in sales, private label will remain a powerful force (PLMA, 2011).
Supermarkets continue to dominate consumer food spending with a 49% share of sales in 2010. The drug channel posted notable gains in the food/beverage area in 2010 (IRI, 2011).
--- PAGE BREAK ---
1. Demograpically Directed
Dramatic differences in food preferences, eating styles, and attitudes/behaviors between the nation’s 100 million adults over age 50 and the 74 million Gen Yers ages 16–33 will force food companies to more directly target flavors, foods, and food messages to different generations.
From 2008 to 2010, the number of adults ages 55–64 was projected to grow 42%, with the number of those ages 65–74 to be up 39% (U.S. Census, 2010). The last generation raised on European cooking and the “Basic 4” concept of healthy eating, those ages 50+ are the most likely to cook from scratch, prepare an entree/sides for dinner, and eat three complete meals a day. They’re also the highest per capita spenders at restaurants (Sloan, 2010a).
As baby boomers age, they’ll drive demand for desserts, breakfast items, fruit/vegetables, snack nuts, fish/seafood, soup, coffee, cookies, crackers, chocolate candy, diet soda, and spirits/wine (IRI, 2009). The NPD Group predicts that Gen Yers will drive consumption of salty/savory snacks, easy meals, center-of-the-plate proteins, sweet snacks/desserts, and heat-and-eat breakfasts (NPD, 2009).
Gen Yers remain the most interested in gourmet, ethnic, and spicy foods. They’re the most likely to entertain at home. Members of this demographic subset also are exploring healthy and performance-based eating, driving demand for fresh, all natural, organic, and naturally fortified foods (Technomic, 2010a). Members of this group are the No. 1 users of functional foods/drinks (Mintel, 2009a).
The number of teenagers will drop 3% from 2005 to 2015, putting pressure on sustaining teen-driven markets for energy beverages, fast foods, salty snacks, and hearty handheld snacks; the number of Hispanic teens will increase 24% (U.S. Census, 2010). With 28% of adults living alone and empty nesters still the largest household unit, selling foods and beverages in smaller package sizes holds normous promise (FMI, 2010).
Households with incomes of less than $35,000 are projected to represent nearly 40% of U.S. households by 2015 (U.S. Census, 2010). Low-income households are expected to deliver $115 billion in incremental CPG spending over the next 10 years (IRI, 2010b). Low-income shoppers are driving growth in fresh bread/rolls, yogurt, salty snacks, natural cheese, and cold cereal, among other sectors. Members of these households are surprisingly health conscious: 70% bought fortified products in 2009 and 68% purchased condition-specific products (Packaged Facts, 2009a).
Affluent ethnic households (household incomes >$200,000), which represent $110 billion in purchasing power, are another overlooked market segment. Affluent Hispanic consumers spend an average of 30% of their weekly food dollars on specialty foods, African-Americans 28%, and Caucasians 24%. Supplying transplanted shoppers from foreign countries with foods/ingredients from their home countries has received limited attention at best (Thomas, 2011).
With the highest birth rate in U.S. history occurring in 2007 and the U.S. Dept. of Agriculture’s Women, Infants and Children program providing incentives for breastfeeding vs formula, the baby business is now all about baby/toddler food/snacks (Dudlicek, 2011).
--- PAGE BREAK ---
Eating at home as a family is in vogue. The share of family meals eaten at home climbed from 52% in 2003 to 73% in 2010, which suggests an excellent market opportunity for convenient, affordable family meal kits (ADA, 2010).
2. Still Cooking
In 2010, more than half (55%) of grocery shoppers prepared more meals at home than in 2009, approaching a 20-year high (FMI, 2010). Just about half (53%) of meal preparers now make dinner, including an entrée, four or more nights a week; 90% do so at least once a week. In addition, 61% prepare a frozen entrée, and 36% pick up a prepared entree at least once a week (Tarnowski, 2011).
One-third (32%) of shoppers cooked more from scratch in 2010 vs 2009 (FMI, 2010), but interest in self-cooking may be moderating as the economy improves. In 2011, 48% of consumers say they plan to continue to cook from scratch, down 7% from last year (IRI, 2011).
Nearly two-thirds (64%) of Gen Yers cooked more meals at home last year, and members of this group are the most likely to use prepackaged items to make dinner, which means that this group is driving demand for convenience foods that are more gourmet, ethnic, and healthful (FMI, 2010; Sloan, 2011b). Mexican foods/kits were among the fastest-growing center-store categories in 2010 (IRI, 2010c).
A survey conducted late in 2010 by the Meridian Consulting Group found that today’s meal preparers are looking to put something different on the table for dinner every night in contrast to the typical family meal repertoire of just seven to nine dishes just a few years ago (Tarnowski, 2011). The opportunities for new meal components are enormous. On a typical weekday, 57% of meal preparers serve a meat/poultry or seafood entrée; 43% a rice, potato, stuffing, or pasta side dish; 42% a vegetable side dish; 24% bread, biscuits, or rolls; 20% a green salad; and 15% dessert (MSI, 2009a).
Heat-and-eat meat/poultry is gaining in popularity; only one-third (34%) of consumers never purchase these items, down 6% in one year; one-third use them at least once a week. One in three shoppers (30%) wants to be able to microwave these items in their original package (FMI, 2011).
Simple instructions, pop-up timers, and serving suggestions are a must for consumers. Only one-third (33%) of shoppers feel that they’re very knowledgeable about preparing fish/seafood; 39% feel expert in marinating/spicing meat. Just 16% of consumers feel very knowledgeable about pairing food and wine (FMI, 2011).
Fresh-cut vegetables for meal preparation account for 14% of fresh-cut vegetable sales, up 7.4% in dollar sales for the year ended (Y/E) 6/30/10. Sales of vegetable medleys were up 15.9%, cut peppers and onions, each up 6%, and carrots up 2.4% (Perishables Group, 2010).
The trend to cooking with small appliances continues (Sloan, 2010b). Watch for more slow-cooker and wok-specific ingredients, e.g., La Tourangelle Pan Asian Stir Fry and Thai Wok Oils.
In 2010, there were more than 1.5 billion visits to food and recipe websites (Allrecipes.com, 2010). The top 10 search terms included, in descending order: cookies, chicken, chili, slow cooker, pork chops, salmon, meatloaf, banana bread, ground beef, and pasta salad (Allrecipes.com, 2010).
--- PAGE BREAK ---
Frozen ingredients have also become strong meal preparation aids; 72% of consumers have used packaged frozen prepared products to make dinner in the past three months (Packaged Facts, 2010a). Frozen chicken, fish, shellfish, and vegetables are among the top-selling meal components.
3. The Appeal of Americana
Americana, characterized by a diversity of factors ranging from local and farm-raised foods to American regional cuisines, will be among the most promising food industry trends over the next decade. As chefs and foodies rediscover the diversity of American cuisines/ingredients, interest in American regional cooking and food traditions will soar. Two-thirds (67%) of adults say they really enjoy American foods (GfK Roper, 2009).
Southern, American seaboard, and American barbecue are the leading American cuisines on restaurant menus in 2011, per the FoodService Research Institute’s MenuMine® database, which tracks 12 American regional cuisines. American spicy/hot, American barbecue, Pacific Northwest fare, and Southwestern are the fastest-growing (FSRIN, 2011).
Regional sandwiches and burgers, e.g., the Cheesecake Factory’s Memphis and Monterey Glamburgers, are becoming more mainstream on menus. Applebee’s introduced Bourbon Street Chicken & Shrimp, and Domino’s Pizza offers Wisconsin 6 Cheese and Honolulu Hawaiian pizzas. Betty Crocker Mississippi Mud Bars mix provides a decadent Southern dessert. Merita bread is “baked in the South for the South.”
Imagine the potential for regional variations on the top 10 comfort foods: chili, fried chicken, ribs, grilled cheese, macaroni and cheese, catfish, waffles, meatloaf, chicken fried steak, and pot roast (Datassential, 2009). Six in 10 American Culinary Federation (ACF) chefs cite inexpensive cuts of meat, e.g., brisket, pork shoulder, and skirt, as trendy for 2011 (NRA, 2010a).
America’s appetite for products that are locally grown, sold close to the farm, state branded, and/or grown/raised in the United States dovetails perfectly with the American regional culinary movement. Although only half (53%) of supermarkets offered locally grown, raised, or processed foods in 2010, 71% of shoppers bought them at least one to three times monthly (FMI, 2010). In specialty stores, local products enjoyed the second-largest sales gains overall, up 56% over 2009 (Wolfe, 2010). The magnitude of the marketing impact of these local or regional claims can be significant. For example, use of the descriptor “Alaska” on packaging increased likelihood of purchase with 76% of consumers (TRD, 2009).
In 2011, 87% of fine dining establishments, 63% of casual, and 59% of family dining restaurants offer locally produced products on the menu (NRA, 2011). ACF chefs ranked artisan cheese as the No. 1 hot ingredient for 2011; artisan/specialty bacon was No. 3. Artisan/homemade ice cream topped the list for trendy desserts. In the alcohol/cocktail category, artisan/micro-distilled liquor was at the top of the list, and regional signature cocktails were No. 7 (NRA, 2010a). “Un-aged” whiskey, also known as “moonshine,” is a new trend (Anon., 2010).
Farm-fresh, farmer’s market, and farm-grown claims have grown 80% on menus over the past three years (MMI, 2010). Nearly six in 10 consumers (58%) have shopped in a farmer’s market in the past year (Tanner, 2010a). Made, grown, or raised in the U.S. is an extremely appealing claim; only 30% of shoppers are very comfortable with food grown outside the U.S. (FMI, 2010).
--- PAGE BREAK ---
4. Foodie Focused
America’s 31 million foodies are blurring the aisles between specialty and everyday foods (Packaged Facts, 2009b). Two-thirds (67%) of consumers consider themselves knowledgeable and interested in food (Tanner, 2010a). Young adults ages 25–34 are by far the most likely to be foodies/foodie cooks; those ages 18–24 are the most likely to be true gourmets (Packaged Facts, 2009b).
Half (53%) of U.S. adults watch television cooking shows, on average, 4.2 hours per week (FMI, 2011). More than half (57%) have bought a food product as a direct result of a cooking show (Harris, 2010).
In 2010, the specialty food market bounced back; 63% of adults bought gourmet foods, up dramatically from 46% in 2009 and 56% in 2008 (Tanner, 2010a). Young adults—78% of those ages 18–24 and 74% of 25–34-year-olds—remain the top purchasers. Specialty food sales topped $63 billion in 2009 (Tanner, 2010b).
Regional ethnic tops the list of ethnic cuisines/flavors that will be trendy in 2011, according to ACF chefs. That is followed by ethnic fusion, Southeast Asian, Peruvian, and Latino American/Nuevo Latino (NRA, 2010a).
Ethnic cheeses, e.g., queso fresco, paneer, lebneh, halloumi, were cited by two-thirds of ACF chefs as hot ingredients for 2011 along with black garlic, ethnic condiments, soy sauce, flower syrups, flavored salts, and agave (NRA, 2010a). Fennel/peri-peri sauce, mustard seed/vermouth, and thyme/stone fruits are among McCormick’s top 10 flavor pairings for 2011 (McCormick, 2011).
With ACF chefs identifying newly fabricated cuts of meat (e.g., Denver steak, pork flat iron, and petite tender) as trendy entrees for 2011 along with nontraditional fish (e.g., branzino, Arctic char, and barramundi), expect the demand for these proteins to escalate in-store (NRA, 2010a). Gourmet hot dogs/sausages and burgers other than beef (e.g., buffalo/bison and veal) will provide additional gourmet appeal.
With ethnic barbecue, e.g., Korean, Argentinean, the top foodservice menu trend of 2010, and grilling on the rise, especially among Gen Yers, international barbecue sauces, e.g., Annie Chun’s CJ Korean BBQ Marinade & Sauce and finishing sauces, e.g., Stancato’s Italian Finishing Sauces in Piccata and Marsala, will gain in popularity (Technomic, 2010b).
Because Americans want to enjoy restaurant-style foods at home, one of the most successful strategies continues to be co-branding with restaurants. Cream of Wheat Cinnabon instant hot cereal and a line of frozen steam-in-the-microwave gourmet fish entrees carrying the Joe’s Crab Shack banner are some of the most recent examples.
--- PAGE BREAK ---
5. Get Real
In 2010, 39% of consumers, up 9% in one year, cited chemicals in foods as the most important food safety issue today vs 44% who cited concerns about bacteria, down 8% (IFIC, 2010).
Consumers believe limiting processed foods is among the most important components of healthy eating, right behind consuming vegetables and fruits (Mintel, 2009b). Half (50%) of consumers deliberately avoid preservatives, 49% avoid MSG, 47% artificial flavors, 44% colors/dyes, 43% growth hormones, and 29% genetically modified organisms (Hartman, 2010a).
Sales of foods/drinks formulated without preservatives topped $14.5 billion in 2009; sales of products with a natural claim reached $22 billion (Nielsen, 2010). The number of shoppers who say a no additive/preservative claim is very important rose 10% over the past two years (FMI, 2010).
Natural ingredients rank third on the list of most looked for items on the ingredient label, after type of fat/oil, and sweeteners. One in five shoppers (22%) look at the length of the ingredient list; 56% of U.S. companies shortened their ingredient list in 2009 (IFIC, 2010; Dornblaser, 2010). Beverage developers say that natural is the No. 1 need/interest state for 2011; only 7% of drink developers will not be using at least some natural flavors/colors this year (Zegler, 2011).
Natural claims now have greater appeal than organic. While consumers define them in a similar manner, natural claims are more strongly associated with no artificial flavors/color/preservatives (Hartman, 2010b). While cost is the top reason for fewer organic purchases, 38% of consumers now prefer locally grown foods instead; 32% see no difference between organic and nonorganic foods (FMI, 2010).
The number of new products carrying the word “simple” or “homemade” and/or having a see-through window on-pack is increasing (Innova, 2011). With 83% of shoppers saying food traditions are important to them, look for more family and farm names on foods, e.g., Mrs. Renfro’s Peach Salsa (Tanner, 2010a).
Fresher taste/texture claims are among the newest appearing on the best-selling products of 2009–10 (IRI, 2010a). Marketers of processed foods are now touting the use of “fresh,” “hand-picked,” and “fresh-from-the-field” ingredients in their products
The 2010 U.S. Dietary Guidelines for Americans will draw more attention to the healthful foods that many are not consuming enough of—low-fat milk products, dark green/orange vegetables, fruits, legumes, whole grains, nuts, seeds, vegetable oil, meat, poultry, fish, eggs, and soy products (USDA and HHS, 2010). Two-thirds (67%) of consumers think “a serving of fruit/vegetables” is a very import claim (IRI, 2010d). New varietals, e.g., Opal apples, heirloom produce varieties, and stronger-flavored options, e.g., Del Monte Extra Sweet Pineapple, are coming on strong. ACF chefs cited black/forbidden rice, quinoa, red rice, and vegetable pickles as trendy sides for 2011 (NRA, 2010a).
--- PAGE BREAK ---
6. The New Nutrients
Dramatic changes are afoot in the healthy food sector. Recent focus on natural functionality and inherent nutrition are beginning to shift interest away from traditionally fortified foods.
For the past 20 years, nine in 10 adults (88%) have believed it is very important to get their nutrients from foods that are naturally rich in vitamins/minerals vs 67% who consider it very important to get them from dietary supplements and 53% who have that perspective on fortified foods (HealthFocus, 2009).
While 65% of adults are still making a strong/some effort to eat more fortified foods, their number fell in 2010; 35% were not making any effort, up 7% over 2009. Consumers’ move toward products that are naturally high in vitamins/minerals and those that have been blended with other foods to create even higher nutrient levels, e.g., Campbell’s V-8 Fusion, which blends a variety of high-nutrient juices, has been credited with the declining interest in fortified foods (MSI, 2010a).
Consumers aren’t losing their interest in nutrients, however. Nearly half (46%) of food shoppers are very concerned about the nutrient content of their food, up 5% vs 2009 (FMI, 2010). Of the 67% who check nutrition labels, 32% look for vitamins/minerals on the ingredient list (IFIC, 2010).
Protein is among the “new nutrient” superstars. One in five adults (22%), and 38% of those ages 18–24, think protein is the most important component of healthy eating (Mintel, 2009b). Two-thirds 68%) of consumers believe protein helps build muscle, 40% say it helps them feel fuller, 37% believe it is helpful for weight loss, and 35% think it is important for aging well (IFIC, 2010).
The drive to reduce the sodium content of foods/beverages has spurred concern that Americans are not getting an adequate intake of potassium. Magnesium, the fastest-growing mineral supplement in the U.S., is now the third most popular ingredient in heart-healthy foods/drinks available globally (Innova, 2011). Calcium has fallen off the top 10 list of the most sought after health claims on food packages (FMI, 2010).
With the Federal Trade Commission/Food and Drug Administration challenging probiotic immunity claims, it is not surprising that consumers are refocusing on vitamin C, fiber/whole grains, and superfruits for immune-boosting support (MSI, 2008). Carotenoids and resveratrol are the latest phytochemicals to reach mainstream status; flavonoids and polyphenols remain strong mass market opportunities. Interest in antioxidants shows few signs of slowing down, with the exception of their link to heart health, which suffered from negative American Heart Assn. publicity (Sloan, 2011c).
Whole grains topped the list of the most sought after health claims on packages in 2010, followed by high fiber, low sodium, low fat, no trans fat, low sugar, low calorie, no chemical additives, no preservatives, and low/lowers cholesterol (FMI, 2010). Whole wheat bread outsold white bread in 2010 (IDDBA, 2011a).
The $46 billion market for lowfat products is being refueled by concern over saturated fat. More baby boomers avoid saturated fat than any other form of fat (Hartman, 2010b). Most exciting to those with an interest in public health, 30% of consumer are making an effort to include more healthy oils, e.g., olive, vegetable, canola, in their diet. While the addition of omega-6s will remain controversial for some time, health-promoting monounsaturated fatty acids (MUFAs) have quietly become a mass market opportunity for product developers (Sloan, 2011c).
Lastly, health is on the front burner at restaurants. Healthy menu items influenced 31% of diners’ selections in 2010 (Packaged Facts, 2010b).
--- PAGE BREAK ---
7. Specialty Treats
Despite U.S. consumers’ ongoing interest in healthful foods, meal preparers still serve dessert twice weekly on average (IDDBA, 2011). Chocolate candy, creamers, cookies, and wine were among the fastest-growing categories in food, drug, and mass merchandisers excluding Wal-mart in 2010 (IRI, 2011). Starbucks’ Via successfully repositioned instant coffee as a treat, bringing in $135 million in year-one sales (Jennings, 2011).
Mars’ Pretzel M&Ms ranked No.3 on the list of most memorable new products of 2010, followed by McDonald’s Real Fruit Smoothies at No. 5 and KFC’s Double-Down, a sandwich that uses chicken patties as a bun and is filled with cheese, bacon, and sauce, which was No. 7 on the list (Schneider, 2011).
The $10.4 billion in-store bakery business is holding its own amidst the economic downturn, posting substantial sales gains for cupcakes, individual-sized desserts, cookies, and brownies. Led by cakes, desserts accounted for 47% of bakery sales in 2010 (IDDBA, 2011a).
Tiered cakes with intricate fondants, bold/trendy colors, and lopsided stacking are among the cutting-edge bakery trends. Mainstream bakeries are adding ethnic treats, e.g., Mexican galleta and polvorones (cookies), Parisian macarons, and Asian tea cookies (IDDBA, 2011a).
With empty nesters and seniors the most likely to eat dessert, it’s not surprising that retro flavors including caramel, butterscotch, malt, and buttermilk, classic European indulgences like chocolate mousse and lemon chiffon pie, and dairy-based treats including sundaes, shakes, and floats are coming on strong (IDDBA, 2011a). Cheesecake, followed by chocolate, is the cake ordered most frequently away from home (IDDBA, 2011a).
The economy and high-end baking shows on television are driving a resurgence in home baking. But with only 41% of meal preparers describing themselves as experienced bakers, bread/bakery mixes and decorative toppings are enjoying brisk sales (MSI, 2009b). Watch for more restaurant-style, gourmet, and decadent mixes, e.g., Duncan Hines Triple Chocolate Cake with real chocolate chunks, oven-ready treats in their own baking trays, and microwavable decorative toppings.
Sugar-free and gluten-free are other fast-emerging baking mix directions. With the growing popularity of pies, Pillsbury has relaunched its Refrigerated Pie Crusts. Sales of frozen pies now outpace fresh bakery pies. Apple, pumpkin, pecan, banana cream, and cherry are America’s favorite pie flavors (Lempert, 2010). Cake category penetration in U.S. households is strong; fresh bakery cakes were purchased by 81% of consumers in 2010 (IDDBA, 2011a).
Ice cream/chocolate candy, cookies, and frozen novelties are the treats for which 55%, 37%, and 32% of consumers, respectively, are willing to pay a premium (IRI, 2010e). Mexican paletas (ice pops made from fresh fruit)and ice creams made from goat milk and coconut milk are newly popular delicacies.
Smoothies, juice blends, and “ades”—especially lemonades, were among the only gainers in the beverage industry last year (Sloan, 2011d). Expect refreshing and decadent signature drinks to continue to help differentiate restaurant chains, e.g., Taco Bell’s Frutista Freeze and Carl’s Jr.’s Chocolate Malted Crunch shakes and malts.
--- PAGE BREAK ---
8. Three Squares
Over the past two years, the number of adults eating three meals a day—with or without snacks—has increased to 44%, up 6% while those consuming only one to two meals a day plus snacks has decreased 36%, down 5%, (MSI, 2010b). In addition, 12% of consumers eat three meals a day and rarely/never snack, up 5%; 7% eat one meal a day plus snacks, down 5%; and 2% graze throughout the day, rarely eating a sit-down meal (MSI, 2010b).
Breakfast is the big beneficiary in the movement to three square meals a day. In 2010, consumers ate breakfast 5.3 days per week; 55% never skipped the morning meal (FMI, 2010). Three-quarters (74%) of breakfast eaters ate breakfast at home, up 8% vs two years ago; 85% did so on weekends (MSI, 2010c). While sales of breakfast foods grew 1.5% last year, frozen/refrigerated breakfast meals jumped 8.2%; pancake and waffle sales were down (Goldschmidt, 2011).
Breakfast is a multi-meal occasion for 27% of consumers; it is also becoming a multi-location occasion, with consumers eating a little something at home before leaving for work, picking up something from a drive-through on the way, and then taking a specialty coffee/snack break around 10 a.m. (NRA, 2010b). Morningstar Farms’ new Veggie Bacon, Egg & Cheese Biscuits offer a healthier, at-home option to fast food. Domino’s Breakfast Pizza, Subway’s Sunrise Subway Melt®, and Burger King’s mini blueberry biscuits are among the new breakfast restaurant entries.
As for the next daily eating occasion, consumers reported eating 5.7 lunch meals per week in 2010, with 3.7 of those lunches consumed at home; 55% of those polled said they never miss lunch (FMI, 2010). Among those who are not home for lunch, brown-bagging was the most popular option. More than half (58%) of full-time workers brought a lunch from home, up from 28% in 2007 (FMI, 2010).
More than one-third (35%) of in-home lunches include a sandwich (IDDBA, 2011b). Flatbreads (e.g., naan, pappadum, lavash, pita, and tortillas) are among the up-and-coming breads for 2011 (NRA, 2010a).
Teriyaki sauce is the most preferred innovative sandwich condiment, followed by avocado, sun-dried tomato, chipotle, sweet onion sauce, basil parmesan, roasted red pepper, pesto, pico de gallo, and Cajun.
A quarter (26%) of adults—and 31% of women—want more mini-sandwiches; 37% like to try unique sandwiches (Technomic, 2010c). Watch for ethnic handheld minis to grab the spotlight; these options include bocadillos, pupusas, torta, and tartines. Mainstream bakeries are adding Mexican bolillos (crusty sandwich bread), conchas (sweet breads), and Vietnamese banh mi sandwich breads (IDDBA, 2011a).
--- PAGE BREAK ---
9. Prescriptive Eating
Health issues are relatively commonplace within U.S. households; 52 million households have a member afflicted with muscle/joint pain, 51 million have a member with high cholesterol, 50 million high blood pressure, 49 million heartburn/indigestion, 23 million diabetes, and 17 million osteoporosis (IRI, 2010f).
Despite the prevalence of health problems, many people are not that eager to seek out medical attention. One-third (33%) of consumers plan on self-treating more and going to the doctor less in 2011 (IRI, 2011a). One-third (35%) of the 60% who bought functional foods did so to treat a specific health condition (Mintel, 2009a).
Consumers are very concerned about risk factors for disease. Sixty-eight percent of baby boomers were concerned about cholesterol and 66% were concerned about blood pressure; among Gen Y consumers, 40% were concerned about cholesterol and blood pressure (Hartman, 2010a).
What are consumers seeking in functional foods? Data from Mintel suggests that weight control and cholesterol lowering lead the list of most desired functional food benefits, cited by 64%, and followed by digestion 63%, immunity 60%, enhanced metabolism/blood pressure lowering 54%, satiety/healthy blood sugar levels 53%, and memory 47% (Mintel, 2009a).
Four in 10 adults (39%) are watching their weight (Packaged Facts, 2010c). From 2007 to 2010, the number of dieters making a strong effort to eat more protein rose 5% to 55%; those limiting carbs dropped from 39% to 33% (MSI, 2010d). In 2010, 63% of consumers made a serious effort to lower calories, 60% to reduce sugar intake (IDDBA, 2011a).
Eating smaller portions for weight loss has inched ahead of exercise/diet as the top weight control approach (MSI, 2010d). Blood sugar management and high-protein/body composition (formulated with conjugated linoleic acid) products are strong weight management platforms (Sloan, 2011c).
Currently, about half (48%) of adults use low-calorie sweeteners, the same percentage as in 2008. Awareness of the sweetener stevia reached 35% (MSI, 2010e). Concerns about artificial sweeteners remain significant; 44% of consumers avoid saccharin and aspartame, 32% avoid sucralose, and 22% avoid natural sweeteners other than sugar (Hartman, 2010a).
While the incidence of diabetes is exploding, targeting diabetics will likely meet with limited success. About half (46%) of diabetics modified their diet only slightly in 2009; 33% couldn’t maintain the recommended diet or guidelines (Diabetes Daily, 2010). Of the 54% of adults watching their diet, 23% do so for blood sugar, 15% because of diabetes (Mintel, 2009a).
While sales of gluten-free products reached $2.9 billion in 2010, only 15% of consumers intentionally bought a gluten-free product (Packaged Facts, 2011). More than half of those who bought such products didn’t know they were gluten-free (Hartman, 2011). Among the 15% of consumers who intentionally purchased gluten-free products, the reasons were varied: 46% believe gluten-free products are generally healthier; 36% see them as helpful for weight loss; 24% view gluten-free as an indicator of higher quality; 13% link them to benefits associated with addressing hyperactivity/autism. A relatively small percentage (12%) buy them for reasons linked specifically to gluten allergy/intolerance, and for 8%, the purchase is related to Celiac disease (Packaged Facts, 2011).
In 2011, beauty and anti-aging made the “hot list” for beverage developers for the first time (Zegler, 2011). Antioxidants’ association with skin and anti-aging continues to accelerate. Moreover, it appears that the age-old free radical message has not lost its luster (Sloan, 2011c).
--- PAGE BREAK ---
10. Home Rituals
Over the past three years, a tight economy has forced consumers to alter their everyday food and eating practices, and many of these behaviors are sticking. Consider, for example, the fact that 71% of consumers have brought snacks from home to movies and sporting events (IRI, 2010e). One in five consumers (20%) bring breakfast foods from home; 20% bring coffee and other beverages (MSI, 2010c).
Seventy-eight percent of all snacking now takes place in the home; 22% is away from home. Retail sales account for just over half (55%) of the $93.5 billion snack food market. Snack sales in restaurants continue to rise, however, accounting for 20% of all foodservice traffic in 2009 (Stachura, 2011).
Healthy snacks have continued to outpace their indulgent counterparts, gaining 8 share points over the past five years. Four in 10 consumers are looking for snacks that provide health benefits beyond basic nutrition (IRI, 2010e).
According to the Innovation Center for U.S. Dairy, “sweet bites” represent a significant snack market opportunity, followed by naturally nutritious snacks, new snacks with substantial crunch, p.m. meal replacement, and morning energy (Stachura, 2011).
The increased incidence of multi-tasking while eating is causing the demand for on-the-go handheld meals and snacks to accelerate; 37% of consumers seek snacks that can be eaten on the go (IRI, 2010e).
Energy shots have breathed new life into the ailing energy drink category. For Y/E 5/16/10, energy shots reached $755 million in sales, up 39%, seven times the growth rate of the energy drink sector (Rouan, 2010). One in five consumers (21%) are regular energy drink users, including 43% of those ages 18–24 and 36% of those 25–34; 9% of consumers use energy shots (Mintel, 2010). Government concerns about the healthfulness of energy products and the anticipated decline in the teen population will pose hurdles for this fast-growing category.
Supplying 20% of all take-out meals, supermarkets are experiencing their strongest year in six years as a source for ready-to-eat takeout and heat-and-eat meals, product categories that are of interest to 55% and 47% of shoppers, respectively (FMI, 2010).
Home entertaining has become a new way of life; 67% of consumers are spending more time at home with their family, and 44% entertained family/friends at home instead of going out in 2010 (IRI, 2010d). The last time they entertained at home, 63% served snacks, 54% celebrated a special occasion, 52% had alcoholic beverages, 48% had a casual meal/buffet, and 46% had a sit-down dinner (GfK Roper, 2009).
One in five shoppers (19%) feel it is worth paying more for gourmet snacks for entertaining (IRI, 2010e). One-third (34%) of consumers buy specialty foods when entertaining (Tanner, 2010a).
--- PAGE BREAK ---
Take-out, frozen foods, and appliance cooking are all acceptable for entertaining. The tray for Chef Solutions Meatball Appetizers from Orval Kent is designed to be placed in a slow cooker. Social catering is projected to be one of the fastest-growing foodservice segments in 2011, up 6.2% (NRA, 2011).
Lastly, despite their hectic lifestyles consumers have yet to embrace e-grocery commerce. Online sales of groceries accounted for only 2% of total grocery sales in the U.S.; 13% of shoppers ordered groceries online during the past year; only 38% say their store offered online ordering in 2010 (FMI, 2010).
A. Elizabeth Sloan, Ph.D., a Professional Member of IFT and Contributing Editor of Food Technology, is President, Sloan Trends Inc., 2958 Sunset Hills, Suite 202, Escondido, CA 92025 ([email protected]).
References
ADA. 2010. Nationwide survey on family eating behaviors. Press release, Nov. 9. American Dietetic Assn. Chicago, Ill. www.eatright.com.
Allrecipes.com. 2010. The monthly measuring cup. Dec. www.allrecipes.com.
Anon. 2010. Beverage trends. Nation’s Restaurant News 44(26): 26.
Datassential. 2009. Nation’s Restaurant News 43(9): 26.
Diabetes Daily. 2010. Survey fi nds more people with diabetes to follow dietary plans in 2010. Press release, Jan. 29. www.diabetesdaily.com.
Dornblaser, L. 2010. Simple ingredient statements: Clear language for confused consumers. Presentation at Ann. Mtg. of Institute of Food Technologists, Chicago, Ill. July 17-20.
Dudlicek, J. 2011. Stunted growth? Progressive Grocer 90(2): 40, 43.
FMI. 2010. U.S. grocery shopper trends. The Food Marketing Institute, Washington, D.C. www.fmi.org.
FMI. 2011. The power of meat.
FSRIN. 2011. MenuMine. Foodservice Research Institute, Oak Park, Ill. www.foodserviceresearchinstitute.com.
GfK Roper. 2009. Teleconference survey. Jan. GfK Roper, New York, N.Y. www.gfkamerica.com.
Goldschmidt, B. 2011. Off to a healthier start. Progressive Grocer 90(2): 48, 50, 52.
Harris. 2010. Cooking at home. May. Harris Interactive, New York, N.Y. www.harrisinteractive.com.
Hartman. 2010a. Reinventing health & nutrition. The Hartman Group. Bellevue, Wash. www.hartman-group.com.
Hartman. 2010b. Beyond organic and natural.
Hartman. 2011. Gluten-free. Hartman Salt.
HealthFocus. 2009. U.S. consumer trend survey. HealthFocus International, St. Petersburg, Fla. www.healthfocus.com.
IDDBA. 2011a. Consumers in the bakery. March. International Dairy, Deli, Bakery Assn., Madison, Wis. www.iddba.org.
IDDBA. 2011b. Consumers in the deli. March.
IFIC. 2010. Food & heath survey. International Food Information Council, Washington, D.C.
Innova. 2011. Innova Market Insight Database. www.innova-food.com.
IRI. 2009. The baby boomer II report. July. SymphonyIRI Group, Chicago, Ill. www.infores.com.
IRI. 2010a. 2009 New product pacesetters. Times & Trends.
IRI. 2010b. The low income report. Nov.
IRI. 2010c. Center store. Times & Trends, Nov.
IRI. 2010d. Consumer expectations. Oct.
IRI. 2010e. State of the industry 2009. Presented by Sally Lyons Wyatt at SnaxPo, Snack Food Assn. Annual Meeting, March.
IRI. 2010f. Over-the-counter medications. Nov.
IRI. 2011. CPG 2010 year in review. Times & Trends, Feb.
Jennings, L. 2011. Shelf life. Nation’s Restaurant News 44(26):1, 10, 12.
Lempert, P. 2010. Sales growth ‘easy as pie,’ for some. Facts, Figures & the Future, June. www.factsfiguresfuture.com.
McCormick. 2011. McCormick fl avor forecast. Press release, Dec. 2. McCormick & Company Inc. Hunt Valley, Md. www.mccormick.com.
Mintel. 2009a. Functional food—U.S. August. Mintel International Group Ltd., Chicago, Ill. www.mintel.com.
Mintel. 2009b. Attitudes towards food: Weight and diet—U.S. May.
Mintel. 2010. Energy Drinks & Shots—U.S. July.
MMI. 2010. Mintel Menu Insights.
MSI. 2008. The Gallup study of immune defense. Multi-Sponsor Surveys, Princeton, N.J. www.multisponsor.com.
MSI. 2009a. The Gallup study of dinner.
MSI. 2009b. The Gallup study of cooking knowledge & skills.
MSI. 2010a. The 2010 Gallup study of nutrient knowledge & composition.
MSI. 2010b. The 2010 Gallup study of American snacking behavior.
MSI. 2010c. The Gallup study of breakfast. MSI. 2010d. The 2010 Gallup study of weight management.
MSI. 2010e. The 2010 Gallup study of sweetener preferences.
Nielsen. 2010. U.S. Healthy eating trends: part 1. Press release, Jan. 26. The Nielsen Co., Schaumburg, Ill. www.nielsen.com.
NPD. 2009. Generational diff erences, aging dynamics to infl uence future of eating study. Press release, Dec. 3. The NPD Group, Port Washington, N.Y. www.npd.com.
NPD. 2011. U.S. consumers brace for higher food and gas cost. Press release, Jan. 19.
NRA. 2010a. What’s hot chef survey. National Restaurant Assn., Washington, D.C. www.restaurants.org.
NRA. 2010b. Operators survey. Oct.
NRA. 2011. 2011 Restaurant industry forecast.
Packaged Facts. 2009a. Functional food in the U.S. Packaged Facts, New York, N.Y. www.packagedfacts.com.
Packaged Facts. 2009b. Foodies in the U.S.: Five cohorts: Foreign/spicy, restaurant, cooks, gourmet and organic/natural. Jan.
Packaged Facts. 2010a. Convenience frozen foods in the U.S. Dec.
Packaged Facts. 2010b. The U.S. foodservice landscape.
Packaged Facts. 2010c. Weight management trends in the U.S. Feb.
Packaged Facts. 2011. Gluten-free foods & beverages in the U.S. Feb.
Perishables Group. 2010. Fresh-cut produce in the U.S.A. Presented by Beth Padera at inhouse client meeting, Oct. 8. The Perishables Group, Chicago, Ill. www.perishablesgroup.com.
PLMA. 2011. Private Label Manufacturer’s Association. New York, N.Y. www.plma.com.
Rouan, R. 2010. Leveling the fi eld. Beverage Industry 101(8):14, 16, 18.
Schneider, J. 2011. The most memorable product launches of 2010. Press release, Jan. 21. Schneider Associates, Boston, Mass. www.schneiderpr.com.
Sloan, A.E. 2010a. Bridging generational food divides. Food Technol. 64(7): 34-47.
Sloan, A. E. 2010b. Consumers are big fans of small appliances. Food Technol. 64(5): 18.
Sloan, A. E. 2011a. Not too basic. Food Technol. 65(2): 21.
Sloan, A. E. 2011b. The new American family. Food Technol. 65(1): 22-31.
Sloan, A.E. 2011c. TrendSense™ model report. Sloan Trends Inc. Escondido, Calif. www.sloantrend.com.
Sloan, A.E. 2011d. What’s next in beverages. 65(3): 19.
Stachura, L. 2011. Get your share of snack time. Food Product Design Webinar. March 3.
Tanner, R. 2010a. Today’s specialty food consumer. Specialty Food Magazine 40(8): C2-C16.
Tanner, R. 2010b. The state of the specialty food industry 2010. Specialty Food Magazine 40(3): 3A-16A.
Tarnowski, J. 2011. Meat to meals. Progressive Grocer 90(1): 83-87.
Technomic. 2010a. 2010 Generational consumer trend report. Technomic Inc., Chicago, Ill. www.technomic.com.
Technomic. 2010b. Top foodservice trends 2010.
Technomic. 2010c. The sandwich consumer trend report.
Thomas, M. 2011. The infl uential ethnic consumer. Specialty Foods 41(1): 5.
TRD. 2009. Alaska seafood survey. TRD Frameworks, Seattle, Wash. www.trdframeworks.com
U.S. Census. 2010. www.census.gov.
USDA and HHS. 2011. Dietary guidelines for Americans 2010. U.S. Dept. of Agriculture and U.S. Dept. of Health and Human Services. www.dietaryguidelines.gov.
Wolfe, A. 2010. State of the gourmet retail market 2010. Gourmet Retailer 31(9): 12, 15, 16.
Zegler, Jennifer. 2011. New product development survey. Beverage Industry. 102(1):52-54, 56, 58-60, 62.