
The New American Family
Families with children comprise an influential segment of the U.S. population, and understanding their cooking patterns, health concerns, and dining out preferences is critical to effectively targeting them.
Welcome to the next generation of the American family—more ethnically diverse, cash-strapped, cuisine-savvy, and health-concerned than ever before. With new attitudes, lifestyle priorities, and product demands, today’s families offer a plethora of lucrative market opportunities for those food manufacturers who truly understand their fast-emerging needs.
 The more children there are in a household, the more likely its members are to cook at home, use pre-packaged convenience foods, and cut back on restaurant visits. Households with kids are among the most likely to entertain at home, to cook as a hobby, and to brown bag meals/drinks.
With Gen X (ages 35–44) and Gen Y (ages 18–34) parents being integral players in today’s foodie movement, expect all flavor and food forms to be kicked up a notch. Their penchant for freshness and cleaner labels will put more pressure on food marketers to reduce the use of additives/ preservatives and to lower sugar/sodium levels and will drive a strong demand for more minimally processed foods.
Moreover, they’ll force food marketers to enter the digital age. Moms in households with kids are among the heaviest bloggers/social networkers and the most likely to go online for recipes/cooking tips as well as key users of e-coupon websites.
It’s going to be a different food world out there, and this article is designed to be a guide to the new culinary, health, and restaurant behaviors shaping the food choices of tomorrow’s family.
Exploring Family Ties
The 35.7 million U.S. households with children under age 18 rank third behind empty nesters and singles as America’s largest household units. Married couples head 25.1 million households with kids, single moms head 8.3 million, and single dads 2.1 million. Among households with kids younger than 18, 79% have one or two children, and 21% have three or more (U.S. Census, 2010).
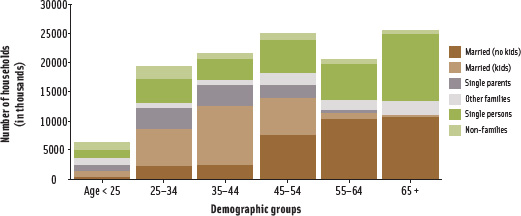 With the median marriage age rising to 28.2 for men and 26.8 for women in 2010, the majority of parents with children under age 18 at home now fall into the Gen X age group. Among Gen Y households, 49% have children under age 18 at home. With Gen X households, 65% have kids under 18; 26% of baby boomer (ages 45–64) households have them (U.S. Census, 2009). (See Figure 1 for an overview of the way in which U.S. households break out by age group.)
--- PAGE BREAK ---
While 25 million households with children are headed by married couples, the rise in the number of single parents contributes to the fact that a growing number of families are strapped for both time and cash. A third of all families with children (13.4 million families) have income less than twice the federal poverty line, meaning that affordable family meals are in great demand (Urban Institute, 2010). In 2010, 23% of married couples with kids have a stay-at-home mom, up from 21% in 2000 (U.S. Census, 2010).
Households with children and incomes less than $35,000 are key category drivers for yogurt, frozen pizza, natural cheese, salty snacks, crackers, ready-to-eat cereal, frozen dinners, and chocolate candy (IRI, 2010a). From a health standpoint, they are most motivated by whole grains/fiber; reduced sodium/calories/fat/sugar; fortified/protein-enriched products; and natural/unprocessed foods.
Two new megatrends are also reshaping American families’ food buying behaviors. First, 21 million older children, mostly males over age 24, have returned home to live, affecting 12 million households. Secondly, multi-generational households now number 49 million; one in 10 kids under age 18 lives in a household that includes a grandparent. Hispanics (22%), blacks (23%), and Asians (25%) are significantly more likely than average to live in multi-generational family households (U.S. Census, 2010).
With just about 4.3 million babies born in 2007 and another 4.2 million born in 2008, America seemed to be experiencing the largest baby boom in its history. However, in 2009 and 2010, the recession caused a slowdown in the birth rate. An estimated 4.1 million babies were born in the United States in 2009, a 2.6 percent drop from 2008, according to the National Center for Health Statistics. Despite the slowdown, by 2015, the number of kids under age 5 is projected to grow 9% over 2005. The number of those ages 6–11 will increase by 8.5%, and the number of those ages 12–17 will fall 4.0% (U.S. Census, 2005). In addition, it is predicted that the number of babies born in the U.S. in 2010 will for the first time include more minority babies than white babies. One in four babies born in the U.S. today is Hispanic (U.S. Census, 2010).
In 2010, there were 72.5 million kids under age 18 in the U.S. That total breaks out as follows: 20 million under 5 years of age; 19.5 million ages 5–9; 20.2 million ages 10–14; and 12.8 million ages 15–17. Moreover, they are more ethnically diverse than ever before. For example, in 2010, there were 15.1 million white children under age 5, 4.1 million Hispanic children, 3.5 million black children, and 1.2 million Asian children (U.S. Census, 2010).
When it comes to targeting new moms, keep in mind that they’re likely to be older, more educated, unmarried, and nonwhite. Consider the following statistics about new moms: 14% are age 35+; 47% are nonwhite; 41% are unmarried; and 54% are likely to have some college education. Married women ages 25–34 have the highest birth rates; the average age at the birth of a first child is now 26 (Pew Research, 2010).
--- PAGE BREAK ---
Home Time
For the majority of American families, the evening meal is now prepared at home an average of five times per week; the other two nights are equally divided between eating out and ordering in/picking up take-out (FMI, 2010a). Two-thirds (65%) of households with children are preparing more dinners at home now than they did last year; 90% of consumers think eating at home is healthier (FMI, 2010a).
Although, in a recent survey, half (49%) of meal preparers in family households reported making last night’s meal from scratch (i.e., primarily with fresh ingredients and no mixes), those in households without kids were more likely to do so and to use frozen or heat-and-serve foods (MSI, 2009).
Family households, however, are significantly more likely to use prepackaged convenience foods to prepare dinner—38% vs 20% in households without kids (MSI, 2009a). Young Gen Y parents are twice as likely to use the microwave oven to prepare foods as those their age without kids (Campbell’s, 2010).
But with today’s Gen Y and Gen X parents most likely to be classified as foodies and having the highest interest in ethnic, spicy, and gourmet foods, they’ll be looking for products that more directly deliver restaurant-style foods and flavors (Packaged Facts, 2009). For example, while Gen Yers are much more likely to buy very convenient meal kits, they are quickly gravitating to ethnic and upscale kits, e.g., Simply Asia or Wanchai Ferry.
Moreover, these parents have created the first generation of “foodie children,” and children’s food products need to be upgraded accordingly. More than half (52%) of kids ages 6–17 sometimes get to try new foods; that is always the case for 45% (Mintel, 2008). More than nine in 10 parents serve ethnic foods at home (Gallup, 2009).
The most popular ethnic or regional cuisines eaten by all kids are Chinese (57%), Mexican (55%), Italian (41%), and barbecue (37%) (Technomic, 2009). There are notable differences by ethnicity. Consumption of sushi is much higher among Asian and Hispanic kids, for example. Not surprisingly, Asian kids are much more frequent eaters of Japanese food (33%), noodles (37%), and Thai foods (19%).
But while two-thirds of moms plan to make easy-to-prepare meals at home more often this year, one-third (34%) also plan to cook more elaborate meals (WMR, 2010). With the penchant among Gen X and Gen Y consumers for fresh, globally flavored, restaurant-quality meals, products that assist with the preparation of more gourmet meals (spice rubs/blends, ethnic sauces, marinades, seasoned rice mixtures, etc.) rather than replace a specific menu item will be in high demand. You might say that brands that can act as sous chefs (vs acting as full-service chefs) will be able to capitalize on this new market opportunity.
Moms are more likely than other demographic segments to cook for fun; thus, products that facilitate greater interaction with their kids will find a welcome market. Moreover, mothers are among the most likely to embrace occasion-based cooking and to use gourmet foods for at home celebrations, e.g., birthdays and holidays (Mintel, 2008a).
Three-quarters (74%) of those ages 18–34 and two-thirds (67%) of those 35–44 are regular specialty store/specialty aisle shoppers (NASFT, 2010). With such ethnic diversity in today’s young families, ethnic and family food traditions will likely become even more important; 83% of specialty consumers feel food traditions are important (NASFT, 2010).
--- PAGE BREAK ---
Retailers can play an essential role in helping today’s home cooks: 49% of family shoppers want to receive easy-to-make recipes; 43% are looking for recipes for cooking a family dinner for $10 or less; and 23% want convenient placement in the store for the components of an entire dinner (FMI, 2010a).
Kid-friendly recipes and cooking instructions are also important. Two-thirds (67%) of kids ages 6–11 and 93% of those 12–17 prepare their own meals at home (Mintel, 2008b). Nine in 10 kids (87%) use the microwave; 85% make cold food, e.g., sandwiches; 65% use the toaster; 46% prepare foods on the stovetop; and 34% bake or cook food in the oven (Mintel, 2009a).
Lastly, with two-thirds (65%) of families sitting down together for dinner and 50% gathering for breakfast five days a week, family-sized products targeted to households greater than four persons would help to fill a major market void (MSL, 2010).
Kids’ Picks
About half of meal preparers in households with kids served a meat, poultry, or fish/seafood entrée for a typical week’s dinner last year, slightly less frequently than households without children (Gallup, 2009). Chicken/turkey, followed by burgers, steak/beef roast, pork, hot dogs, and meatloaf were served by at least one in five family households.
Households with three or more children are significantly more likely than either one-to-two-child families or no-child households to serve a side salad; a rice, potato, stuffing, or pasta side dish; bread, biscuits, or rolls; and dessert, perhaps reflecting the tendency toward more scratch cooking, the need to “fill up” in larger families, and more importantly, the limitations of packaged dinners/kits that serve only 4 family member (Gallup, 2009).
More than half (55%) of parents with kids ages 6–15 say they have a problem trying to get their children to eat more fish and seafood, about the same percent as those trying to get them to eat more fruits and vegetables (FMI, 2008). New SeaPak Popcorn Fish might be a great solution.
Households with children are significantly more likely to eat pasta, macaroni, casseroles, and pizza for dinner than households without (Gallup, 2009). Soup, sandwiches, vegetarian entrees, stir-fry meals, and appetizers were eaten for dinner in less than 10% of households with kids (Gallup, 2009). The percentage of adults who eat soup is twice that of kids; teens are less likely to eat soup than kids ages 6–12 (Mintel, 2010).
The vast majority of kids (84%) consume pizza at least once a month. More than three-quarters of kids also eat French fries, cheese, and sandwiches one or more times a month; just over half have a taco (55%) or a salad (53%) in that timeframe (Technomic, 2009).
When children between the ages of 6 and 12 were asked to pick their own meal with an entrée, side dish, dessert, and drink, chicken fingers/nuggets was kids’ most popular entrée choice, followed by pizza, and then burgers. Steak, spaghetti, pasta, and shrimp were among the contenders in the 10-to-12-year-old group (Technomic, 2009). French fries and macaroni and cheese were the most popular sides. Those older than age 9 were more likely to choose a fresh fruit side; kids ages 10–12 were more likely to choose a side salad. Corn on the cob is another universal kids’ favorite.
--- PAGE BREAK ---
Yogurt, potato chips, fresh fruit, string cheese/pre-packaged cheese/cheese cubes, hard candy, ice cream pops, chewy candy, corn chips, donuts, and snack pies make the list of the top 10 fastest-growing snacks among kids ages 2–17 (NPD, 2010). Parents’ wish list for children’s snacks includes more nutrients (59%), controlled portion sizes (57%), fresh/not processed (44%), lower fat (37%), and lower calories (32%) (IRI, 2010b).
Kids report that the beverage they drink most frequently is milk (85%), followed by fruit juices (80%), bottled water (72%), regular soda (62%), sports drinks (41%), iced tea (34%), diet soda (23%), hot chocolate (22%), and vitamin water (17%). When asked to choose any drink for a meal, the majority of kids across all age groups would choose soda. Younger kids still have a strong desire for milk and fruit juice, but it tapers off once they reach double-digit age (Technomic, 2009).
More than one-third (35%) of teens drink energy drinks; Hispanic teens are the heaviest consumers. Households with kids are heavier users of energy drinks and lower consumers of alcoholic beverages than households with no children (Mintel, 2009b).
Daily Dining Dynamics
Eight out of 10 moms report that their preteen child typically eats weekday breakfasts at home; 15% do so at school/day care (Gallup, 2008). Half (50%) of households with children eat breakfast together five days a week (MSL, 2010). Four in 10 Caucasian and Hispanic kids under age 17 (42%) don’t eat breakfast all the time; for blacks, the percentage is 59% (ADA, 2010).
Well over half of kids most often buy or get their lunch at school (Technomic, 2009). However, 72% of moms prepare school or work lunches at least once a week at home, and close to half (46%) do so four or more days a week. In 2010, 42% of moms said they planned to prepare lunches at home more often (WMR, 2010). One-third (34%) of parents put foods in their kids’ lunch box that the kids prefer vs serving nutritious items (FMI, 2010a).
Only one-quarter of kids ages 10–12 say they have access to a vending machine at school; vending machines are accessible at school to 10% of kids ages 8–9 and 8% of those ages 6–7. Fruit juices are the most purchased vended drink, cited by 38% of kids polled, followed by bottled water (37%), regular soda (34%), and sports drinks (29%). Candy bars, cookies, gum, fruit snacks, pretzels, popcorn, and trail mix are the most popular vended snacks (Technomic, 2009).
Although four out of 10 moms report their family is visiting restaurants less often than a year ago, most kid-dining occasions take place at quick-service restaurants (QSRs). Moms are about five to six times more likely to order from a fast-food restaurant once a week or more (45%) than fast casual (9%), casual dining (8%), or family-style (6%) eateries. African-American and single moms are the heaviest QSR users (Technomic, 2009).
Eight in ten moms (80%) visited McDonalds, followed by Burger King (51%), Taco Bell (40%), Subway (38%), Wendy’s (36%), KFC (32%), Arby’s (23%), and Pizza Hut (23%). To the list of kids’ top QSR choices, add Chick-Fil-A, Dairy Queen, Sonic, and Domino’s (Technomic, 2009). Applebee’s, Chili’s, IHOP, Olive Garden, and Denny’s are the full-service restaurants most frequented by moms and kids. Chuck E. Cheese is kids’ favorite full-service restaurant choice (Technomic, 2009).
The most popular types of lunch and dinner entrées on kids’ menus are pasta, sandwiches, and chicken. The most notable entrée trend is the growth of pasta and noodle items for kids; this entrée group pushed past chicken entrées and sandwiches to become the most frequently menued entrée for kids at full-service chains (Technomic, 2009).
American Culinary Federation chefs named nutritionally balanced children’s dishes as the top kids’ restaurant meal trend for 2010, followed by fruit/vegetable kids’ side items, “kid cuisine” (gourmet children’s dishes), children’s entrée salads, ethnic-inspired children’s dishes, and fun-shaped kids foods (NRA, 2009).
--- PAGE BREAK ---
Marketers should keep in mind that families with children like to socialize; more than half (56%) of parents with kids under age 18 entertain at least once a month; 21% of parents entertained more at home last year than in 2008 (GfK Roper, 2009). Households with kids are more likely to have a potluck meal, use convenient devices (e.g., slow cooker), or serve takeout or easily prepared microwaveable food to their guests (GfK Roper, 2009). Party-sized fare beyond lasagna and deli/appetizer platters—especially items with kid appeal—represent a big unmet need in the marketplace.
Happy About Healthy
More than one-third (37%) of mothers report that they are very satisfied with the healthfulness of their child’s diet (Gallup, 2010). Although half (49%) of shoppers with children think the foods they eat at home could be somewhat healthier, 29% think they’re healthy enough (FMI, 2010a).
Four in 10 shoppers with children (38%) are very/extremely concerned about the nutrient content of the foods they eat (FMI, 2010a). Four in ten parents with kids ages 6–18 (41%) admit that ensuring their children eat a nutritious diet is either a big problem (11%) or somewhat of a problem (30%) (FMI, 2010a). Six out of 10 families are practicing some form of healthy eating strategy. Their approaches include trying to eat more fruits/vegetables, whole grains, and low-fat dairy; limiting trans fats and sugar; reducing portion sizes and limiting second helpings; eating more seafood; and ordering healthier options when eating out (FMI, 2008).
One-third of mothers (34%) feel that their child’s taste preferences get in the way of good nutrition a lot, followed by 24% who are concerned about ads that target kids, 22% who are concerned about the higher prices of healthy food, and 21% who are concerned about the availability of too much junk food (Gallup, 2010). On an unaided basis, moms said their biggest problems with their kids’ nutrition are too much sugar and too few fruits/vegetables (Gallup, 2010).
Parents are slightly less likely to say they are extremely satisfied with the healthfulness of their children’s meals vs last year, especially when it comes to breakfast and dinner, thus increasing the majority who are only somewhat or not satisfied (FMI, 2010b).
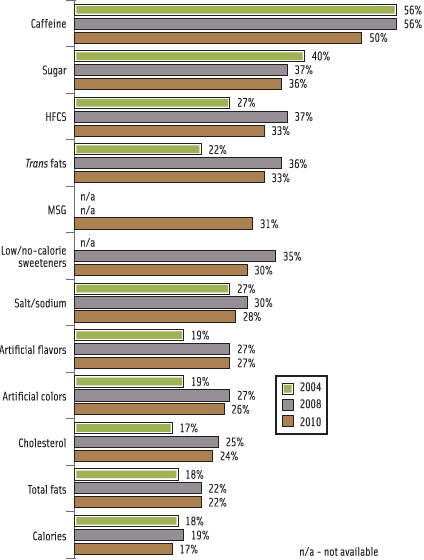 Mothers’ strongest dietary efforts in terms of limiting what their children consume are directed toward caffeine. In addition, one-third or more of moms are making strong efforts to limit sugar, high fructose corn syrup, trans fats, MSG, and low-/no-calorie sweeteners (Figure 2, Gallup, 2010).
About one-third of mothers report strong efforts to increase their child’s consumption of calcium, vitamins/minerals, whole grains, and protein. Compared to 2008, there has also been a significant increase in efforts to get more probiotics/prebiotics into the diet (Gallup, 2010). The attributes moms most look for in foods for kids under age 3 include low/no sugar (68%), all natural (55%), fortification with DHA, iron, etc. (42%), and organic (21%) (Angrisani, 2010).
--- PAGE BREAK ---
With the incidence of high blood pressure tripling in children, one in eight children already afflicted with two or more risk factors for heart disease, and pediatricians now measuring blood pressure in children at age 3, sodium levels in children’s foods will clearly come under greater scrutiny (AHA, 2010). Two-thirds (68%) of North American moms say they are very concerned about protecting their children from diseases later in life (HealthFocus, 2009).
In addition, with 38% of Gen Yers and one-quarter of Gen Xers citing protein as the most important component of healthy eating—right behind eating more vegetables/fruits and less processed foods—expect young parents to further embrace protein as a vital part of their healthy eating plans (Mintel, 2009c).
Lastly, 45% of parents with kids ages 12 and under agree there should be stricter guidelines regarding the nutritional content of kids’ menu options at restaurants; 42% of those with kids ages 13–18 feel that way (Technomic, 2009). So clearly it is important for product developers to factor health into the product development equation for both packaged foods and food-service fare.
A. Elizabeth Sloan, a Professional Member of IFT and Contributing Editor of Food Technology, is President, Sloan Trends Inc., 2958 Sunset Hills, Suite 202, Escondido, CA 92025 ([email protected]).
References
ADA. 2010. Family nutrition and physical activity survey. Nov. American Dietetic Assn., Chicago, Ill. www.eatright.org.
AHA. 2010. Statistics. American Heart Assn., Dallas, Texas. www.americanheart.org.
Angrisani, C. 2010. Baby steps. Supermarket News 58(10): 29-30, 33.
Campbell’s. 2010. Campbell’s Kitchen. Campbell Soup Company, Camden, N.J. www.campbellsoup.com.
FMI. 2008. Shopping for health. Food Marketing Institute, Arlington, Va. www.fmi.org.
FMI. 2010a. U.S. grocery shopper trends.
FMI. 2010b. Shopping for health.
Gallup. 2008. Study of pre-teen nutrition & eating trends. Gallup, Washington, D.C. www.gallup.com.
Gallup. 2009. Study of dinner trends.
Gallup. 2010. Study of children’s nutrition & eating habits.
GfK Roper. 2009. Teleconference survey. Jan. GfK Roper, New York, N.Y. www.gfkamerica.com.
Healthfocus. 2009. U.S. trend study. HealthFocus Intl., St. Petersburg, Fla. www.healthfocus.com.
IRI. 2010a. Lower income shopper report. SymphonyIRI, Chicago, Ill. www.symphonyiri.com.
IRI. 2010b. State of the snack food industry. Presented at Snaxpo, Fort Worth, Texas, March.
Mintel. 2008a. Cooking enthusiasts—U.S. June. Mintel International, Chicago, Ill. www.mintel.com.
Mintel. 2008b. Kids and teens eating habits—U.S. Sept.
Mintel. 2009a. Ready meals—U.S. July.
Mintel. 2009b. Energy drinks and shots—U.S. July.
Mintel. 2009c. Attitudes towards food: Weight and diet—U.S. May.
Mintel. 2010. Soup—U.S. Jan.
MSI. 2009a. Gallup study of dinner. MultiSponsor Surveys, Princeton, N.J. www.multisponsor.com.
MSL. 2010. Martha Stewart Living Omnimedia survey. July 15. Martha Stewart Omnimedia Inc., New York, N.Y. www.marthastewart.com.
NASFT. 2010. The 2010 specialty foods consumer. National Assn. for the Specialty Food Trade, NewYork, N.Y. www.specialtyfood.com.
NPD. 2010. Yogurt, potato chips, and fresh fruit among top growing snack foods for kids. Press release, May 11. The NPD Group Inc., Port Washington, N.Y. www.npd.com.
NRA. 2009. What’s hot survey. National Restaurant Assn., Washington, D.C. www.restaurant.org.
Packaged Facts. 2009. Foodies in the U.S.: Five cohorts: foreign/spicy, restaurant, cooks, gourmet, and organic/natural. Jan. Packaged Facts, Rockville, Md. www.packagedfacts.com.
Pew Research. 2010. The demography of American motherhood. Pew Research Center., Washington, D.C. www.pewsocialtrends.org.
Technomic. 2009. Kids and moms consumer trend report. Technomic Inc., Chicago, Ill. www.technomic.com.
Urban Institute. 2010. Families and parenting. Urban Institute, Washington, D.C. www.urban.org.
U.S. Census. 2005. Annual projections by single year of age. U.S. Census Bureau, Population Div., Washington, D.C. www.census.gov.
U.S. Census. 2009. Households, by type, age of members, region of residence, and age of householder.
U.S. Census. 2010. America’s families and living arrangements: 2010. Press release, Nov. 11.
WMR. 2010. Dining survey. Why Moms Rule, Nashville, Tenn. www.whymomsrule.com