
Salaries Back on Track
With its exclusive and robust data, the 2013 IFT Employment & Salary Survey sheds new light on compensation, benefits, stress, and job satisfaction among food scientists.
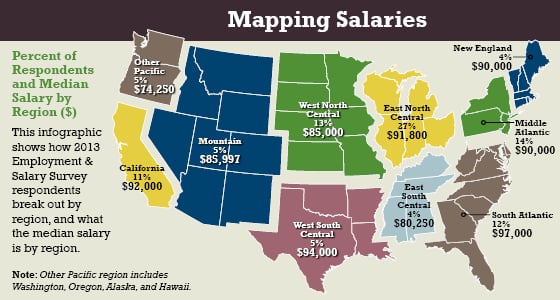
After a small dip in 2011, salaries for food scientists have bounced back. U.S. members of the Institute of Food Technologists earned a median salary of $90,000 last year, according to the 2013 IFT Employment & Salary Survey. That total was up 3.4% from the 2011 survey, which included the time frame just after the recession of 2007–2009. In 2011, the median salary dropped slightly to $87,000 from $87,700 in 2009, a minor blip in an otherwise steady stream of increases. (See Table 1 for an overview of the 2013 data compared with 2011 data and Table 2 for more details on 2013 median salaries and bonuses.)
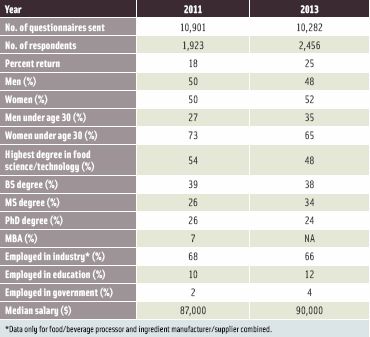
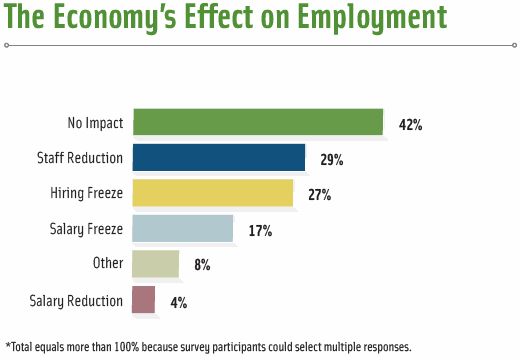
Responses to the wide-ranging survey suggest that the economic climate is taking less of a toll on food science and technology careers than it did two years ago. In 2013, 42% of survey respondents stated that the economy has had no impact on employment within their organizations. The share of those who reported staff reductions (29%) and hiring freezes (27%) in 2013 was down slightly from 2011’s staff reduction (30%) and hiring freeze (31%) totals. In addition, in 2013, 17% reported salary freezes vs 20% in 2011. (See Figure 1 for a full breakout of the economy’s effect on employment in 2013).
Recruiters See Modest Market Growth
Executive recruiters who focus on food science positions noted that they’ve seen recent improvements in the employment scene but added that the changes are incremental.
“The market, I think, is pretty healthy overall,” said recruiter Scott Wellington, President, Wellington Executive Search, Marietta, Ga., who specializes in filling sales and technical jobs for food and pharmaceutical companies. “There seems to be a little bit of uptick. If you’re a good employee and you’ve got a good background, I think you’ve got the upper hand right now.” Nonetheless, he said that many employers “still think we’re in a recession,” which can mean that they take a conservative approach to salaries.

Moira McGrath, President of Opus International, a Deerfield Beach, Fla.-based executive search firm that specializes in the food science field, said she’s seeing something of a turnaround after a period of several years in which the job market was flat. “2009 was terrible,” McGrath noted, “and in 2011, employers were filling positions. Now I see that they’re adding to staff.
“As an example,” McGrath continued, “we had a young lady who was sitting around underemployed for six months. And just last month [October], she had four offers. Top-of-the-line companies were after her suddenly.”
Interviewed this past fall, executive recruiter and consultant Ron Bynum, President of RightSource Inc., Daytona Beach, Fla., had a somewhat similar perspective. “Everybody says that we’re out of the recession,” Bynum observed, “but hiring has just gotten busy for us in the past three months. In the first part of the year [2013], it was still quiet.”
--- PAGE BREAK ---
“I don’t see the volume of jobs that I’ve seen in the past from a growth perspective,” Bynum continued. “I see a lot more moves to a similar position in a different company, not necessarily as much upward momentum. I think employers are still hesitant on loading up with talent because they are not sure if the economy has turned around or not.”
Top performers are always in demand, of course, and they command top dollar. “I see a lot of competition for the right candidates,” said McGrath. “I think my clients have to be a little bit more competitive.”
Defining Characteristics: Survey Participant Profile
Just who are the participants in IFT’s 2013 survey? Here’s a quick look.
• Survey participants have a median of 16.2 years of food-related professional experience since receiving a bachelor’s degree, have had 2.5 employers in the profession to date, and have spent a median of 5.7 years with their present employer.
• Breaking participants out by age, 40% of respondents are under age 40, 46% are in their 40s or 50s, and 14% are 60+.
• One-third (33%) of survey respondents are employed by organizations with 5,000 or more staff members; 37% work for organizations with fewer than 500 employees.
• Salaries according to highest degree are a median of $75,000 for bachelor’s degree, $90,000 for a master’s degree, and $95,000 for a doctorate.
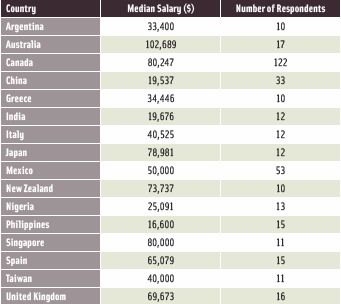
It should be noted that although the preceding statistics and those that follow in this article apply to U.S. IFT members, this year for the first time the survey had a wider scope and also included a limited number of nonmembers in the United States and members and nonmembers outside the United States. Salaries for select international markets are included in the sidebar “Food Science Salaries Around the Globe.”
Stress, Satisfaction, and Salary
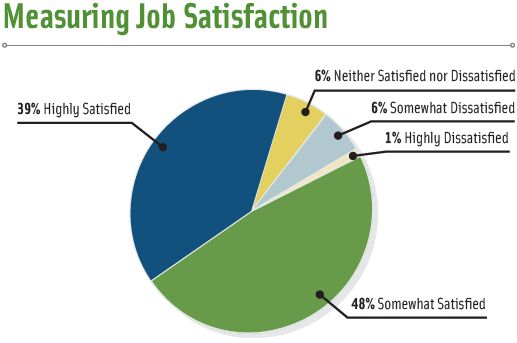
A total of 87% of survey respondents are either highly (39%) or somewhat (48%) satisfied with their jobs. That compares favorably with a 2012 survey of U.S. employees conducted by the Society for Human Resource Management (SHRM) in which 81% identified themselves as satisfied—with a breakout of 38% describing themselves as very satisfied and 43% as somewhat satisfied (SHRM, 2012).
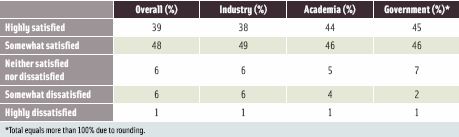
Survey respondents working in government and academia reported more job satisfaction than those employed in industry. Government-employed respondents topped the list, with 45% describing themselves as highly satisfied followed by 44% of academics and 38% of those employed in industry. (See Figure 2 for an overview of job satisfaction and Table 3 for a detailed breakout of job satisfaction by discipline.)
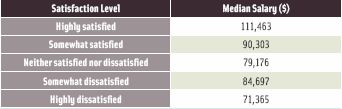
In a finding that is likely to surprise no one, the survey showed a clear correlation between salary and job satisfaction. The median salary among those who described themselves as highly satisfied is $111,463 vs $90,303 for those who said they were somewhat satisfied. Those who described themselves as neither satisfied nor dissatisfied reported a median salary of $79,176 (Table 4).
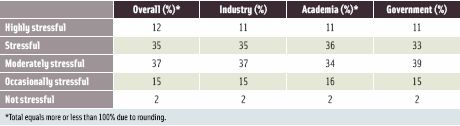
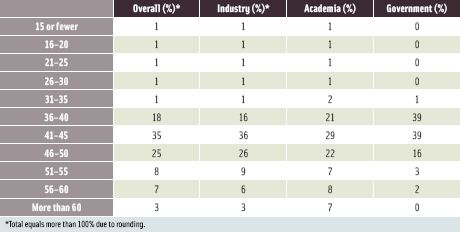
Reported stress levels were comparable across disciplines (Table 5), but number of hours worked per week showed more variation, with a greater percentage of those in government reporting shorter work weeks. Among government-employed respondents, 40% reported working 40 hours or less weekly compared with 27% of academics and 21% of those in industry. Looking at the opposite end of the spectrum, just 5% of those employed in government said they logged work weeks of more than 50 hours compared with 22% of academics and 18% of those in industry (Table 6).
--- PAGE BREAK ---
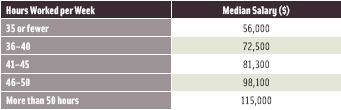
The number of hours worked appears to be directly correlated to salary, with those who worked 35 hours or fewer reporting a median salary of $56,000 vs a median of more than twice that ($115,000) among those who labored for more than 50 hours weekly (Table 7).
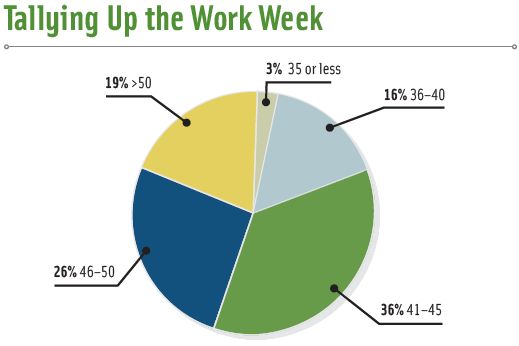
Among survey respondents, the average work week is 45 hours; 19% of respondents reported working in excess of 50 hours weekly (Figure 3).
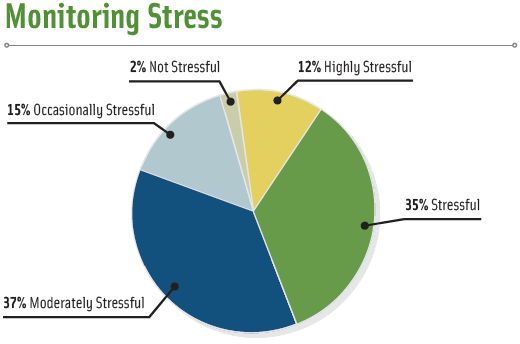
Employees’ stress levels appear to be holding constant. In 2013, 47% of survey respondents rated their jobs as highly stressful/stressful compared with 48% who categorized them in that way in 2011. In 2013, the largest percentage of survey respondents (37%) categorized their jobs as moderately stressful. The “stress range” extends from the 12% who rated their jobs as highly stressful to a fortunate—or very Zen-like—few (2%) who said that their jobs were not stressful. (See Figure 4 for a full breakout of how 2013 respondents described their level of stress.)
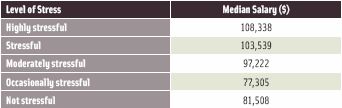
Those who labeled their jobs as highly stressful reported the highest median salary—$108,338, followed by $103,539 among those who categorized their jobs as stressful, and $97,222 for respondents who described their jobs as moderately stressful (Table 8).
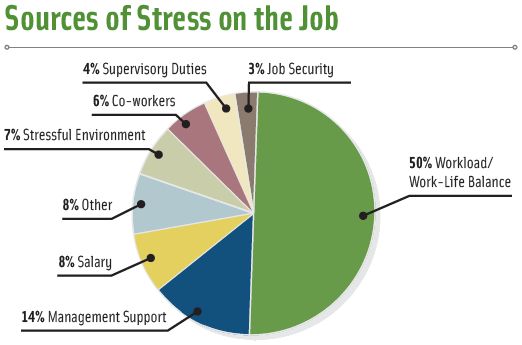
Asked about their greatest on-the-job challenges, half of U.S. survey respondents (50%) cited workload/work/life balance. Also noted on the list of challenges were management support (14%), salary (8%), stressful environment (7%), and co-workers (6%). (See Figure 5 for the full breakout of stressors.)
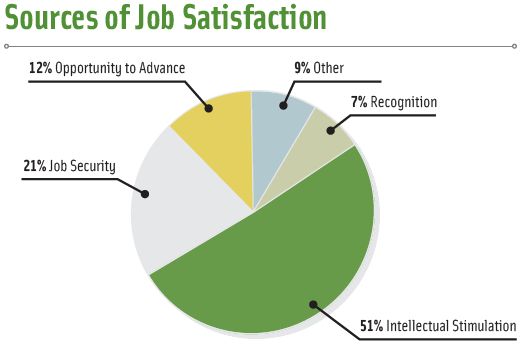
As might be expected within a scientific profession, intellectual stimulation is the No. 1 contributing factor to job satisfaction by a very wide margin, chosen by just over half (51%) of respondents. A write-in comment from one survey participant vividly captures this perspective. The comment states, “My position includes a wide variety of different tasks. Sometimes it’s analytical, sometimes it’s processing, but it’s always something—never boring.” The words and phrases “challenging,” “always changing,” “creativity,” “learning,” and “variety” appear over and over again in the 55-page list of responses to this question: What do you enjoy most about working in the field of food science?
Executive search expert John Scerbo, President of FoodEmployment.com, Roscoe, Ill., wasn’t surprised by the priority that respondents placed on the intellectual component of their jobs. “A lot of technical people want intellectual stimulation,” said Scerbo. “They want to develop new products. They want to be on the cutting edge. The companies that can provide that environment, I think people are happier there.”
Job security was No. 2 on the list of factors most central to job satisfaction, with 21% of respondents choosing it. The total dropped slightly from the 23% who made it a priority in 2011, perhaps reflecting greater distance from the recession of 2007–2009 and the desire for stability that uncertain time evoked. Rounding out the list of factors important to job satisfaction were opportunity to advance, which was the top factor for 12%, and recognition, which was important to 7% (Figure 6).
The list of challenges survey participants cited is much shorter than the list of things from which they derive satisfaction. It is also more varied and ranges from predictable responses such as “bosses,” “budgets,” and “bureaucracy” to the somewhat more surprising “workplace bullies.”
Some Good News on the Gender Gap
Overall, the salary gap between male and female survey respondents remained fairly consistent with IFT’s 2011 survey in which women earned 78.4% of men’s median salary. In 2013, women—with a median of $79,000—earned 77.5% of the $102,000 median for men. Although the percentage differential was down slightly, it compares favorably with national data which show that, across industries, women earned 76.5% of men’s salaries in 2012 (Cronin, 2013).
The IFT survey suggests that the salary tide may be turning for women. The gender gap in entry-level salaries narrowed this year. The survey shows that at $50,000, the median salary for women with 0–1 years of experience is 91% of the $55,000 for men with that level of experience.
--- PAGE BREAK ---
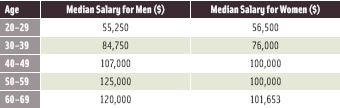
Indeed, among survey respondents ages 20–29, median salaries are higher for women ($56,500) than for men ($55,250). In the next age bracket (30–39), the pattern reverses, with men earning more, and by the 50s and 60s, the gender gap in salaries is even more pronounced (Table 9). According to analysis provided by IFT’s salary survey researcher, one way to interpret this data is that the gender-based salary differential is shrinking over time, with those hired more recently encountering a more level playing field. That conclusion is reinforced by broader U.S. Bureau of Labor Statistics data on male-female income by age group (Catalyst, 2013).
The IFT survey underscores the major role that women play in the food science profession. For the first time in the history of the IFT survey, women respondents represent a slight majority (52%). Among those under age 30, women account for 65% of respondents.
“The gap [between male and female salaries] is closing,” said recruiter Scerbo. “If anything, we’ve seen more of an uptick in salaries for females than in those for males,” he continued, noting that the firm has been receiving requests for searches specifically for female candidates from companies seeking to add more diversity to their workforce.
“What I’ve noticed especially on the technical side,” said Bynum of RightSource Inc., “is that there are a lot more women in management positions making decisions, and they won’t tolerate any gender inequality. I think if there was a salary gap in the past, it’s narrowing.”
The Changing Benefits Package
The vast majority of 2013 survey respondents (93%) said that their employers offered health insurance coverage; the total was down just slightly from the 96% who said their employers provided it in 2011. The number of those who said their employers offered retiree health insurance dropped from 14% in the prior survey to 10% in 2013. (See Table 10 for a close-up look at the benefits survey respondents reported receiving in 2013 and 2011.)
In fact, almost across the board, benefits ranging from flexible spending accounts to tuition reimbursement were offered less frequently in 2013 than in 2011. The number of survey participants who said their employers provided relocation expense subsidies, for example, dropped 10 percentage points, from 50% in 2011 to 40% in 2013.
Wellington has noticed the tightening of company purse strings in that area. “If you are a director or above, you’ll probably get a full package,” he noted. “But if you’re a lowly QA manager with a salary of $60,000 and they move you from Omaha to Houston, they probably will [just] give you a lump sum—maybe $10,000 to do what you want with.”
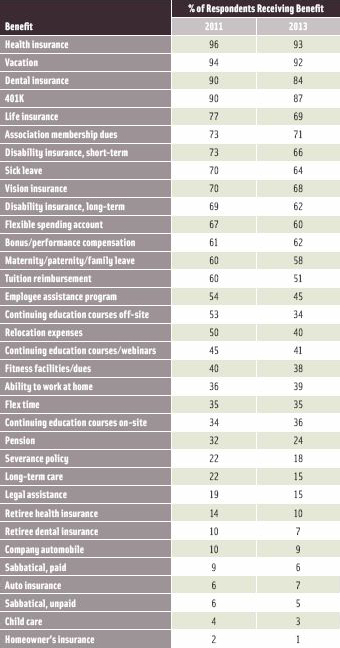
In the 2013 IFT survey, 64% reported receiving sick leave benefits from their employers, and 92% said they had vacation time, down from 70% and 94%, respectively, in 2011. The trend toward paid time off (PTO) plans that combine sick days, vacation days, and personal days into one pool rather than breaking out separate allocations for each may help to account for the IFT survey statistics.
According to data from Alexandria, Va.-based SHRM, the number of employers that have adopted PTO programs has climbed from 42% to 52% in the past five years. Bruce Elliott, SHRM Manager of Benefits and Compensation, said he expects to see another 5% of employers implement such plans within the coming year. The trend is driven by 20- and 30-something Millennial employees, who like the flexibility it affords, Elliott said.
Millennials also tend to embrace an emerging trend in benefit packages that Elliott calls “unlimited time off” or an approach that might be described as “take time when you need it, but just make sure your work gets done.” It’s especially prevalent in Silicon Valley with companies like Netflix, NerdWallet, and a few others, according to Elliott, who noted that “you typically see them [such plans] in high performance organizations, where the employee knows that this is what I have to get done, and I’m going to have to plan my time off around that.
“The Millennials who enter the workplace, they get this right away,” Elliott said. “It’s the longer-term employees who grew up with vacation schemes that were more hierarchical and based on service—they’re the ones that have a harder time with it.”
PTO tends to be more cost-effective for employers than traditional sick/vacation/personal time plans. Elliott explained that vacation time is accrued on profit and loss statements, and with PTO plans in place, employers start to see a reduction in that accrual, which can save them money.
“But that’s not the reason employers are doing it,” Elliott maintained. “They’re seeing increased productivity among employees. They’re seeing a reduction in the number of sick days taken or using PTO as sick days.” In this scenario, he said, an employee will recognize that, “If I know I only have 15 days, I’m not going to take too many mental health holidays.”
Another major change in employee benefits is the demise of defined benefit pension plans that pay out a “defined” or specific pension amount over the course of a retiree’s lifespan. “Retirement plans are shifting toward defined contribution plans and Roth 401(k) plans and away from defined benefit pension plans,” said Evren Esen, Manager of SHRM’s Survey Research Center.
In IFT’s 2013 survey, the percentage of those receiving a pension dropped from 32% in 2011 to 24% in 2013. SHRM’s 2013 Employee Benefits Research Report found that only 19% of employers still offered a defined benefit pension plan. Such plans are a “dying breed,” said Elliott.
“Defined benefit pension plans are extremely expensive,” said Elliott. “You are accruing an expense not for a year, but for 20 or 30 years out. It’s an unsustainable benefit for a lot of organizations is what it comes down to. I think in the next 10 to 15 years, you’ll probably see them go away altogether.”
According to IFT’s 2013 survey, 38% of respondents’ employers subsidize fitness program participation, down from 40% two years ago. Opting not to support wellness-related initiatives may be shortsighted, however. Elliott said that research has documented the fact that investing $1 in wellness initiatives will yield a return of more than $2 in reduced healthcare costs for an organization over a period of three to five years.
--- PAGE BREAK ---
What Clients and Candidates Want
Who’s most in demand in the food science field? “Everyone is looking for someone who has a B.S. or master’s degree, preferably with five to 15 years of industry experience, whether it be product development, quality assurance, or food safety,” said McGrath of Opus International. “That’s where the shortage is because we now have a lot of students coming out, but they’re still very new, and five to 10 years ago, we had a real shortage of students. When we have job openings, we all seem to be looking for the same person … that up and comer—that person who has experience, but who is not at the director level yet.”
Recruiter Bynum described the most sought after candidate as a professional with four to 10 years of experience—someone who is “affordable and will probably stay around for a while.” He added that it’s often hard to persuade those who are at this point in their careers to make a move. “It’s Murphy’s Law,” said Bynum. “Some of these people are the happiest with their employers. They’ve made it through the training stage.”
According to Bynum, positions he has had the most trouble filling include flavorists, flavor chemists, and quality assurance jobs.
“Food safety is still No. 1,” said McGrath. “There has to be strength in food safety these days, especially because of FSMA (Food Safety Modernization Act) rules. That’s causing a lot of shortages.”
Positions with companies that make healthful and nutritious foods and beverages represent good opportunities, according to Scerbo. “That market is doing well and I think will continue to do well,” he said. Bynum observed that expertise in the culinary area is a career-booster—so much so that if someone is considering a second degree, he would probably suggest culinary training over an M.B.A.
What personal and professional attributes make a candidate most attractive to an employer?
“The ability to manage is key,” said Bynum. Candidates don’t necessarily have to have management experience, but “management potential,” i.e., the ability to be trained to manage, is important.
Hiring professionals also like to see candidates who have steady career tracks and who aren’t job hoppers, said McGrath. She added good communication skills to her list of optimal attributes for a job seeker.
Robert Johnson, Scerbo’s partner at FoodEmployment.com, said he has found that more companies are doing personality profiles of candidates, attempting to ensure that the personality style of a new hire matches up well with current staff members. Johnson said he’s also noticed a movement toward more skills assessments as part of the hiring process.
And what about job hunters? What are they seeking?
“Most everyone looks for an opportunity for advancement, a steady career,” said McGrath. “Really, they’re looking for a home. The right part of the country and the right culture fit are critical.”
While sales professionals in the food industry tend to be driven by salary and bonuses, that’s often less important to food scientists who work in areas like quality assurance, R&D, and regulatory, said Wellington. “The quality of their work motivates them,” he noted, adding that “a good boss” and “the ability to move up” are also essential.
A job that demands extensive travel is not high on the list for many job seekers. “The older you get, it’s more about stability and safety and family and not traveling as much,” Wellington reflected. “When you turn 35 or 40 and you’ve got three kids and they’re in ballet and soccer and you’re off in Asia every month, that can be taxing. Travel is the killer for people with kids.” Wellington said he was recently seeking a candidate for a quality assurance job that required 70% travel, and that scenario had little appeal to most of the candidates.
Opportunities and Optimism
Although recruiter McGrath characterized herself as optimistic about future opportunities in food science, she acknowledged some concerns. “I’m hearing about layoffs,” she said. “That makes me nervous.” Overall, though, her perspective is positive. “I think the industry is still very strong,” she said.
“I think companies are starting to feel good,” said Bynum this past fall. “We’ve placed two national key accounts guys, and [filled] five or six technical positions in the last four months, and they’re all paying pretty well.”
SHRM’s Elliott predicts that, across industries, salary increases will hold steady with recent levels of about 3% annually and that hiring demand will be especially strong in technical fields. Thus it appears reasonable to expect continuing upward salary momentum for food science professionals, which is certainly a welcome forecast.
Online Exclusive content about negotiating a salary for a new job or a compensation increase for a current position is available at ift.org.
Survey Methodology
The 2013 IFT Employment & Salary Survey, conducted in September of last year, drew a 25% response rate among U.S. members. Survey e-mails and online survey links were managed by a private consulting firm, which kept all responses confidential. This year for the first time the salary survey was expanded to include some nonmembers in the United States as well as international participants (both members and nonmembers). A total of 3,762 individuals responded to the survey. Unless otherwise specified, the findings highlighted in this article apply to U.S.-based members.
--- PAGE BREAK ---
Does Money Matter Most?
Just how important is salary in comparison with other benefits of employment? The IFT salary survey didn’t explore that issue, but research from the Society for Human Resource Management (SHRM) puts it in the top five, and its relative importance has been trending upward. In 2012, it ranked No. 3, up from No. 4 in 2011 and No. 5 in 2010 (SHRM, 2012).
It’s important, but not the be all and end all, observed Bruce Elliott, SHRM Manager of Benefits and Compensation. “It’s not enough just to pay them [employees]. You’ve also got to provide a culture where they are going to want to work and stay. You’re also going to want to recognize your top employees through career track promotional opportunities.”
Recruiter Moira McGrath, President of Opus International, Deerfield Beach, Fla., agrees. “I don’t see that [salary] as the No. 1 reason for anyone to make a [job] change,” said McGrath. “And in my personal opinion, it shouldn’t be. Money is important, and it should not be last on your list, but I don’t think it should be first.”
“From what we’ve found over the years, salary is about No. 4 on the ladder of why people change [jobs],” said Ron Bynum, President of RightSource Inc., Daytona Beach, Fla. ”People want more responsibility, more challenge, more respect, maybe more opportunity. Salary is not the overriding factor.”
Still, the importance of salary should not be underestimated. “Salary is always important,” contended John Scerbo, President of FoodEmployment.com, Roscoe, Ill., an executive search firm and contract hiring agency for the food industry. “Regardless of what people say, that’s what people go to work for,” said Scerbo. He added, however, that while salary may be a deciding factor in the decision to accept or reject a job offer, “it’s usually other things that keep someone in a job.”
CFS: A Certifiably Valuable Designation
In 2013, IFT debuted its Certified Food Science (CFS) credential to recognize the applied scientific knowledge and skills of food scientists, and the Employment & Salary Survey suggests that it is indeed a beneficial designation. According to survey data, CFS recipients earn a median salary of $101,000 vs a median of $81,048 for those who do not have CFS certification. CFS certification is obtained by passing an exam that tests food scientists on a central body of knowledge that defines the core professional competencies of a food scientist.
 How to Impress a Hiring Professional: Tips from the Pros
“Don’t sweat the details” may be good advice for those striving to live harmoniously with a roommate or spouse. But it’s not the way to go for someone seeking to land a new job.
Just ask Moira McGrath, President of Opus International, an executive search firm based in Deerfield Beach, Fla. “I see a lot of sloppiness that there’s no excuse for, and no one excuses it,” said McGrath. “Be careful how you present yourself, especially in the beginning, because that first door has to open before any other doors open, and that door is your resume.”
Savvy job seekers will customize their resume for each position they are considering. “Tweak your resume and put some of the key buzz words from the job description into the resume,” advised recruiter John Scerbo, President of FoodEmployment.com. Recruiters are driven by key words, he emphasized. “If the key words are not matching up, there’s a good chance you won’t get the call for the job.”
Assuming a resume has done its job and attracted the attention of a hiring authority, a phone screen is usually the next step. Don’t underestimate the importance of this screening, and make sure that your phone presence is polished, the experts emphasized. The most successful candidates convey competence and enthusiasm and have done enough research to ask an intelligent question or two about the company and the job. “Have your resume in front of you while talking to the interviewer,” McGrath recommended.
Skype videoconferencing interviews are more and more common, so be familiar with the technology, and practice using it. “It’s not like interviewing in person,” said Scerbo. “When you do Skype, make sure that you position the camera correctly so that the background is appropriate.”
Finally, boost the odds of a job offer with a well-crafted thank-you note. “You need to follow up with a thank-you letter that is brief and to the point.” Don’t oversell yourself at this point, Scerbo advised. Just extend a courteous thank-you and briefly remind the interviewer of your skill set. “Professionalism still rules the day,” Scerbo concluded.
--- PAGE BREAK ---
Survey Delivers Global Perspective On Compensation
Get More Salary Survey Statistics
IFT’s 2013 Employment & Salary Survey research yielded a wealth of facts and figures, and only select highlights appear in this article. To delve more deeply into the data, check out the 2013 IFT Employment & Salary Survey Report. It is available free of charge to IFT members and to nonmembers for $99. For more information, or to download the report, go to ift.org/salaryreport.
 Mary Ellen Kuhn is Executive Editor
of Food Technology magazine ([email protected]).
References
Catalyst. 2013. Catalyst quick take: Women’s earnings and income. New York, N.Y. www.catalyst.org.
Cronin, B. 2013. Male-female pay gap hasn’t moved much in years. The Wall Street Journal, Sept. 17. http://blogs.wsj.com/economics/2013/09/17/male-female-pay-gaphasnt-moved-much-in-years. Accessed Nov. 29.
SHRM. 2012. 2012 Employee job satisfaction and engagement: How employees are dealing with uncertainty. Society for Human Resource Management, Alexandria, Va. www.shrm.org.