
The Top Ten Food Trends
Culinary narratives, whole food nutrition, and meal solutions that require less cooking are among the new macro trends driving the food industry.

By traditional measures, it appears to be a great time to be in the food business. Economic consumer confidence in North America is the highest since 2007; 51% of consumers are positive about immediate spending intentions (Nielsen 2014a).
On average, 5.1 evening meals per week are cooked at home and involve a diversity of product options (FMI 2015). In a typical week, 3.1 dinners are prepared at home using fresh/raw ingredients; 1.4 dinners include prepackaged ingredients that require preparation; 0.9 involve heating/serving prepackaged foods; 0.6 feature takeout; and 0.9 are eaten in a restaurant (MSI 2014a).
The U.S. restaurant industry is expected to reach $709.2 billion in sales in 2015—a 3.8% increase over 2014, marking the sixth consecutive year of real sales growth (NRA 2015).
With big-spending Baby Boomers and seniors now making more visits to every segment of the restaurant business than their younger counterparts, expect to see menu modifications catering to their preferences (NPD 2013a).
In 2014, 145 million people, or 59% of Americans, bought gourmet specialty foods. Retail sales topped $70 billion, up 18.8% over the previous two-year period (SFA 2014a, b).
 Even low-income households (annual incomes of $35,000 or less), which are projected to account for 51% of U.S. households by 2020, are expected to deliver $118 billion in new incremental consumer packaged goods revenue from 2010 to 2020 (IRI 2010).
But the industry appears to be off-track. Chasing niche/fad markets has become a dangerous approach. Pursuing free-from fads, gimmicky flavors, and me-too line extensions will stifle industry growth.
For example, although only 11% of shoppers looked for gluten-free on a food label in 2014—and half of those who bought gluten-free didn’t realize they had done so—mass marketers are now jumping on the gluten-free bandwagon, which peaked in 2012 (FMI 2014a; Hartman, 2013a).
It is worth noting that scanner data, which simply tallies sales of products that carry a claim, does not measure “intent to buy” and will continue to inflate and misrepresent these free-from and other market opportunities.
Line extensions (e.g., yogurt, snack chips, and K-cups) continue to proliferate. IRI (2013) reports that year one revenues for new food/beverage brands has consistently outpaced brand extensions (e.g., $54.3 million versus $41.0 million in 2013).
In a quest to capture Millennials’ attention, marketers are ignoring the one-third of Americans aged 50-plus, but older and younger consumers are often closely linked. After all, 34% of Millennials still live at home with their parents (Hartman 2013b).
Although one in five consumers look for a heart health claim on food packages, marketers are moving away from traditional health claims to softer health positioning. Without reinforcement, age-old linkages (e.g., oats/cholesterol-lowering or fiber/constipation) may soon fade away (FMI 2014a).
When it comes to attempting to woo Millennial consumers, the industry has gone too far. Think cappuccino chips, jelly bean–flavored beer, and lime-cucumber sports drinks. In restaurants, interest in novel/unique flavors dropped 11% between 2011 and 2013 (Technomic 2013a).
It’s time to get back to basics and take a hard look at today’s consumer needs, changing lifestyle trends, and food/flavor preferences.
--- PAGE BREAK ---
1. THE BIG CHILL
The shift to fresh and refrigerated foods is unstoppable. Nearly nine in 10 adults (87%) feel that fresh foods are healthier, and 80% believe that they are tastier; 78% of consumers are making a strong effort to eat more fresh versus processed foods (Technomic 2014a; MSI 2014a).
Over the past 10 years, consumption of fresh foods grew 20% to more than 100 billion “eatings” per year. The NPD Group (2014a) projects fresh eatings will exceed 120 billion per year by 2018.
By 2018, fresh breakfast eatings are expected to jump 9%; lunch, 7%; and dinner, 5%. Fresh eatings by Millennials and Gen Z consumers will increase 11.1% and 7.5%, respectively.
Fresh foods accounted for 29% of all U.S. grocery outlet sales for the year ended (Y/E) March 29, 2014 (Nielsen 2014b). Premium/fresh-format grocery stores that focus primarily on fresh and ready-to-eat foods are expected to have the highest growth rate through 2018 (FMI 2014a).
Fresh foods are particularly attractive to U.S. Hispanics, who spend $452 more per year on food than the general population; 41% of that spending is for fresh foods (Nielsen 2014c). Fresh prepared foods are projected to outpace retail and foodservice food/beverage sales through 2017 with sales up 6%–7% (AT Kearney 2013). Sales of fresh prepared foods sold in the deli department rose 7.2% for the Y/E March 29, 2014 (Nielsen 2014b).
Shoppers are buying more fresh ingredients, up 10% versus three years ago (FMI 2014a). Nearly half (47%) of shoppers are cooking more from scratch, using fewer convenience foods in order to save money (IRI 2015).
Dollar sales of fresh global/exotic items grew 9%; fresh convenient, 7%; healthy fresh, 7%; and fresh premium/indulgent, 4% (Nielsen 2014b).
After flavorful, fresh is the most important snack attribute (Nielsen 2015). Nielsen estimates the fresh protein snack category opportunity at $19 billion in 2014 (Dudlicek et al. 2014).
Sales of single-serve fresh produce snacks soared in 2013, led by celery, +13%, and cucumbers, +11% (Wyatt 2014).
Consumers increasingly link fresh foods to specific nutritional attributes; 75% of Millennials associate meat with protein and iron; 62%, with energy; and 53%, with building physical strength (FMI 2015).
Fresh claims are important in the center store, too. One in five of the bestselling new foods/drinks introduced in 2013 touted a “fresher flavor” claim (IRI 2014). Heinz’s bottled Classico Four Cheese Alfredo Sauce touts “made with fresh cream and aged cheese” on the label. And fresh technologies (e.g., cold pressing or high pressure processing) are creating premium markets for juices, coffees, and oils.
--- PAGE BREAK ---
 2. LIFESTYLE LOGISTICS
Dramatic changes in lifestyles, eating patterns, and demographics are creating new rules for marketing and packaging and are motivating new food product purchases.
Nearly half (47%) of all eating occasions are alone. Even in multiperson households, 39% of eating occasions are solo (Hartman 2013c).
The family meal continues to erode. Only 27% of family meals include children. However, in 28% of families, the family members will eat the same meal for dinner even if they each eat alone and at different times (Hartman 2013c).
Sales of kid-specific meals are expected to skyrocket from $32 billion in 2013 to $41 billion in 2018 (Packaged Facts 2014a). One-quarter (23%) of the best-selling new foods/drinks introduced in 2013 were kid-specific, up 7% from 2012 (IRI 2014).
With two-person, married couple households with no children at home (57 million) and households with persons living alone (31 million) the two largest U.S. household units, foods that can be easily portioned or packaged for one or two adults will gain in popularity (U.S. Census Bureau 2010).
Increasingly, snacks/meals are eaten the same day as they are purchased. In 2013, 15% of all eating occasions involved foods/beverages eaten within an hour of purchase. Millennials accounted for 40% of these eatings (Hartman 2013c).
The structure and dynamics of American households are also changing. In 2014, men were the primary food shopper in 43% of households (FMI 2014a). Men also are more involved in household meal preparation; 46% of men helped with meal preparation in 2014 versus 38% in 2001 (MSI 2014a). Multiple cooks per household are another fast-emerging opportunity (FMI 2014a).
One-quarter (27%) of the best-selling new foods/drinks introduced in 2013 were bite-sized or handheld; 21% were on-the-go or ready-to-use (IRI 2014).
Half of consumers snack at work, up 7% in 2014 from 2012; those snacking en route to work (i.e., while driving), dropped 7% to 43% (Technomic 2014b).
Developing food products for consumers to take from home is another fast-emerging opportunity. In 2014, 23% of consumers brought lunch from home, and 8% brought breakfast (FMI 2014a).
Four in ten among those aged 18–24 and 34% of those aged 25–34, think vending machines are a good snack option, up 10% and 14%, respectively, over the past two years (Technomic 2014b)
--- PAGE BREAK ---
.
 3. REASONABLE SNACKING
The uniqueness of and motivation for each specific snack and mini-meal occasion represent a new series of exciting market differentiators for the explosive snack and on-the-go meal sector.
The average number of in-between-meal snacks grew from 1.9 per person per day in 2010 to 2.8 in 2014. Half (51%) of adults ate three or more snacks per day, up from 21% in 2010 (Wyatt 2014).
In 2014, 28% of adults reported eating four or five mini-meals a day; 21% say that they eat on the run and “grab food when they can” (Wyatt 2014). Yogurt, fruit, and bars are the snacks most likely to be used as meal alternatives (NPD 2014b).
Although the lines between snacks and meals are blurring, the majority of consumers are not likely to eat the same foods for snacks as they are for breakfast, lunch, or dinner (Technomic 2014b).
Dayparts provide unique opportunities for snacks. Over two-thirds (68%) of consumers snack in the afternoon, up 17% versus 2010; 62% snack in the evening, +18%; 46% snack in the late evening, +22%; 37% snack in the morning, +15%; and 18% snack in the early morning, +11% (Wyatt 2014).
Convenience—closely followed by energy needs, hunger, and nutrition—drive the morning snack decision; reward, indulgence, and convenience are most important in the evening (HealthFocus 2013).
Yogurt, bakery snacks, bars, dairy products, and fruit-based smoothies are the top morning snacks; salty snacks, snack nuts, chocolate candy, crackers, and cookies get the nod in the afternoon (Wyatt 2014; Figure 1). About half of snacks include a food and drink; 17% are a beverage, and 38% are food only (Technomic 2014b). While soft drinks, coffee, teas, and juice are the most purchased snack beverages, 41% of consumers occasionally buy milkshakes as a snack; 35%, milk; 34%, smoothies; 20%, energy drinks; and 15%, yogurt drinks (Technomic 2014b). Pomegranate, avocado, and chocolate–peanut butter were the fastest-growing smoothie flavors in restaurants in 2013 (Datassential 2014a).
Sales of savory snacks increased 1.1% in 2013, sweet snack sales declined by 2.1%, continuing a five-year trend (Wyatt 2014). Flavorful and fresh top the list of snack attributes that are very important to U.S. consumers; one-quarter of consumers cite crispy, savory/salty, sweet, or crunchy; one in five mention juicy, creamy, bite-size, or fruity; and only 12% say spicy or hot (Nielsen 2015).
Health is an important snack selection factor for half (50%) of adults (Technomic 2014b). Refrigerated juices/drinks, smoothies, yogurt, nutrition bars, trail mixes, specialty nut butters, and popcorn were among the fastest-growing healthy snacks in 2013 (Wyatt 2014).
Nearly half of consumers (45%) look for snacks that go beyond basic nutrition (Wyatt 2014). One in five buy snacks for an energy boost or to improve their mood; 17% do so to manage weight (Nielsen 2015).
Chocolate-covered pretzels, dried meat snacks, frozen and refrigerated handheld entrees, and frozen appetizer/snack rolls drove growth for indulgent snacks (Wyatt 2014). Chocolate, fresh fruit, chips, bread/sandwich (outside a meal), cheese, ice cream, vegetables, and cereal are the snacks Americans would choose above all others (Nielsen 2015).
--- PAGE BREAK ---
 4. DISCOVERY
In 2014, the Food Marketing Institute (2014a) identified “discovery” as a new “must-have” food attribute in which retailers/manufacturers help create more sophisticated food experiences.
And a big opportunity it is. In 2013, 41% of all eating occasions, 33% of snacking occasions, and 29% of kids’ eating occasions involved a more sophisticated culinary experience that was characterized by unique flavors and culinary narratives (Hartman 2013c).
Ninety-six million Americans buy gourmet foods for everyday use; 52 million purchase them for everyday snacks (SFA 2014b). Gourmet chocolate, oils, and cheese are purchased by more than half of specialty food shoppers; coffee, salty snacks, meat/poultry/fish, frozen desserts, nonalcoholic beverages, bread/baked goods, and tea are purchased by more than 40% (SFA 2014b).
The demand for more Asian products is on the rise. Two-thirds (67%) of mainstream food shoppers buy Chinese foods; 25%, sushi; 24%, Thai; and 18%, Japanese (FMI 2014a; Sloan 2015).
Ethnic fusion tops the list of hot cuisines/flavors for 2015, followed by authentic ethnic cuisines, regional ethnic cuisines, Peruvian cuisine, and Southeast Asian; interest in Filipino foods is on the rise (NRA 2014). One-quarter (27%) of specialty food consumers buy American regional foods (SFA 2014b).
Pickling, fermenting, fire-roasting, and smoking are the hot food preparation trends for 2015; charred food is back in vogue (NRA 2014). Harissa, aji, gochujang, yuzu, togarashi, peri peri, nut butters, savory jams, stouts, and za’atar are among the global flavors set to rival the popularity of sriracha in 2015 (Datassential 2014b).
New cuts of meat (e.g., coulotte steaks or New York pork chops) and nontraditional and underutilized fish (e.g., branzino or bluefish) continue to add excitement to the center of the plate (NRA 2014). Lamb sales rose 7% in 2014 (FMI 2015).
Shrimp, followed by salmon, canned tuna, tilapia, pollack, Pangasius, cod, catfish, crab, and clams were the most consumed seafood in 2013 (NFI 2014). Oysters, seafood charcuterie, and raw fish appetizers (e.g., seafood carpaccio) are hot trends for 2015 (NRA 2014).
Taleggio, burrata, pecorino Romano, Hispanic Cotija, and queso fresco were among the fastest-growing cheeses in restaurants in 2014 (IDDBA 2015).
Coconut, mango, cinnamon, ginger, blackberry, tangerine, apricot, and açai are among the anticipated top-selling beverage flavors for 2015 (Jacobsen 2015). Aranciata and limonata are among the top 10 fastest-growing beverage flavors in restaurants (Datassential 2014a).
Nearly two-thirds of consumers (63%) say that barbecue is of high interest for sandwiches in 2015; 51% cite upscale breads (e.g. brioche, pretzel); 41%, ethnic sandwiches (e.g., banh mi, tortas, Cuban); 37%, gluten-free, vegan, or organic; 32%, unique sandwich carriers (e.g., naan, bao, waffles); and 31% pickled ingredients (e.g., giardiniera, onions, or radishes) (Datassential 2015).
With Greece, Sweden, Peru, Russia, Germany, and Argentina among the top pasta-consuming countries, look for a new wave of unique pastas and recipes, from spaetzle to pierogi (IPA 2012). Asian noodles are an untapped opportunity. The number of chefs citing Asian noodles and ramen noodles as a hot trend jumped 5% over 2014 (NRA 2014).
Dark greens are among the fastest-growing culinary trends, with mentions by chefs up 10% versus 2014; mentions of Southeast Asian cuisine were up 9%; ethnic flour, +7%; ethnic-inspired and gourmet children’s dishes, +6%; Nordic cuisines, +6%; nontraditional eggs, +6%; and brussels sprouts, +6% (NRA 2014).
Conversely, Greek yogurt fell 11% as a hot culinary trend versus last year; sweet potato fries, -8%; grass-fed beef, -7%; organic coffee, -7%; gelato, -6%; Korean cuisine, -6%; salted caramel, -5%; and brown/wild rice, -5% (NRA 2014). Gelato, micro-greens, flatbreads, tapas/meze/dim sum, dessert flights, exotic fruit, superfruits, and bite-sized desserts are other cooling culinary trends (NRA 2014).
--- PAGE BREAK ---
 5. EXCLUSION DIETS
Consumers are experimenting with alternative eating styles. In 2014, one-third of adults tried a specialty regimen; 8% tried gluten-free; 7%, lactose-free, 6%, raw/living foods; 5%, dairy-free; and 5%, a juice cleanse (FMI 2014a).
Three-quarters (76%) of U.S. households prepare meat alternatives (defined as protein sources other than meat, poultry, or seafood) for dinner (FMI 2015). Four in 10 meal preparers (44%) serve meat alternatives one to three times per week; 7% do so four or more times weekly. Meat or poultry is eaten an average of 3.7 nights per week (FMI 2015).
Eggs are the most popular meat alternatives, prepared by 78% of consumers; 61% serve beans, lentils, or legumes; 28%, veggie burgers; 28%, quinoa/other whole grains; 18%, seeds/nuts; and 14%, tofu or tempeh (FMI 2015).
Seventeen percent of adults are making some effort to follow a partially vegetarian diet; those aged 18–24 are most likely to do so. In 2014, 2% of consumers avoided all animal products; 3% avoided meat, poultry, and seafood (MSI 2014b).
Vegetarian tops the list of trendy appetizers for 2015; meatless/vegetarian dishes rank eighth, and vegan is 11th among the hot center-of-the-plate trends (NRA 2014).
Dairy-based drinks/alternative drinks are the most active new beverage development category for 2015, followed by sports/energy drinks and coffee/tea (Jacobsen 2015). Almond milk was found in 10% of kitchens in 2014 (NPD 2015).
Starbucks Single Origin Sumatra Coconut Milk is a new alternative to dairy and soy for handcrafted beverages. Silk Cashewmilk is a new alterative nut-based drink.
Despite wide discrepancies in estimates of the size of the gluten-free market, Packaged Facts’ estimate of $907.3 million in 2014 seems most reflective of the sales of products formulated specifically for the gluten-free market (Packaged Facts, 2014b).
In 2014, 44% of adults felt gluten-free foods were healthier, down from 60% in 2012 (Technomic 2014a). Gluten-free products currently account for less than 1% of total bakery sales (IDDBA 2015). However, General Mills has added gluten-free baking kits to its Betty Crocker line.
Food restrictions, intolerances, or allergies have a good deal of influence on food choices for one in 10 shoppers; 17% are somewhat influenced (Packaged Facts 2014b). Four percent of U.S. adults are currently watching their diet for lactose intolerance; 6.5% made an effort to buy lactose-free foods in 2014 (Packaged Facts 2014b). Thirteen percent of moms report their child avoids milk/dairy/lactose, +5% over the past five years; 5% say their child avoids peanuts/nuts; and 2% note that they avoid fish and/or honey (MSI 2013).
Food allergies in children are on the rise; 4.1 million kids under the age of 17 suffer from true food allergies. Milk, peanuts, tree nuts, eggs, fish, crustacean shellfish, wheat, and soy remain the “big 8” allergens (U.S. Dept. of Health and Human Services 2013). Food intolerance was the second-fastest-growing global positioning for functional foods/beverages (Euromonitor 2014).
--- PAGE BREAK ---
 6. GOOD MORNINGS
The a.m. daypart is chock full of opportunity. In 2014, breakfast was eaten at home 5.1 times per week (FMI 2014a). Half of breakfasts are eaten alone (Hartman 2013c).
In 2014, 44% of consumers visited a fast-food restaurant for breakfast in the past month; 39% visited a coffeehouse/doughnut shop; 32%, a family restaurant; and 15%, a full-service restaurant (Packaged Facts 2014c).
Ten percent of all breakfast foods are consumed within an hour of purchase (Hartman 2013c). Breakfast consumption increases with age (Technomic 2013b).
Not surprisingly, a wide variety of breakfast foods are enjoying strong growth. Ready-to-drink breakfast meals, although a small category, jumped 56% for the Y/E June 15, 2014, according to Information Resources Inc. (IRI) data.
Sales of bakery snacks grew 16.8%; refrigerated breakfast entrees, +16.1%; eggs, +11.5%; nutrition bars, +8.3%; nutritional snacks/trail mixes, +6.8%; pastry/doughnuts, +6.4%; hot cereal, +6.2%; frozen handheld entrees, +4.2%; and frozen breakfast entrees, +2.2. Meanwhile, cold cereal sales fell 4.2%, per IRI.
When surveyed about what they consumed for breakfast in a recent two-week period, 92% of consumers reported eating ready-to-eat cereal at home; 90%, oatmeal; 86%, yogurt/yogurt parfait; 85%, fruit/fruit cup; 81%, bagel; 79%, smoothie/shake; 77%, eggs; 77%, French toast; 75%, waffles; 73%, muffins; 73%, bacon; 66%, sausage; 65%, pancakes; and 52%, breakfast sandwiches (Datassential 2015).
Consumers say that getting nutrients in the morning is even more important than avoiding negatives, having real food, or using the best quality ingredients (FMI 2014a). Having more energy and mental focus, helping to maintain weight, and feeling full until lunchtime are all things that would motivate non-breakfast-eaters to dig into breakfast (IFIC 2011).
With half of consumers trying to get more protein, and breakfast consumption shifting from high-carbohydrate foods (e.g., cereal, toast) to high-protein foods/drinks, protein-packed breads and breakfast bakery items are a very big idea (Garda 2014).
Ethnic flavors trending in p.m. dayparts are working their way onto the breakfast menu; these include chipotle, manchego, chutney, Cotija, and chimichurri (Datassential 2015).
Half of adults reported eating a breakfast sandwich at a restaurant in a recent two-week period (Datassential 2015). Focaccia, rye, baguettes, and ciabatta breads are gaining popularity at breakfast in restaurants as are flatbread/panini and Cubano breakfast sandwiches and breakfast pizza (Datassential 2014a).
Vegetables (e.g., arugula, spinach), along with pulled pork, brisket, turkey bacon, and fried chicken, are moving onto morning menus (Datassential 2014a). Fruit is the top item that diners would like to see more of on breakfast menus (Technomic 2013b). Lack of healthy options for children’s breakfast is one of consumers’ biggest complaints about fast food (Technomic 2013b).
--- PAGE BREAK ---
 7. RETHINKING NATURAL
In 2014, 29% of consumers bought more local foods/beverages; 28% bought more organic products; 25%, more natural foods; and 23%, more non-GMO offerings (Hartman 2014).
Three in 10 made a strong effort to consume more minimally processed foods (MSI 2014b).
In addition, one-third of shoppers sought out products made with no preservatives; nearly one-third (32%) sought products with no chemical additives; and 28% sought to avoid high fructose corn syrup (FMI 2014a). One-quarter (26%) of consumers searched for foods/drinks that contained only ingredients they recognized; 25% sought products that had the shortest ingredient list (Hartman 2013d).
In 2014, 73% of adults and 86% of Millennials used organic food/beverages (Hartman 2014). Hispanics are more likely to seek out natural foods versus the general population (Packaged Facts 2014d).
In 2014, 40% of adults were trying to avoid GMOs. Although 52% felt they understood GMOs, only 43% were aware of the GMO certification seal (Hartman 2013e). More consumers are opting to buy certified organic foods and beverages in order to avoid GMOs (Hartman 2014).
But the natural market mix is likely to change. Natural food claims on new products have fallen 11% between 2007 and 2013, likely due to class action lawsuits and lack of a regulatory definition (Datamonitor 2014).
Not surprisingly, at the February 2015 Natural Products Expo West/Engredea event, competition was fierce between certified organic marketers, who by definition have been delivering non-GMO attributes, and standalone certified non-GMO manufacturers.
Nearly half (45%) of consumers do not actively look for certifications; those who do are more influenced by government versus third-party symbols (Hartman 2013e). Certified Kosher is an age-old certification that is getting renewed attention.
Truly natural sweeteners (e.g., agave, honey, concentrated fruit juice, and maple syrup) are among the hot culinary ingredients for 2015 (NRA 2014). Nose-to-tail/root-to-stalk cooking enjoyed the largest jump in interest as a hot culinary trend for 2015, up 16% versus 2014 (NRA 2014).
More than a third (39%) of consumers purchased organic/natural meat or poultry within the past three months, and 63% say they would be very interested in a “produced in the USA” claim for meat/poultry (FMI 2015).
--- PAGE BREAK ---
 8. WHOLE FOOD NUTRITION
When ingredients that deliver healthy whole food nutrition match up with cutting-edge culinary trends, the results are explosive. Yet few marketers seem to be taking advantage of the added nutritional benefits when featuring fruits, vegetables, grains, nuts, legumes, or seeds.
While gluten-free has drawn attention to digestive issues, its biggest long-term benefit may be the attention it has brought to ancient, ethnic, and alternative whole grains/flours.
Fiber/whole grain were the most sought after food ingredients in 2014 (IFIC 2014). In 2013, 37% of shoppers switched to a healthier bread; 24% opted for healthier pasta; and 22%, healthier crackers (FMI 2014b).
Non-wheat noodles/pasta (e.g., quinoa, rice, or buckwheat) top the list of side dish culinary trends hot for 2015 (NRA 2014). Non-wheat flour (e.g., peanut, millet, barley, and rice) ranks third among the hot culinary ingredient trends for 2015; ethnic flours (e.g., fufu, teff, and cassava/yucca) are No. 7 (NRA 2014). Sprouted grains and chia are also quickly becoming trendy items among mainstream consumers.
Four out of 10 adults (44%) have eaten ancient grains (Mintel 2013). With bread undergoing a renaissance, the timing for more specialty flours is perfect. Four in 10 adults buy Italian breads (e.g., focaccia); 37%, seasonal (e.g., pumpkin); 36%, European loaf (e.g., pumpernickel); 36%, flavored artisan (e.g., rosemary); 35%, Middle Eastern; 29%, egg-based (e.g., challah, brioche); and 27%, Indian (Mintel 2013).
More than one-third (36%) of the best-selling new foods/beverages in 2013 carried a real fruit/fruit health benefits claim, and 14% of the best-sellers touted a vegetable health benefit (IRI 2014).
A full serving of fruit or vegetables is important to 80% of consumers. Moreover, 48% of adults believe that foods containing a full serving of vegetables are much more tasty (Technomic 2014a).
George Weston Foods offers Country Harvest Veggie Bread that delivers one full serving of vegetables per slice, and Snikiddy’s Eat Your Vegetable Chips contain a full serving of vegetables in every ounce.
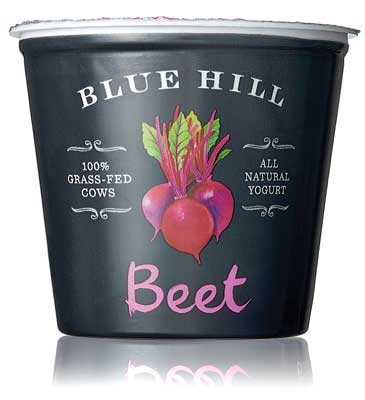
Yogurt from Blue Hill now comes in unexpected savory flavors like beet, carrot, and tomato. Celery and carrot are among the fastest-growing juice flavors in restaurants (Datassential 2014a).
Jamba Juice is focused on whole fresh food. The smoothie purveyor blends fruits/vegetables and is promoting the fiber content of its smoothies. Vegetable ingredients are also turning up in waters, teas, and even ice cream.
Nearly half (47%) of consumers say fruit is a desirable snack food attribute (Nielsen 2015). Heirloom and hybrid fruits/vegetables (e.g., plumcot, exotic fruits, and uncommon herbs) are product differentiators with high potential in the marketplace.
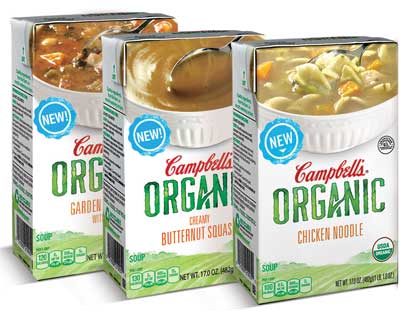
Campbell’s V-8 shelf-stable vegetable and fruit juice beverages come in varieties like Purple Power, made from the juices of purple carrots, beets, and apples, and Healthy Greens, made from the juices of spinach, yellow carrots, apples, and pineapple.
High-protein nuts and seeds are also making significant nutritional contributions to a wide variety of products ranging from cereal and oatmeal to bars and beverages.
Of noticeable absence is dairy. With the high household penetration of milk and cheese, can a full serving of dairy claims be far behind?
--- PAGE BREAK ---
 9. ‘COOK-LESS’ MEALS
More than a quarter (28%) of consumers say that they are preparing more meals in less than 20 minutes than they did five years ago. Meals that stretch the meat (e.g., pasta, soup, casseroles) rose 36% over the past five years; one-pot meals were up 29%; and meals using marinated meats/poultry were up 21% (FMI 2015). One-dish meals are significantly less popular among younger shoppers, who are more likely to have increased their consumption of ethnic dishes and marinated and value-added meats (FMI 2015).
Millennial consumers prepared dinner at home an average of 4.5 nights per week in 2014; for Gen Xers, the average was 5.0; Baby Boomers, 5.1; and for those 65+, 5.2 (FMI 2014a). Oven baking is the most common cooking method (Mintel 2012). Take-and-bake fresh pizzas and assemble-at-home bakery products are very hot trends (IDDBA 2015).
Half (49%) of shoppers are preparing more nutritious meals. One-quarter are steaming and stir-frying more; the frequency with which consumers fried food fell 19% over the past five years (FMI 2015).
Twenty-eight percent of consumers are preparing ethnic foods more frequently (FMI 2015). One-third (35%) of consumers prepare Mexican meals from scratch; 28% use packaged meals/kits. For Asian meals, 20% of consumers prepare them from scratch and 25% use packaged meals/kits (Mintel 2014a).
When it comes to sauces/marinades, spicy/hot flavors are preferred by 52% of consumers. In addition, 49% are fans of authentic U.S. regional flavors, and 40% go for international/ethnic (Mintel 2014b).
One in five U.S. households—mostly affluent, health-minded couples —overspend on fresh convenience foods. Packaged salads, cooking greens, and fresh-cut fruit were among the top produce gainers for the year (Nielsen 2014b).
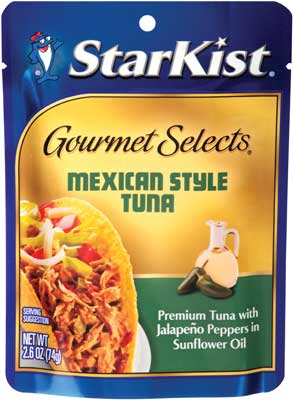
Offering more flavored basics (e.g., pasta, butter) that replace the need for a variety of spices is a very big idea. Garlic is the most popular flavor in meals prepared at home, followed by onion, red/green peppers, avocado, jalapeño peppers, nuts, balsamic vinegar, chives, feta cheese, ginger, scallions, cooking sherry, and seeds (MSI 2014a). The StarKist Gourmet Selects line of tuna in pouches has wild-caught Mexican Style and Mediterranean Style varieties and exemplifies the addition of trendy flavorings to a traditional household staple.
More than half (57%) of grocery shoppers buy fresh ready-to-eat items (e.g. rotisserie chicken, sandwiches, sushi) often or sometimes, and 44% buy fresh heat-and-eat foods (e.g., fresh pizza or soup) (FMI 2014a).
The number of consumers who at least somewhat agree that frozen dinners have little nutritional value increased 20% over the past 10 years; those agreeing a lot jumped 40% from 2004 to 2014 (Packaged Facts 2014c).
Nestlé’s “freshly made, simply frozen” campaign is aimed at improving the image of its frozen meals. Nestlé’s Lean Cuisine Marketplace and Stouffer’s FitKitchen lines feature high-protein, simple ingredients and are gluten-free.
--- PAGE BREAK ---
10. DIET WATCHING
Just over half (53%) of adults and more than half of U.S. households (55%) are watching their diet; 66% do so for general health reasons; 55%, to lose weight; 40%, to limit, fat, sugar, sodium, etc.; 38%, to prevent future medical issues; 37%, to maintain weight; 22%, to treat a current medical condition; and 10%, for a real/perceived food allergy or intolerance (Packaged Facts 2014e).
The number of shoppers seeking out traditional low in, reduced, no, and free-from claims has fallen by double digits since 2011 (with the exception of sugar and calories). However, consumer interest in products with such positioning generally remains high (FMI 2014a).
In 2014, 41% of consumers looked for low-sodium health claims on labels; 37% looked for low-sugar; 33%, no trans fat; 31%, low-calorie; 22%, low-carb; and 22%, low-cholesterol (FMI 2014a; Figure 2).
 Sixty-six million adults are trying to lose weight; 31.7 million are trying to maintain their weight. Weight maintainers have moved to simply eating healthfully as a means of controlling their weight while weight losers remain attracted to products that are lower in calories, carbohydrates, and fat (Packaged Facts 2014f).
Vitamin D, vitamin C, calcium, omega-3s, and B vitamins top the list of nutrients consumers are making a strong effort to consume. Potassium, magnesium, choline, fiber, prebiotics, and iron are the hot up-and-coming nutritionals (MSI 2014c). Fortified with vitamins/minerals are among the “must have” beverage attributes for 2015 (Jacobsen 2015).
An unprecedented demand for higher-performing foods/beverages and a dramatic increase in the number of adults becoming physically active have caused the lucrative $30.7 billion sports nutrition/weight loss sector to move mainstream (NBJ 2014).
There is also growing interest in more heavily fortified and “complete” meal replacement foods/drinks. One-third of bar users use nutrition bars as a meal replacement; two-thirds (68%) say that “100% of the daily value for vitamins/minerals” is an important bar attribute (Mintel 2014c).
Sales of nutrition bars are projected to reach $5.7 billion by 2017; weight loss/meal replacements, $4.3 billion (NBJ 2014). In 2014, 59% of adults used sports drinks; 39% used nutritional drinks (e.g., Slimfast Shakes, Ensure, etc.); and 31%, protein drinks (e.g., Muscle Milk) (Mintel 2014c).
Half of consumers made an effort to consume more protein in 2014. Issues surrounding the amount, type, and frequency of protein consumption and greater awareness of a wide range of performance benefits will drive a new generation of high-protein foods/beverages.
Nine in 10 adults (87%) believe that protein builds muscle; 76% think it aids in exercise recovery; 72%, helps you feel full; 66%, aids weight loss; and 64%, provides energy throughout the day (IFIC 2014).
Lastly, American Heart Assoc. (2015) statistics are a sober reminder of the opportunity for functional foods: 97 million Americans have coronary vascular disease; 80 million have hypertension; 100 million have high cholesterol; 159 million are overweight, 82 million are obese; and 21 million have been diagnosed with diabetes.
A. Elizabeth Sloan, PhD,
a professional member of IFT and contributing editor of Food Technology,
is president, Sloan Trends Inc., Escondido, Calif. ([email protected]).
References
AHA. 2015. “Heart & Stroke Statistics 2015.” American Heart Assoc. Dallas, Texas. heart.org.
AT Kearney. 2013. Fresh Prepared Food a Growth Driver for Your Company? Joint report with Technomic Inc. Available via Technomic Inc., Chicago. technomic.com.
Datamonitor. 2014.
Datassential. 2014a. “Food and Menu Trends From Datassential.” QSR 189(1): 4-25. datassential.com.
Datassential. 2014b. “10 Trends to Watch in 2015.” FoodBytes.
Datassential. 2015. “Menu Trends for 2015.” QSR 190(1): 4-17.
Dudlicek, J., B. Goldschmidt, and J.McTaggart. 2014. “Strengthening the Shopper Experience.” Progressive Grocer 93(11): 35-82.
Euromonitor. 2014. Health and Wellness Performance Overview. Datagraphic. Oct.9. www.euromonitor.com.
FMI. 2014a. U.S. Grocery Shopper Trends. Food Marketing Institute, Arlington, Va. fmi.org.
FMI. 2014b. Shopping for Health.
FMI. 2015. The Power of Meat.
Garda, T. 2014. “Cereal’s Struggle: One More Victim of the Protein Craze.” The Wall Street Journal, July 23.
Hartman. 2013a. Reimagining Health & Nutrition. The Hartman Group, Bellevue, Wash. hartman-group.com.
Hartman. 2013b. “Millennials in Focus: The Emerging Food Culture of the Young & Restless.” Presented at the Culinary Institute of America’s Worlds of Flavor Conference, Napa Valley, Calif., Nov. 14–16.
Hartman Group. 2013c. Modern Eating: Cultural Roots, Daily Behaviors.
Hartman. 2013d. Health & Wellness: A Culture of Wellness.
Hartman. 2013e. Sustainability: When Personal Aspirations and Behavior Diverge.
Hartman. 2014. Organic & Natural.
HealthFocus. 2013. 2013 HealthFocus U.S. Trend Study. HealthFocus Intl., St. Petersburg, Fla. healthfocus.com.
IDDBA. 2015. What’s in Store. International Dairy-Deli-Bakery Assoc. Madison, Wis. iddba.org.
IFIC. 2011. Breakfast Focus Group Report. International Food & Nutrition Information Council. Washington, D.C. foodinsight.com.
IFIC. 2014. Food & Health Survey.
IRI. 2010. Lower Income Shopper. Information Resources Inc. Chicago. infores.com.
IRI. 2013. New Product Pacesetters.
IRI. 2014. New Product Pacesetters.
IRI. 2015. “Promise Poking Through for CPGs.”
IPA. 2012. “Top Pasta Consuming Countries.” International Pasta Assoc. Rome, Italy. internationalpasta.org.
Jacobsen, J. 2015. “2015 New Product Development Outlook.” Beverage Industry 106(1): 56, 58-60, 62, 64, 65.
Mintel. 2012. Cooking Enthusiasts—U.S. Oct. Mintel Intl., Chicago. mintel.com.
Mintel. 2013. Dry Pasta, Rice, Noodles and Ancient Grains—U.S. Feb.
Mintel 2014a. Ethnic Foods—U.S. Jan.
Mintel 2014b. Cooking Sauces, Marinades and Dressings—U.S. Dec.
Mintel. 2014c. Nutritional Food and Drink—U.S. Jan.
MSI. 2013. 2013 Gallup Study of Children’s Snack Habits. Multi-sponsor Surveys Inc., Princeton, N.J. multisponsor.com.
MSI. 2014a. The 2014 Gallup Study of Cooking Knowledge & Skills.
MSI. 2014b. The 2014 Gallup Study of American Snacking Behavior.
MSI. 2014c. 2014 Gallup Study of Nutrient Knowledge & Consumption.
NBJ. 2014. “Is Sports Nutrition Its Own Worst Enemy?” Nutr. Bus. J. XIX(3): 1–5
NFI. 2013. “Top 10 Consumed Seafood.” National Fisheries Institute, MacLean, Va. aboutseafood.com.
Nielsen. 2014a. “Consumer Confidence: Concerns and Spending Intentions Around the World. 2rd Quarter, 2014. Nielsen, Schaumburg Ill. nielsen.com.
Nielsen. 2014b. “Nielsen Fresh Perishables Fresh Facts’ Total U.S. Weeks Ending 3/29/2014 vs. Year Ago.”
Nielsen. 2014c. “Fresh Foods Are CPG’s Gateway to the Hispanic Community.”
Nielsen. 2015. Nielsen Global Survey: Snack Occasions and Trend Spotting.
NPD. 2013a. “Boomers Increase Restaurant Visits While Millennials Cut Back.” Press release, Jan. 15. NPD Group, Port Washington, N.Y. npd.com.
NPD. 2014a. “Where Is Fresh Headed?”
NPD. 2014b. 28th Annual Report on Eating Patterns in America.
NPD. 2015. “What Consumers Have in Their Kitchens.” Press release, Feb. 25.
NRA. 2014. What’s Hot Chef Survey. National Restaurant Assoc., Washington, D.C. restaurant.org.
NRA. 2015. Restaurant Industry Forecast.
Packaged Facts. 2014a. Kids’ Food and Beverage Market. Jan. Packaged Facts, Rockville, Md. www.packagedfacts.com.
Packaged Facts. 2014b. Food Formulation Trends: Ingredients Consumers Avoid. Feb.
Packaged Facts. 2014c. What America Eats. Nov.
Packaged Facts. 2014d. Hispanic Food Shoppers in the U.S. June.
Packaged Facts. 2014e. Food Formulation Trends: Ingredients Consumers Avoid. Feb.
Packaged Facts. 2014f. Weight Management: U.S. Consumer Mindsets. Aug.
SFA. 2014a. The State of the Specialty Food Industry. Specialty Food Assoc. New York, N.Y. specialtyfood.com.
SFA. 2014b. Today’s Specialty Food Consumer.
Sloan, A. E. 2015. “East Meets West in Next-Generation Asian Food.” Food Technol. 69(3): 14.
Technomic. 2013a. The Flavor Consumer Trend Report. Technomic Inc., Chicago. technomic.com.
Technomic. 2013b. The Breakfast Consumer Trend Report.
Technomic. 2014a. The Consumer Healthy Eating Report.
Technomic. 2014b. The Snacking Occasion Consumer Trend Report.
U.S. Census Bureau. 2010. Washington, D.C. uscensus.gov.
U.S. Dept. of Health and Human Services. 2013. Summary Health Statistics for U.S. Children. Dept. of Health and Human Series. Series 10, No. 8. Dec. www.cdc.gov/nchs/data/series/sr_10/sr10_258.pdf.
Wyatt, S. L. 2014. “The State of the Snack Food Industry.” Presented at SNAXPO Snack Food Assoc. Annual Meeting, Dallas, March 1–4.