Food Consumption Changes in South Africa Since 1994
Over the past 20 years, South African consumers have moved toward a Westernized diet—eating more meat, fats and oils, snacks, and soft drinks and less vegetables.

Food consumption is affected by food availability, accessibility, and choice. Changes in 1994 in South Africa dramatically affected food consumption patterns and continue to do so. Among others, there has been significant growth of supermarkets, rising urbanization, and growing per capita incomes are expected to double the demand for high-value foods.
Comparative food consumption information is useful in identifying trends in foods and eating patterns nationally. In the largest and only national food consumption survey conducted in South Africa (in 1999), the most commonly consumed food items of children aged 1–9 years old were maize, sugar, tea, whole milk, and brown bread. According to a secondary study of dietary surveys by Steyn et al., the most commonly consumed food items by the South African adult population were maize, sugar, tea, bread (brown and white), non-dairy creamer, brick margarine, chicken meat, full-cream milk, and green leaves.
South Africans are moving toward a more Western-oriented diet. For example, sugar intake as a percentage of total energy intake was 12.3% in urban areas for adolescents and adults, which is above the World Health Organization’s (WHO) recommendation for the prevention of dental caries. South Africans also consume salt at levels of 8.1 g/day—nearly double the WHO recommendation of 4–6 g/day. South Africans have also shifted to eating on the move.
Owing to the lack of regular national food consumption surveys or comparable food consumption survey data, the objective of this study was to establish, through the use of two databases, the broad food and beverage consumption shifts in South Africans since 1994.
Study materials and methods
Euromonitor International © Passport databases (Euromonitor PFBC) and Food and Agriculture Organization of the United Nations Statistics Division Food Balance Sheets (FAOSTAT FBS) were selected for this study because they both offer accessible, comprehensive, and comparable national data on food items consumed. Both sets of exported data were converted to per capita consumption figures, which take into account increases in population growth over time. Per capita intake is a crude estimate of consumption. It is the total amount consumed divided by the total population and does not take into account wastage, losses in storage, urban/rural distribution differences, or distribution within households. Intervals of five years were compared from 1994 to 2009 for FAOSTAT FBS data and from 1999 to 2012 for Euromonitor PFBC data. The food items were categorized into eight food categories: 1) meat, eggs and fish; 2) cereals; 3) vegetables, fruits and nuts; 4) dairy; 5) fats; 6) sugar and stimulants (coffee and tea); 7) packaged foods; and 8) soft drinks. Each of these food category sets was then compared and analyzed to determine the consumption trend over the specified period.
 Meat, eggs, and fish
Consistent with other studies, FAOSTAT FBS data indicate that South Africans consumed 18 kg more of meat per annum in 2009 than they did in 1994. This increase is mainly as a result of significant increases (>109%) in consumption of poultry meat and pork, with beef, mutton, and goat meat consumption remaining relatively stable. However, the Euromonitor PFBC data indicate a slight decrease in meat consumption from 1999 to 2012. The difference is because the Euromonitor PFBC meat data do not include consumption of processed meats. Therefore, the total data set suggests that value-added processed meat consumption has increased significantly since 1994.
Egg consumption, consistent across both data sets, has increased by 55.8% and 24.1% from 1994 to 2009 and 1999 to 2012, respectively.
Fish consumption increased by more than 26% in both the FAOSTAT FBS and Euromonitor PFBC data sets.
--- PAGE BREAK ---
Cereals
Consistent with several food consumption surveys, the FAOSTAT FBS data suggest the largest contributors to total food and cereal consumption for South Africans in 2012 were maize (104 kg/capita/year) and wheat (60.9 kg/capita/year). A slight decrease of 4.6% was seen for maize consumption from 1994 to 2009, which is expected to continue into 2020 as household incomes continue to increase and consumers move toward higher-value food items. Only rice and oats showed significant increases in consumption of 48% and 83.3%, respectively, since 1994.
Vegetables, fruits and nuts
Inadequate fruit and vegetable consumption is a problem worldwide as well as in South Africa. South Africans are eating slightly more fruit than in 1994 with both data sets showing about a 6% increase led mainly by increases in banana, apple, and grapefruit consumption. Unfortunately, vegetable consumption has dropped slightly. However, tomato and onion consumption increased moderately. Consumption of potatoes increased according to both sets of data. The consumption of pulses increased as a result of a moderate increase in bean consumption.
 Dairy
Dairy
According to both sets of data, dairy consumption increased by >8% over the time periods reviewed. Some significant shifts, based on the Euromonitor PFBC data specifically, are increases of 18.5% and 6.8% in cheese and fluid milk consumption, respectively, and a more significant increase of 73.7% in yogurt and sour milk products consumption since 1999.
Cheddar is by far the most popular type of unprocessed cheese in South Africa followed by Gouda and mozzarella. In terms of consumption of fluid milk products, cow’s milk consumption increased by 7.3% with a larger increase of 16.7% in value-added flavored milk products over the same period.
Fats
South Africa’s Food Based Dietary Guidelines recommend eating fats sparingly. However, as with studies indicating increases in fats and oils consumption in South African and other developing countries, both data sets indicated increasing trends of >28.5%. These increases are mainly related to increases in vegetable oils (>29.6% both data sets) and oil crops consumption (108.3%, FAOSTAT FBS data), coupled with a decrease in animal fat consumption of 53.8% (FAOSTAT FBS data specifically).
Sugar and stimulants
A positive trend in food consumption shifts since 1994 is that consumption of sugar and sweeteners as raw sugar or natural sweeteners (e.g., honey) declined by at least 7.5% according to both data sets. However, the Euromonitor PFBC data indicated an overall increase in consumption of 7.1% because this data set includes intake of sugar and sweeteners when used as ingredients in processed foods. There has been a large increase of 33.1% in consumption of sugar and sweeteners through consumption of processed foods which use sugar and sweeteners as ingredients.
Consumption of coffee and tea in South Africa has increased by 54.5% and 44.4%, according to both sets of data. Consumption of spices has doubled since 1994.
Packaged foods
In recent years, there has been an increase in sales of almost all categories of packaged foods and beverages in South Africa, resulting in a vibrant packaged food and beverage sector, which has grown by 57% to ZAR143 billion and by 15% in volume to 5,202,000 tons from 2007 to 2012.
The largest packaged food category in terms of per capita consumption is the bakery sector, which contributed 43 kg/capita/year in 2012 and increased slightly by 6.4%. For baked goods, bread consumption is the largest contributor where a slight increase of 4.7% was observed, mainly as a result of an increase of 27.9% in artisanal or unpackaged bread consumption. At the same time, conventional/industrial bread consumption decreased by 9.3%. Consumption of biscuits, both savory and cracker type biscuits as well as sweet biscuits, increased by more than 50%. Consumption of breakfast cereals (hot and ready-to-eat) has increased by more than 42.9% since 1999.
The next largest packaged food category in terms of consumption was canned/preserved food at 3.9 kg/capita/year in 2012. A decline of 13.3% in consumption from 1999 to 2012 was observed in line with global declines in consumption of canned foods due to the perception that they do not meet requirements for fresh, quality ingredients, convenience, or eco-friendliness. The only two categories in canned/preserved foods that grew in consumption (by 50%) were beans and ready meals.
The third largest category at 3 kg/capita/year in 2012, increasing from 1.9 kg/capita/year in 1999, was sauces, dressings and condiments. This category experienced a significant growth of 57.9% with table sauces driving most of the consumption increases at 73.3% growth from 1999 to 2012. Consumption of tomato sauce/ketchup and salad dressings has more than doubled since 1999 and consumption of mayonnaise grew by 50%.
Sweet and savory snacks consumption, also at 2.3 kg/capita/year, experienced significant growth of 53.3% between 1999 and 2012 with both crisps and extruded snacks experiencing increases in consumption of more than 33%.
--- PAGE BREAK ---
Soft drinks
Consistent with other studies, South Africans are increasing their consumption of soft drinks, especially in urban areas, which is concerning due to its association with obesity and non-communicable diseases.
Total soft drink consumption increased by a dramatic 68.9% from 55 L/capita/year in 1999 to 92.9 L/capita/year in 2012. The largest category of soft drinks is carbonated beverages at 67.5 L/capita/year, which increased (41.2–100%) between 1999 and 2012. Low calorie/kilojoule cola carbonated consumption increased by 45%, but unfortunately remains a small contributor to the overall carbonated consumption at <4.3% of total carbonated drinks in 1999 and 2012. The second largest category at 9.2 L/capita/year is fruit/vegetable juice, which grew by 44% between 1999 and 2012, indicating consumers are making healthier choices.
Bottled water in South Africa, similar to the rest of the world, experienced a dramatic growth of 315% after 1999 to contribute 8.3 L/capita/year in 2012. This is still significantly lower than the 2003 global average of 22.7 L/capita/year. Two new categories that have experienced a dramatic 600% growth from 1999 to 2012 are sports and energy drinks (from 0.3 to 2.1 L/capita/year) and ready-to-drink tea (from 0.1 to 0.7 L/capita/year), albeit among a small population and still low compared to that of developed countries.
Conclusion
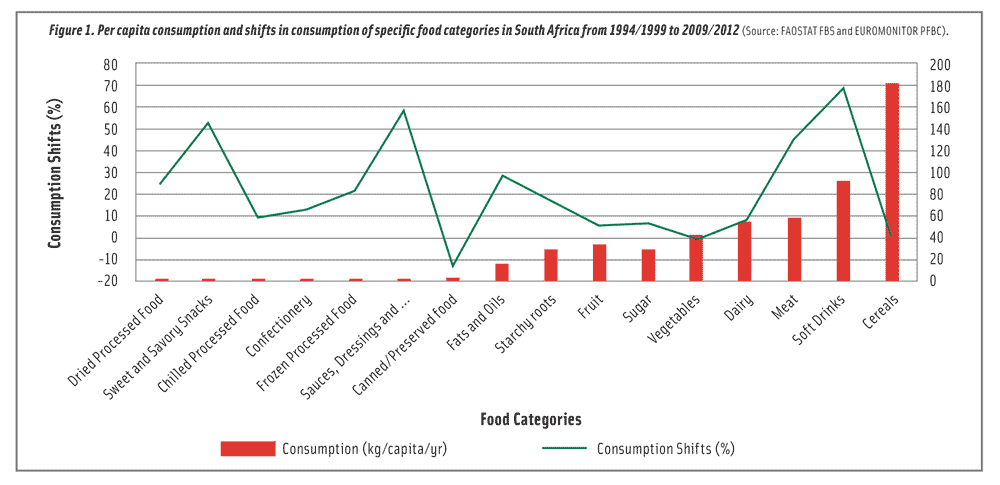
The most significant shifts (>30% increases) in food items consumed from 1994 to 2012 (Figure 1) were observed for meat, fats and oils, sauces, dressings and condiments, sweet and savory snacks, and soft drinks. Convenience, health and wellness, and indulgence were the main consumer drivers for these increases in consumption.
 The food consumption changes in South Africa observed in this study are a shift toward a diet of:
• sugar-sweetened beverages
• increased proportions of processed and packaged food including edible vegetable oils
• increased intake of animal source foods
• added caloric sweeteners
• decreased vegetable consumption
These shifts in food choices are concerning for public health because of selected food items contributing to fat, sugar, sodium, and total kilojoule (calorie) intake. Further regulations related to food composition and/or labeling as well as consumer demand for healthier, affordable products will require advances in science and technology by the South African food and beverage industry.
This article was originally published in FST (South African Food Science and Technology) magazine (May 2016, Vol. 5, No. 2) (www.safst.co.za) and is reprinted courtesy of SAAFoST (South African Association for Food Science & Technology) (http://www.saafost.org.za).
Lisa-Claire Ronquest-Ross is Global Head of Product Development, Mars Food, based in the Netherlands ([email protected]). Previously, she was R&D Director for Mars Food South Africa in Cape Town.
References are available from the author upon request.
