
What, When, and Where America Eats
A new megatrend focused on gourmet convenience, interest in more plant-based fare, and a need for more complete grab-and-go meal solutions are among the factors creating fundamental shifts in Americans’ eating behaviors.
Article Content
Increasingly, U.S. consumers are foodies with an on-the-go lifestyle, and that is translating to food choices that are more experiential, convenient, and impulse-driven. However, while more consumers want to savor their food experiences and the numbers of those who really enjoy cooking—or consider themselves recreational cooks—are at an all-time high, they still often simultaneously seek simplicity and ease of preparation, creating a new fundamental food selection factor best described as “gourmet convenience.”
While 83% of consumers say that taste has a great impact on their food choices, followed by price, which is cited by 68%, and healthfulness, noted by 60%, they feel less strongly about these factors than they did in 2014. The number of consumers citing the preceding attributes is down 7%, 5%, and 11%, respectively (IFIC 2015). In contrast, convenience and sustainability, which have a significant impact on food choices for 52% and 35%, respectively, have remained strong and stable over the past four years (IFIC 2015).
Four out of 10 adult eating occasions involve a more sophisticated, culinary-driven experience, and that is true for a third of snacking occasions and 29% of children’s eating occasions (Hartman 2014a). Forty-seven million adults define themselves as foodies, and 29 million are further categorized by Packaged Facts as being part of a highly involved, serious culinary core group. Millennials account for 36% of this dedicated group and Baby Boomers for 32% (Packaged Facts 2015a).
It appears that a growing number of consumers are adventurous in their choices, and some even think of dining as a form of artistic expression. Over the past five years, the number of consumers who like to try new drinks jumped 34%, the number who enjoy trying new recipes was up 32%, and the number of those who enjoy food presented as an “art form” climbed by 20%. In addition, the number who said they really enjoy cooking increased by 16% (Packaged Facts 2015a).
Two-thirds of adults now buy specialty/gourmet foods for everyday meals at home, and 39% do so for everyday snacking (SFA 2014). Sales of specialty foods reached $106 billion in 2014. Among the top 10 largest categories, candy/individual snacks posted gains of 27.2% over the past two years, followed by fresh and frozen meat/poultry/seafood, up 26.8%, and chips/shelf-stable snacks, +24.6% (SFA 2015). Some smaller gourmet product categories are growing even faster. These include refrigerated pasta, +78%; eggs, +76%; and refrigerated pasta/pizza sauces, +61%. Teas were new to the top 10 list in 2015 (SFA 2015).
Figure 1.

Figure 1.
Grab-and-go meal solutions were estimated at $17.3 billion in multi-outlet and convenience stores by IRI for the year ended Jan. 25, 2015, up 3.7%. Sales of refrigerated handheld nonbreakfast entrées jumped 10.3%; nutrition bars, +9.9%; and frozen handheld breakfast entrées, +6.8% (IRI 2015a).
Just over one-quarter of consumers eat four or five mini meals daily; 21% eat on the run (Wyatt 2015a). Half of all eating occasions are snacks, according to Hartman data (2014a).
Immediate consumption—defined as occasions when food or drink is consumed within an hour of purchase—accounts for 16% of all eating occasions and for 40% of all Millennial eating occasions that do not take place in restaurants (Hartman 2014a, FMI 2015a). Fresh is the most important snack criteria, followed by flavorful and indulgent (Nielsen 2015a).
While the front end remains the largest impulse purchase area in the store, savvy packaged goods marketers are tapping into new in-store merchandising opportunities. Mars Chocolate and Wrigley, two business units of Mars, are targeting other checkout areas, including pharmacies and cafés, and are also focusing on “buy online, pick up in store” models. The company describes its optimal checkout merchandise mix as follows: 51% foods/beverages that refresh (e.g., mints, bottled water); 39% products that reward (e.g., candy); and 10% items that might have been forgotten (e.g., batteries) (Anon. 2015a).
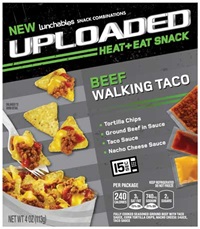 Fast and easy portable meal solutions, restaurant/chef crossovers, simplicity/fewer ingredients, homemade/handcrafted quality, power/performance, and bold flavors were the driving forces behind some of the most successful new product introductions. Lunchables UPLOADED, with year one sales of $143 million, was the best-selling new food or beverage introduced in 2014 (Figure 1; IRI 2015b).
Ben & Jerry’s Cores ice cream/sorbet, Breyers Gelato Indulgence, Cheerios Protein ready-to-eat cereal, Chili’s At Home frozen dinners, Chobani Oats Greek yogurt, Dole Chopped Salad Kits, refrigerated Giovani Rana pasta, Synergy Kombucha teas/coffee, Oscar Mayer Deli Fresh BOLD, and York Minis minty chocolates are currently the front-runners for the best sellers of 2015 (IRI 2015b).
Yogurt tops the list of foods/beverages that are consumed more today than 10 years ago, followed by bottled water, pizza, poultry sandwiches, Mexican food, fresh fruit, bars, frozen sandwiches, chips, and pancakes (NPD 2014a).
Over the past 10 years, consumption of fresh foods grew 20% to more than 100 billion “eatings” per year. The NPD Group (2015a) projects fresh eatings will exceed 120 billion per year by 2018, with fresh breakfast eatings up 9%; lunch, +7%; and dinner, +5%. Nearly one-third of consumers made a strong effort to eat more minimally processed foods last year (MSI 2014a). In 2014, 39% of consumers indicated they were eating less processed food than they were a few years ago (Packaged Facts 2014a).
Sourced From Home
An increase in the number of meals prepared and eaten at home and a corresponding decline in restaurant usage is one of the single biggest changes in eating patterns in America over the past five years (NPD 2014a). Americans bought 191 meals per person at restaurants for the year ending August 2014, the slowest pace of eating out since 1993 (NPD 2015b).
Total foodservice visits were flat for the year ending May 2015. Quick-service restaurant (QSR) visits—including retail and fast-casual eateries—grew 1%; visits to casual dining restaurants, which have declined over the past five years, held stable. Visits continue to slide at quick-service hamburger chains, midscale/family dining eateries, and independent restaurants (NPD 2015c).
Breakfast/morning meal visits are setting the pace, up 4% for the year ending May 2015. Lunch and dinner visits were flat; traffic during the p.m. snack daypart declined by 2% (NPD 2015d).
Those aged 25–34 are making 50 fewer visits per person per year to restaurants than they did in 2007, those aged 18–24 are making 33 fewer visits. Millennials ate eight more meals at home in 2014 compared with the prior year, while all others ate one additional meal at home (NPD 2015b). Families with kids, which represent 32% of U.S. households and $83.7 billion of total restaurant sales, made one billion fewer visits to restaurants over the past six years (NPD 2014b).
Hispanics’ per capita spending at restaurants increased 4% in 2014. Hispanics are more likely to dine out with children, doing so 40% of the time versus 29% for non-Hispanics (NPD 2015e).
Among the top 15 largest U.S. restaurant chains, Chipotle Mexican Grill posted the biggest sales gains in 2014, +17.6%. It was followed by Chick-fil-A, Starbucks, and Panera Bread. McDonald’s struggled last year, with sales down 1.1%. Other chains reporting a downturn included Subway, Pizza Hut, and Wendy’s (Technomic 2015).
When all the numbers are in for 2015, Technomic expects sales at limited-service restaurants to increase by 3.7% for the year. The Asian/noodle sector is projected to lead growth, followed by Mexican, coffee/café, chicken, and bakery café. The pizza, sandwich, and burger segments are expected to underperform (Technomic 2015). In the full-service sector, where the forecast is for overall sales growth of 3.5%, steak restaurants will lead the way.
Freddy’s Frozen Custard & Steakburgers, Marco’s Pizza, Jersey Mike’s Subs, Dickey’s Barbecue Pit, and Chipotle Mexican Grill were the fastest-growing limited-service chains in the United States in 2014. Twin Peaks, Seasons 52, Chuy’s, Tilted Kilt Pub & Eatery, and Fogo de Chão were the fastest-growing full-service chains (Technomic 2015).
Mealtime Patterns and Behaviors
During an average week, consumers eat dinner at home 5.7 times (FMI 2015a). Only 28% of family eating occasions include kids (Hartman 2014a). With children and parents eating alone more often, kid-specific meal options will come into vogue.
Millennials prepared dinner at home an average of 4.5 nights per week in 2014; Gen Xers, 5 nights; boomers, 5.1 nights; and those 65+, 5.2 nights (FMI 2015a).
More than one-third (36%) of consumers prepare foods that stretch their meat dollars more often than five years ago. In addition, 29% are preparing more one-pot meals; 24%, more stir-fry dishes; and 28%, more dishes that can be prepared in fewer than 20 minutes (FMI 2015b). Four in 10 meal preparers use ready-to-eat and heat-and-eat meats at least once a week, and use of fresh value-added meats gained ground in 2014. Four in 10 shoppers have purchased organic meat in the past three months (FMI 2015b).
Figure 2.

Figure 2.
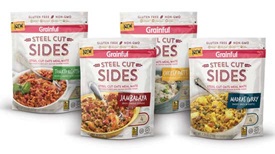
U.S. consumers may be cooking frequently, but that doesn’t mean that they are embracing cooking from scratch. (See Figure 2 for some statistics on how cooking from scratch patterns have changed in recent years.) Sales of Birds Eye Steamfresh side dishes totaled $50 million, up 6% in 2014 (Petrak 2015a). Nearly half (46%) of meal preparers buy dry rice mixes with seasonings; 28% buy frozen pasta; and 25% purchase refrigerated pasta (Mintel 2014a).
Twenty-eight percent of consumers are preparing ethnic foods more frequently than five years ago (FMI 2015a). One-third (35%) of consumers prepare Mexican meals from scratch; 28% use packaged meals/kits. For Asian meals, 20% of consumers prepare them from scratch and 25% use packaged meals/kits (Mintel 2014b).
Value-added vegetables, value-added fruits, cooking greens, specialty fruit, avocados, and pineapples are six of the top 10 fastest-growing categories across the entire store over the past five years (Nielsen 2015b). Complete salad kits, up 29% to $700 million for the year ended June 27, 2015, have brought new life to the $3.4 billion fresh-cut salad category (Nielsen 2015b).
When it comes to fruit and vegetable choices, Americans tend to favor the familiar. Bananas were the most purchased fresh fruit in 2014, followed by apples, grapes, strawberries, oranges, watermelon, peaches, blueberries, and lemons. Grapefruit fell out of the top 20 most purchased fresh fruits, and mangoes moved up (Anon. 2014). Tomatoes were the most purchased vegetable, followed by potatoes, onions, carrots, bell peppers, broccoli, celery, cucumbers, lettuce, salad mix, corn, mushrooms, cabbage, garlic, and spinach (Anon. 2014).
More than half (57%) of grocery shoppers buy fresh ready-to-eat items (e.g., rotisserie chicken, sandwiches, sushi) often or sometimes (FMI 2014). Deli sides continue to lead volume sales growth of prepared deli meal components, followed by appetizers, prepared chicken, entrées, soups, salads, and desserts. Deli fresh sushi sales volume rose 10.6%; snacks, sandwiches, and breakfast foods were also up (Driggs and Chanil 2015).
Millennials, those aged 65-plus, and lower-income households (especially those with children) are the heaviest users of frozen meals, whose sales have been declining for the past three years (Nielsen 2015c). Hot spots in the freezer case include frozen fruit, frozen vegetables, frozen soup, and grab-and-go breakfast meals (Nielsen 2015c).
Breads, Desserts, and Treats
Bread—in myriad varieties—remains a household stapIe. In 2014, two-thirds of consumers bought tortillas; 42%, wraps/flatbreads (nonethnic); 41%, croissants; 41%, Italian breads; 37%, seasonal breads; 36%, European loaf bread; 36%, flavored/artisan breads; 35%, Middle Eastern breads; 29%, egg-based breads; and 28%, pretzel bread (Mintel 2014c).
Best sellers in the fresh bakery category are breads, cakes, cookies, and rolls. Desserts account for half of in-store bakery sales; leading product categories include cakes, followed by cookies, sweet goods, brownies/snack bars, and specialty desserts. Specialty desserts and brownies/dessert bars show the highest sales growth (IDDBA 2015).
Single-servings/smaller portion sizes, unique brownies, celebration cakes, signature/specialty treats for everyday use, seasonal specialties, gourmet muffins/scones, and gluten-free or sugar-free options were the biggest in-store bakery gainers (Chanil and Major 2015). Spoonable/soft desserts, layered desserts, hand pies, hybrids (e.g., cronuts, duffins), crepes, dessert butters, and Midwestern desserts (e.g., cobblers) are other hot bakery trends (IDDBA 2015). In the packaged bakery aisles, bakery snacks top the list of the fastest-growing categories, followed by pastry/donuts, pies/cakes, and English muffins (Peckenpaugh 2015a).
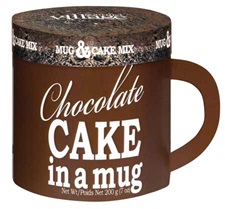 When defined as part of a meal, dessert appears to be a disappearing trend, but when dessert is defined by type of food, consumption of these sweet treats remains strong and steady across all dayparts and is rising in the evening (NPD 2015f). Gourmet du Village’s Cake in a Mug makes two microwaveable grab-and-go “mug cakes” with the addition of an egg, water, and oil. It’s the kind of easy but tasty treat that aligns perfectly with the gourmet convenience concept.
After fruit and cookies, ice cream is America’s most popular dessert and is eaten regularly as a snack by 54% of Americans (Packaged Facts 2015b). All-natural frozen desserts, gelato, and unique handheld frozen treats are hot frozen dessert trends (Packaged Facts 2015b). More than half (56%) of consumers regularly eat cookies/biscuits as a snack; 49% opt for crackers/crispbreads; and 20%, snack cakes/cupcakes (Nielsen 2015a). Panna cotta, s’mores, shortbread, mini tarts, and ganache were among the trendy desserts in restaurants in 2014 (Datassential 2014).
Snacks, Mini Morsels, and Drinks
The average number of in-between meal snacks eaten daily per person increased from 1.9 in 2010 to 2.6 in 2015. Four in 10 adults (41%) eat three or more snacks daily, up from 21% in 2010 (Wyatt 2015a).
For the first time in more than five years, indulgent snack sales outpaced healthy in the $38 billion snack product category; indulgent snack sales were up 3.1% versus a 2.5% increase for healthy options (Wyatt 2015b). Other indulgent product categories that reported sales growth include candy, cookies, and ice cream (Levin 2015).
Chips, chocolate, cheese, cookies, fruit, crackers, and sandwiches (outside of a meal) are America’s most frequently consumed snacks (Nielsen 2015a). Salty snacks account for just over half (54%) of all sales growth. Over the past five years, savory snacks have outpaced sales of sweet options (Wyatt 2015a).
While still a small category, apple chips led snack category growth, with sales up 38.9%. Ready-to-eat popcorn sales were up 18.7%; dried meat snacks other than jerky, +14.3%; jerky, +12.8%; nutritional health bars, +10.4%; and sunflower/pumpkin seeds, +12.5% (Peckenpaugh 2015b). The superpremium/gourmet segment within snacks is showing explosive growth. One in 10 consumers buys snacks at upmarket retail locations (FMI 2015a).
Chocolate remains the largest confectionery category at $21 billion in sales in 2014, nonchocolate candy was $10.4 billion, and gum $3.1 billion; 84% of all gum sales are sugarless. Fruity treats, sour candies, gummies, bites/minis, and taffy were the top candy performers; seasonal products accounted for 21% of sales in 2014 (NCA 2015).
Just over half of consumers are looking for snacks that are good for them. Sales of organic snacks grew 11.6% in 2014 (Wyatt 2015a). Fresh produce snacks, carob-/yogurt-coated snacks, refrigerated smoothies, yogurt, and snack/granola bars were the top gainers among healthy snacks last year. Hormone-free and claims about the type of oil are among the fastest-growing snack claims (Wyatt 2014).
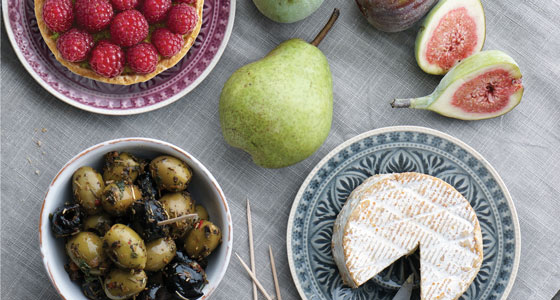
On-the-go snacks and convenient forms (e.g., string, chunks, slices, shreds, and spreads) are driving the packaged cheese sector (Packaged Facts 2014b). Although processed cheese still dominates sales, natural, ethnic, imported, artisan, and specialty cheeses as well as flavored, spreadable, and single-serve processed items like Laughing Cow snackable treats are enjoying brisk sales (IDDBA 2015). Consumption of reduced-calorie/light cheese and organic varieties are also on the rise; fat-free and low-fat are on the decline (IDDBA 2015).
While American and Italian varieties dominate packaged cheese, highly flavored and ethnic varieties led by pimento, mascarpone, queso varieties, pecorino Romano, Cotija, Asiago, and Edam are posting strong growth (IDDBA 2015). Cheese is the largest gourmet/specialty food category and the third-fastest-growing gourmet sector (SFA 2015). The fastest-growing cheeses in restaurants are taleggio, burrata, pecorino Romano, Hispanic Cotija, and queso fresco (Datassential 2015).
Finger foods and appetizer-like snacks are enjoying brisk sales. Frozen appetizer sales reached
$1.8 billion in 2014 (Petrak 2015b). Although salsa and hummus are very popular dips with 46% of adults, four in 10 adults are also very interested in cheese, spinach/artichoke, and seafood dips (Technomic 2013). Onion rings, mozzarella sticks, and potato skins are America’s favorite fried appetizers; breaded vegetables and stuffed mushrooms are posting strong gains (Technomic 2013).
Vegetarian tops the list of hot appetizer trends for 2015, followed by charcuterie/house-cured meats; ethnic street food–inspired appetizers (e.g., tempura, taquitos); seafood charcuterie; and high-end, chef-inspired appetizers and ethnic dips (e.g., hummus, tzatziki) (NRA 2014).
Half of snacking occasions involve both a drink and a snack. More than four in 10 adults purchased soft drinks, coffee, juice, tea, and milk shakes as snacks in 2014; more than one-third drank milk or smoothies; and 20% had an energy beverage (Technomic 2014a).
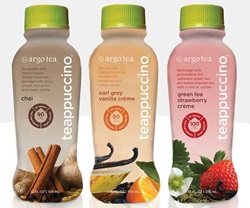 Although carbonated soft drinks, water, milk, and tea remain the largest beverage categories, ready-to-drink coffee is expected to lead sales growth for 2015, up 7%, followed by energy beverages, +6%; bottled water, +5.6%; sports drinks, +2.8%; and ready-to-drink tea, +2.7% (Hemphill 2015). Argo Tea’s Teappuccino line of indulgent hybrid tea drinks in varieties like Earl Grey Vanilla Crème are well positioned with only 80–100 calories per serving. Categories in which sales declines are anticipated when final figures are in for 2015 include value-added water, fruit beverages, and carbonated soft drinks (Hemphill 2015).
Single-serving brewed coffee made at home is another hot category. One-quarter (23%) of households owned a coffee pod machine in 2014 (NPD 2014c).
Disappearing Dayparts
While consumers make time for dinner almost every night of the week (6.5 times on average), they are skipping breakfast and lunch more often. On average, breakfast is still eaten at home 5.1 days per week (FMI 2015a).
IRI reports that a wide variety of breakfast foods are enjoying strong sales growth, led by ready-to-drink breakfast meals, bakery snacks, handheld frozen and refrigerated breakfast entrées, nutrition bars, nutritional snacks/trail mixes, pastry/doughnuts, and frozen breakfast entrées (Petrak 2015c).
When surveyed about what they consumed for breakfast in a recent two-week period, 92% of consumers reported eating ready-to-eat cereal at home; 90%, oatmeal; and 86%, yogurt/yogurt parfaits. Other frequent breakfast choices include fruit, bagels, smoothies/shakes, eggs, French toast, waffles, muffins, bacon, sausage, pancakes, and breakfast sandwiches (Datassential 2015).
Breakfast has been the driver for yogurt consumption; 56% of consumers ate yogurt in 2014. Greek yogurt accounts for more than half of yogurt purchases; 26% of consumers use yogurt drinks (Packaged Facts 2015c).
Sandwiches remain among Americans’ top choices at lunchtime. Not surprisingly, 62% of deli operators say they’ll be putting more emphasis on sandwich programs next year. Other areas of emphasis for deli operators include catering, hot/cold bars, soup stations, sushi, and concept food stations (Driggs and Chanil 2015).
Barbecue is a high interest sandwich trend for 63% of consumers. Upscale breads (e.g. brioche, pretzel bread), ethnic sandwiches (e.g., banh mi, tortas, Cuban), unique sandwich carriers (e.g., naan, bao, waffles), and pickled ingredients (e.g., giardiniera, onions, radishes) also make the list of attention-getters (Datassential 2015).
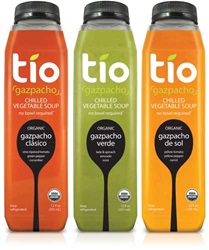 One-quarter of consumers ate soup at home at least once a week in 2014. While broth, stew, chowders, and chili are Americans’ favorite forms of soup, one-third of consumers would eat more soup if it contained a serving of vegetables, was heart healthy, or was high in protein (Technomic 2014b). Tio ready-to-drink chilled gazpacho soups are organic and free of preservatives and artificial ingredients, making them a good fit for health-oriented soup lovers.
Figure 3.

Figure 3.
Healthy Habits
More than eight in 10 consumers (83%) are concerned about the nutritional content of the foods they eat; 71% acknowledge that their diet is not as healthy as it could be. Four in 10 households have at least one member who is managing some kind of food-related illness (FMI 2015a). (See Figure 3 for a look at the frequently cited maladies.)
Despite growing interest in naturally functional food, fortified foods remain the backbone of many consumers’ nutritional strategies, and interest has remained strong and stable over time (MSI 2014a). One-third of consumers look for extra vitamins/minerals when shopping for food (FMI 2015a). The percentage of Millennials who say they’re very concerned with the nutritional content of their food shot up from 23% in 2011 to 37% in 2014 (FMI 2014). Interestingly, those who are making a strong effort to consume nutrients and to limit additives are also making an effort to eat more fresh foods, suggesting that these emerging fresh advocates could be receptive to fortification of fresh foods (MSI 2014a).
More than half of adults (56%) are making an effort to get more whole grains. Similar numbers seek more fiber and protein; and calcium, omega-3s, potassium, and probiotics also make the list of things consumers want to consume more of (IFIC 2015).
More than half of consumers say they are trying to avoid sugars in general. For added sugars, the total is 54%; sodium/salt, 53%; trans fats, 49%; HFCS, 48%; calories/saturated fat, 47%; cholesterol, 45%; preservatives, 37%; and MSG, 35%. More than one-third (37%) are avoiding aspartame; 33%, fructose; 31%, saccharin; and 25%, sucralose (IFIC 2015).
Nine of 10 adults say that information about fruit or vegetable content is important to them in determining if a food is healthy. That is followed by preservative-free, cited by 80%; added nutrients or no artificial sweeteners, each 78%; no antibiotics, 73%; unprocessed, natural, or hormone-free, each 72%; organic or non-genetically modified (GM), each 65%; clean, 60%; and real, 54% (Technomic 2014c).
Chemicals are now the No. 1 consumer food safety issue, up 13 percentage points versus 2014 (IFIC 2015). Sales of organic food/beverages jumped 11% in 2014 to $36 billion. Organic fruits/vegetables, dairy, packaged/prepared foods, beverages, snacks, condiments, and meat/poultry/fish posted double-digit growth (OTA 2015). One-quarter of adults buy organic to avoid GM components (Hartman 2014b).
 Although the core user base of those who are serious about gluten-free eating has expanded from 7.8% of the U.S. population in 2012 to 9.8% in 2014, interest in the gluten-free trend peaked in 2012 (Packaged Facts 2015d; Sloan 2015). The number of consumers who think that gluten-free is healthier fell from 46% in 2010 to 25% in 2014 (Packaged Facts 2015d). Surprisingly perhaps, “no reason at all” is the No. 1 reason consumers give for buying gluten-free products (Hartman 2015).
One-quarter of meal preparers are regularly making more meatless meals; more than three-quarters (76%) prepare meatless meals at least occasionally. Three-quarters serve eggs as an alternative to a meat-based meal; 61%, beans/lentils; 28%, quinoa/whole grains; and 24%, veggie burgers (FMI 2015b).
 Seventeen percent of adults are making some effort to follow a partially vegetarian diet; those aged 18–24 are most likely to do so; 2% avoided all animal products in 2014 (MSI 2014a). In 2015, 30% of food shoppers experimented with a specialized eating regimen: 8%, vegetarian; 7%, lactose-free; 6%, gluten- or dairy-free; 5%, raw; 4%, juice cleanse/detox or Weight Watchers; and 3%, Atkins diet, Mediterranean diet, Paleo diet, or vegan diet (FMI 2015a).
As Baby Boomers turn 65, they are projected to drive dollar sales of nutrition bars, energy drinks, sports drinks, and refrigerated tea products (IRI 2014). Boomers are also the No. 1 user of protein drinks for energy (Mintel 2014d).
For the first time, health was among the top reasons 145 million consumers bought specialty foods in 2014. Organic was the most sought after gourmet food claim; however, retailers predict non-GM will take its place within three years (SFA 2014).
U.S. functional food sales totaled $51 billion in 2014, up 7.8%, and are projected to reach $62.7 billion by 2018, according to Nutrition Business Journal (Anon. 2015b). Young adults are the most likely to use functional foods/beverages (64% versus 57% of consumers overall) (MSI 2014a).
High cholesterol is the top reason that consumers seek out functional foods, followed by weight loss, high blood pressure, digestive health, heart health, energy, and immunity (Packaged Facts 2014c). Members of one-quarter of U.S. households say that food restrictions, avoidances, intolerances, or allergies have an influence on what they eat (Packaged Facts 2014d).
A. Elizabeth Sloan, PhD, a professional member of IFT and contributing editor of Food Technology, is president, Sloan Trends Inc., Escondido, Calif. ([email protected]).
References
Anon. 2014. “FreshTrends.” The Packer, Vance Publishing, Lincolnshire, Ill. packer.com.
Anon. 2015a. “Wrigley & Mars Chocolate Share Vision for Future of Impulse Purchase.” Progressive Grocer, Nov. 13. http://www.progressivegrocer.com/node/87423?nopaging=1.
Anon. 2015b. “Functional Food Report.” Nutrition Business Journal. newhope360.com.
Chanil, D. and M. Major. 2015. “Bread Winners: Progressive Grocer’s 2015 Retail Bakery Review.” 94(5): 71, 72, 74, 75, 79–81.
Datassential. 2014a. “Food and Menu Trends From Datassential.” QSR 189(1): 4–25.
Datassential. 2015. “Menu Trends for 2015.” QSR 190(1): 4–17.
Driggs, J. and D. Chanil. 2015. “Operational Gains. Progressive Grocer’s 2015 Retail Deli Review.” 94(6): 144, 146, 148–151.
FMI. 2014. U.S. Grocery Shopper Trends. Food Marketing Institute, Arlington, Va. fmi.org.
FMI. 2015a. U.S. Grocery Shopper Trends.
FMI. 2015b. The Power of Meat.
Hartman. 2014a. The Hartman Group’s Eating Occasions Compass Database 2012-2014. The Hartman Group, Bellevue, Wash. hartman-group.com.
Hartman. 2014b. Natural and Organic Report.
Hartman. 2015. Health & Wellness 2015.
Hemphill, G. 2015. “State-of-the-Beverage Industry.” Press Release, Feb. 2. Beverage Marketing Corp., New York, N.Y. beveragemarketing.com.
IDDBA. 2015. What’s in Store? International Dairy Deli Bakery Assoc., Madison, Wis. iddba.com.
IFIC. 2015. Food & Health Survey. International Food & Nutrition Information Council, Washington, D.C. foodinsight.com.
IRI. 2014. “Aging America: Carving Out Growth in Mature Markets.” Times & Trends, June. Information Resources Inc. Chicago. infores.com.
IRI. 2015a. IRI’s Consumer Eating Behavior Survey.
IRI. 2015b. The 2014 New Product Pacesetters.
Levin, L. 2015. “Snacking & Treating: What We Learned That Will Surprise You.” Presented at the Sweets & Snacks Expo, Chicago, May 19.
Mintel. 2014a. Dry Pasta, Rice and Noodles—U.S. Feb. Mintel International, Chicago. mintel.com.
Mintel. 2014b. Ethnic Foods—U.S. Jan.
Mintel. 2014c. Bread and Bread Products—U.S. Sept.
Mintel. 2014d. Nutritional and Performance Drinks—U.S. Jan.
MSI. 2014a. The 2014 Gallup Study of Nutrient Knowledge & Consumption. Multi-sponsor Surveys, Princeton, N.J. multisponsor.com.
NCA. 2015. “State-of-the-Confectionery Industry.” National Confectioners Assoc., Washington, D.C. candyusa.com.
Nielsen. 2015a. Nielsen Global Survey: Snack Occasions and Trend Spotting. Nielsen, Schaumburg, Ill. nielsen.com.
Nielsen. 2015b. The Impact of Consumer Trends on the Produce Industry. Nielsen Perishables Group and United Fresh Produce Assoc.
Nielsen. 2015c. “Shelf Stoppers: Frozen Foods.” Progressive Grocer 94(6): 18.
NPD. 2014a. The 29th Annual Eating Patterns in America Report. The NPD Group, Port Washington, N.Y. npd.com.
NPD. 2014b. “Families with Kids: A Lost Opportunity for the Restaurant Industry.” Press release, Dec. 17.
NPD. 2014c. “Machines Make Room for the Newest Kids in the Kitchen Pantry.” Press release, Dec. 2.
NPD. 2015a. “U.S. Consumers Are Eating Nearly as Much Fresh Food as 30 Years Ago.” Press release, July 21.
NPD. 2015b. “Foodservice Spending Is Up but Visits Are Flat as Consumers Continue to Eat More Meals at Home.” Press Release, June 3.
NPD. 2015c. “Foodservice Visits Highest in Six Years and Higher Average Eater Checks Pump Up Consumer Spending.” Press release, July 28.
NPD. 2015d. “Classic Breakfast Fare Rides the Wave of Breakfast Visit Growth at Foodservice.” Press release, Oct. 5.
NPD. 2015e. “Five Consumer Trends Shaping the Future of the Food and Foodservice Industries.” Press release, May 7.
NPD. 2015f. “NPD Group Reports Dessert is Disappearing at Dinner Tables Across America.” Press release, Feb. 26.
NRA. 2014. What’s Hot Chef Survey. National Restaurant Assoc., Washington, D.C. restaurant.org.
OTA. 2015. “Quick Stats.” Organic Trade Assoc. Washington, D.C. ota.com.
Packaged Facts. 2014a. What America Eats. Nov. Packaged Facts, Rockville, Md. packagedfacts.com.
Packaged Facts. 2014b. Cheese. March.
Packaged Facts. 2014c. Functional Foods. Feb.
Packaged Facts. 2014d. Formulation Trends: Ingredients Consumers Avoid. Feb.
Packaged Facts. 2015a. Foodies in the U.S.: Opportunities for Restaurants and Retail. May.
Packaged Facts. 2015b. Ice Cream & Frozen Desserts in the U.S. Feb.
Packaged Facts. 2015c. Yogurt and Yogurt Innovation. Jan.
Packaged Facts. 2015d. Gluten-free Foods in the U.S. Jan.
Packaged Facts. 2015e. Nutritional and Cereal Bars in the U.S. Feb.
Peckenpaugh, D. J. 2015a. “State of the Industry: Bakery.” Snack Food & Wholesale Baking. 104(6): 12, 14–16, 18, 22
Peckenpaugh, D. J. 2015b. “State of the Industry: Snacks” Snack Food & Wholesale Baking 104(7): 12, 14, 16, 18, 21.
Petrak, L. 2015a. “Side Kicks.” Progressive Grocer 94(2): 62-63.
Petrak, L. 2015b. “Frozen Snacks’ Appetite for Success.” Progressive Grocer. 94(2): 54, 56, 58, 60.
Petrak, L. 2015c. “Top of the Morning.” Progressive Grocer (94)2: 52.
SFA. 2014. Today’s Specialty Foods Consumer. Specialty Food Assoc. New York. specialtyfood.com.
SFA. 2015. State-of-the-Specialty Food Industry.
Sloan, A. E. 2014. TrendSense Predictive Model Report. Sloan Trends, Escondido, Calif. sloantrend.com.
Technomic. 2013. The Starters, Small Plates & Sides Consumer Trend Report. Technomic, Chicago. technomic.com.
Technomic. 2014a. The Snacking Occasion Consumer Trend Report.
Technomic. 2014b. The Left Side of the Menu: Soup & Salad Consumer Trend Report.
Technomic. 2014c. The Consumer Healthy Eating Report.
Technomic. 2015. Top 500 Chain Restaurant Report.
Wyatt Lyons, S. 2014. “State of the Snack Food Industry.” Presented at SNAXPO Snack Food Assoc. Annual Meeting, Dallas, March 1–4.
Wyatt Lyons, S. 2015a. “State of Snacking.” March 31. IRI, Chicago. infores.com.
Wyatt Lyons, S. 2015b. “Snack Food State of the Industry” webinar. August 26. IRI.