
Big Data Gets Bigger and Better
FOOD SAFETY AND QUALITY

 From bytes to zettabytes, the amount and variety of data being collected, stored, and analyzed keep increasing, providing not only challenges to collection and storage but also promise of better analysis and use to predict and correct problems. Many types of data are constantly being generated, including records of food processing and distribution conditions, results of microbiological tests, results of genomic research, records of foodborne illness outbreaks, nutrient content information, and many other types of data. And the amount of data is becoming so large or complex that traditional data processing applications cannot deal with them. Big data—the term applied to this concept—has been utilized by companies, research institutions, and government agencies for years now and continues to be explored to gain more benefits for the food industry and its customers.
Carnegie Mellon University
Artur Dubrawski, director of the Auton Lab, Carnegie Mellon University, said that the lab researches new approaches to statistical data mining, specifically the underlying computer science, mathematics, statistics, and artificial intelligence of detection and exploitation of patterns in data. Government agencies routinely collect different kinds of data reflecting various issues regarding food safety, Dubrawski said, and researchers at Auton Lab have been working with them for years. Among other things, they have looked at a database of food consumer complaints maintained by the U.S. Dept. of Agriculture’s Food Safety and Inspection Service (FSIS), developed analytic components, read data, and evaluated the hypothesis that complaints may be probabilistically related to complaints by other consumers and may have the same underlying cause. The work resulted in a consumer complaint monitoring system. The researchers have also looked at other databases used by government agencies. A few years ago, the Centers for Disease Control and Prevention (CDC) joined the effort, isolating bacteria and viruses and tracing them back to food. Now, he said, both agencies can identify pathways of transmission from foods to humans quickly and perhaps develop better processes and policies to mitigate future events. He said that comprehensively analyzing the data can benefit society because agencies can be agile and informed and act more swiftly and, in some cases, more efficiently.
Machine learning, Dubrawski said, is a scientific method to make computers learn from experience. Traditionally, programmers write or modify programs, but now a computer can modify a program itself based on experience. Through artificial intelligence, a computer can automatically draw important patterns out of the data, analyzing it and learning from it. Machine learning is used as a platform for developing algorithms and predictive models. For example, artificial intelligence was used in developing a predictive model that looks at results of sanitary inspections. FSIS inspectors visit farms, slaughterhouses, processing plants, and other facilities at various intervals and collect data and samples of food to test for microbial contamination, residues, compliance with regulations, etc. The data and the results of the microbial tests are fed into a computer to develop a model that uses sanitary inspection results to predict how likely it may be for the facility to develop microbial contamination in the near future. The computer can then provide direction to the inspectors and help companies stave off any potential problems.
The data needs to be annotated by human experts to enable learning from it, Dubrawski said. On the other hand, the experts must review the most statistically significant trends identified in data, using machine learning to decide whether the trends are something new or a manifestation of something already known. Consumer complaints are also an important input, but the difficulty is that the data is often not very complete. Not everybody complains or sees physicians when they develop symptoms of food poisoning, he said. But even if sparse and low in quantity, the consumer complaints are valuable in that they may be a representation of something that went wrong in the supply chain. Anomaly detection is also important, identifying multiple data points that don’t fit the model; the data may form a systematic pattern of departure from expected activity and indicate a new food safety issue.
One challenge, he said, is how to implement policies that may result from those data discoveries or change them to make them more effective. How much can data be trusted? Is some data blatantly missing or misleading? Is the data complete? There are real-world issues regarding data quality, missing data, and misleading data, he said, but statistics can be used to account for many of these discrepancies and mitigate their effect. There is no shortage of smart algorithms.
SAS Institute Inc.
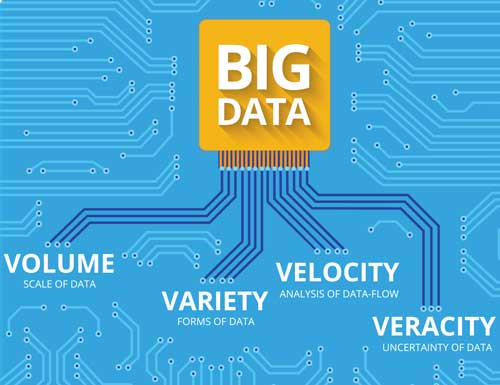
Dan Mitchell, director of global retail and consumer packaged goods practice, SAS Institute Inc., Cary, N.C. (sas.com), said that the retail and consumer packaged goods industries have been dealing with big data for a very long time, typically classifying its components as volume, variety, and velocity. He said that the volume of data is ever-growing and there is more data on an individual laptop computer today than there was in total 10 years ago. Companies must be able to adapt to the large volumes in the processing time frame needed to get answers. With regard to variety, he said that new varieties of data are hitting organizations every day, such as email, videos, images, audio, and data from devices and machines themselves. With regard to velocity, he said that in the past, managing data was batch-oriented, loaded every week or every night, for example. Now data arrives 24/7, and companies must be able to capture it as fast as it comes in, store it, and ask questions about it right away instead of waiting overnight.
Adopting a modern analytic process requires having the right infrastructure and skills to ascertain which data are important, Mitchell said. SAS offers companies and researchers a framework for digging into the data and pulling out relevant data so that it is sensed, understood, and acted on. Companies can then develop models to predict what the next action should be. He said that key areas that an organization, from top to bottom, needs to look at include visualization, analytics, and computing power. Will the data be viewed as spreadsheets, charts, reports, maps, or other means? So much is going on that if just a spreadsheet is used, users are not really finding the new trends or issues, he said. And because there is so much data, high-performance computing horsepower is now available to execute the analysis. Since there are potentially hundreds of variables, he said, SAS Institute staff can develop models that mathematically best describe a complex process, put those models into action to predict what might happen, and look for anomalous behavior.
Storage, he added, is important. Now that they have all the data, they need to determine the best place to keep it. Unstructured storage systems are appealing because they are economical and useful if people have a lot of data that they’re not sure is important but want to keep. As the data is refined, more-sophisticated structured storage, such as relational databases, would be more appropriate. Companies such as SAS Institute, IBM, TrendMiner, and others help organizations put together a strategy, decide the best place to store data, make changes, and adapt to changes. There’s always something new coming down the pike as to how to store, analyze, and visualize data, Mitchell said. The next big adoption curve is dealing with streaming machine-generated data rather than human-generated data as in the past.
A lot of the focus now is on being able to track and understand where a food is created, sourced, and distributed, he said. How long does it take to move a product through the distribution channel from the farm or processing plant until it gets to the grocery store or the dining table? What attributes of the product changed during the distribution? It is important to quickly understand the data and respond to any problem.
Sales data can be compared to illness outbreaks to quickly find out what product might be involved since sales patterns reflect consumption. Knowing the top-selling products in locations where outbreaks occur helps narrow down the potential causes very quickly and identify the vendor, distribution center, etc., that might be suspect. The results could potentially predict a risk in the future.
 The major challenge for organizations regarding big data is twofold, Mitchell said. One is finding the best ways to visualize the data, distilling it so it is easily understood. Another is having the skills and capabilities to mine big data and use statistics. Organizations have more data than people to mine answers from it. Historically, researchers would spend about 80% of their time collecting data through experiments and 20% analyzing it, he said. Now it’s the inverse—it’s easy to grab and collect data but analyzing the data becomes more complex. Analyzing so much data and such a variety of data requires skills that a lot of organizations don’t have. A new era is emerging of being able to leverage machine data, he said. It’s rapidly moving, requiring more technological skills and data science experience.
--- PAGE BREAK ---
TrendMiner
Bert Baeck, cofounder and CEO of TrendMiner N.V., Hasselt, Belgium (trendminer.com), said that there are seven dimensions to big data:
• Volume. The amount of data being generated is high and growing exponentially.
• Velocity. The speed at which data must be accessed and placed into databases is increasing; the speed for process-oriented behavior such as temperature and flow rates is in seconds.
• Variety. Both structured data (manually entered) and unstructured data (collected from instruments and devices) can be used to analyze process behavior; examples are pressure, temperature, flow rate, alarms, batch information, etc.
• Variance. Data may come from several different plants and may vary even within the same plant throughout the day.
• Veracity. Is the data accurate and consistent?
• Visualization. Graphs are easier to understand than spreadsheets, for example.
• Value. This is the endgame, what a company wants to get out of its big data. Machine learning is a way to help get the value.
Baeck explained that a food company gathers data, which might be stored in a centrally available historian database. Through use of descriptive or discovery analytics, the data can be reviewed to answer questions such as “Have I seen similar behavior before?” “How often?” “Which plant?” etc. Preferably this is done through time-series data visualization, he said, allowing the user to graphically see process performance, good or bad. The next step is diagnostic analytics to answer why a process deviation occurred and what can be identified as the root cause. The actual production can be monitored against knowledge of the best process behavior that produces a “golden profile” or “golden batch.” This comparison of actual performance to similar behavior in the past is provided instantly, predicting how the process will evolve. This is called predictive analytics, allowing prediction of food quality based on actual production process data. In the past, Baeck said, it was all based on hindsight, not looking forward.
TrendMiner produces software, primarily for process manufacturing, that uses pattern recognition to see if the same process behavior occurred in the past and uses it for prediction purposes. The software uploads the data from all sensors (temperatures, flows, pressures, etc.) stored in the client’s historian databases, indexes the data, and breaks it down with built-in data analytics tools.
There are two types of approaches to data mining, Baeck said. One is helping the subject matter expert with no computer background, and the other is helping the data scientist with a background in computer science and math but no background in the subject matter. The software allows entry of data without the need to build data models, helping the subject matter expert to use the software for self-service analytics. The software can also be used as input to the data scientist, allowing him or her to build models using the process information provided through the software.
Baeck stressed that companies and process engineers need to become more aware of data analytics to gain the benefits that it can bring. They need to look at the big picture rather than think departmentally, such as only maintenance or food safety. They also need to learn from failure (such as undesirable process behavior and anomalies) and have a vision and strategy with clear communication from the top down and the bottom up to improve food quality, reduce waste, and reduce production costs.
IBM Research–Almaden
Kristen Beck, researcher at IBM Research’s Almaden lab in San Jose, Calif. (research.ibm.com/labs/almaden), said that researchers create 2.5 quintillion bytes of data every day—so much that 90% of the data in the world today has been created in the last two years alone. The data comes from everywhere: sensors used to gather climate information, posts to social media sites, digital pictures and videos, purchase-transaction records, and cell phone GPS signals, to name a few. This big data provides opportunity for insight.
 She said that IBM Research–Almaden employs cutting-edge machine learning; language, speech, and vision processing; and high-performance computing technologies to analyze trends, patterns, and relationships in data. This provides valuable insights from information to solve practical problems, find opportunities, and foster new discoveries. For example, rapid identification of contaminated items is vital to minimize illness and loss in a food safety outbreak, she said. Analysis of geo-coded data and confirmed case reports shows that the potential to reduce the time it takes to investigate an outbreak is significant, with as few as 10 laboratory-confirmed case reports narrowing the investigation to approximately 12 suspect products.
By taking this big data approach, she said, food companies and researchers could analyze all their available data—from farms, transport, processing facilities, and distribution channels to restaurants and grocery stores—to help them understand what triggers contamination and the spread of disease. This information could mitigate foodborne illness and other risks in food management. Microbiome DNA testing can also help producers track which healthy microbiomes help meats, fruits, and vegetables stay fresh longer on store shelves. That data could then be used to tailor farming or processing globally to promote microbiomes with preservative properties.
IBM Research–Almaden is a founding member of the Consortium for Sequencing the Food Supply Chain, a collaborative food safety platform that leverages advances in metagenomics to further understanding of what makes food safe. Other members of the consortium are Mars Inc. and Bio-Rad Laboratories Inc. Beck, the technical lead for the consortium, said that a major part of the project is the development of spatial information of each component in the food distribution and supply chain, which can be used to define a network relationship between sources of contaminated food, wholesalers, retailers, and consumers. This computational technique could not only help identify possible sources of contamination in the early stages of a disease outbreak but also make proactive predictions on likely contamination sources before the onset of a potential outbreak.
The project involves DNA and RNA sequencing to profile communities of microorganisms (i.e., microbiomes) in the food supply chain from farm to table, focusing first on pet food. Hundreds of ingredient samples were tested for millions of genes, and the data were combined with contextual data like weather conditions, shipping methods, and dates to create a baseline of what safe ingredient microbiomes look like. Comparison of new samples would allow discovery of new genes, gene variants, and previously undetected anomalies and alert when the safety of a food ingredient is at risk before it gets to a finished product, store shelf, or table.
Other work at IBM Research–Almaden has shown that by leveraging retail scanner data with spatial information already collected at a grocery store, along with confirmed geo-coded cases reported from a public health agency, it is possible to quickly identify a small set of suspect products that should be further investigated in a laboratory setting. The goal of this and other food safety initiatives, Beck said, is to use algorithms to discover anomalies within massive amounts of data on plants, livestock, bacteria, and other genetic and biological organisms on farms or within other food supply environments. Gathering all the necessary data to make the algorithm effective is not easy, so complex databases of food supply information to find potential bad guys that contribute to unsafe food conditions need to be created alongside the algorithms.
There is a significant challenge in obtaining critical information to help identify a contaminated product, she said. Currently, public health agencies conduct epidemiological investigations and follow laboratory protocols to diagnose an illness to determine the cause of an outbreak. These traditional methods of investigation, such as interviews and surveys, are extremely time-consuming, significantly influencing the economic and health cost of a disease outbreak. While the use of big data analysis has proven to be more efficient and effective, Beck said, the major challenge in relation to food safety, quality, processing, and research is adoption. It will take wide-scale acceptance and deployment for this approach to become the standard.
 Neil H. Mermelstein, IFT Fellow,
Editor Emeritus of Food Technology
[email protected]
About the Author
