

Top 10 Food Trends
A dramatic turnaround for frozen foods, an explosion in healthy beverages, and an uptick in center store sales are driving food and beverage revenues.

Article Content
For the first time in years, center-of-the-store edibles have posted strong growth, up nearly $6.3 billion for the year ended Nov. 24, 2018 (Nielsen 2018a). In a dramatic comeback, the $54 billion frozen foods category led center store growth with dollar sales up 3.0%, followed by beverages, up 2.8%, and liquor, up 2.5% for the year ended Oct. 7, 2018 (Dubois and Parker 2019).
Kombucha leads beverage growth, with dollar sales up 42.9% for the year ending Nov. 24, 2018. It was followed by value-added water, up 17.5%; sparkling water, +17.5%; ready-to-drink coffee, +10.5%; and seltzer water, +9.4% (Nielsen 2018a).
The average number of dinners prepared at home per week fell from 4.9 in 2017 to 4.6 in 2018; it was 4.0 for Millennial households without children. Only 39% of meals were made from scratch (FMI 2018a).
Close to half of dinners purchased from a restaurant are consumed at home (NPD 2018). Chick-fil-A is now the fifth-largest restaurant chain, behind McDonald’s, Starbucks, Subway, and Taco Bell. Burger King, Wendy’s, Dunkin’ Donuts, Domino’s, and Panera Bread round out the top 10 list (Technomic 2019).
Half of older Gen Zers aged 18–24 describe themselves as a foodie, 42% of those aged 13–17 do so. One-third have consumed nondairy milks, quinoa, and cold-brewed coffee; one-quarter have had superfoods, fusion cuisine, and spiralized/riced vegetables (Ypulse 2018).
Americans’ food purchasing behaviors/decisions have shifted dramatically, going from being based primarily on brand and form to being based on product benefits, which will help drive growth in the U.S. fortified/functional food market, projected to reach $80 billion by 2021 (IRI 2017) (NBJ 2018).
Seven in 10 Millennials, 64% of Boomers, and 60% of Gen Zs have taken a more holistic approach to their health; 75% say that mind is as important as body (Lyons Wyatt 2018a).
Four in 10 consumers (38%) are most willing to pay a premium for foods/beverages that offer benefits beyond basic, inherently healthy nutrition, up 2% in 2018 versus 2017. This is a significantly higher percentage than those willing to pay more for natural/organic attributes (30%) (IRI 2018). More than half (54%) of U.S. adults actively seek out functional foods (FMI 2018b).
As aging Baby Boomers fight to maintain an active lifestyle, everyday issues that were once the purview of younger generations (e.g., energy, sports nutrition, weight, muscle/strength, and sleeplessness) are moving onto their front burner (Sloan 2018a). Conversely, Millennials are now the most likely to complain about digestive issues, regularity, joint/back pain, skin issues, bone strength, and mental sharpness.
The number of shoppers who report using online grocery retailers at least sometimes has nearly doubled over the past three years to 28% (FMI 2018b).
Figure 1. Culinary Forecast: Top Trends Chefs Identified for 2019.

From NRA 2018
Figure 1. Culinary Forecast: Top Trends Chefs Identified for 2019.
From NRA 2018
Perhaps most startling is the selection of cannabis/CBD oil–infused beverages and foods as the top two hot culinary trends chefs identified for 2019 (Figure 1, NRA 2018). While use in foods and supplements is still prohibited under federal law, the U.S. Food and Drug Administration (FDA) appears to be reconsidering its position.
What follows is a look at the top 10 overarching food industry trends for the year ahead.
1. The Ease to Please!
The number of consumers who say convenience had a significant impact on their food purchase decisions jumped 5% last year to 54% (IFIC 2018a).
0n-pack recipe/cooking instructions would make 48% of Gen Zers and 55% of Millennials more likely to buy a food product; “easy to prepare” would influence 43% and 48%, respectively (Ypulse 2018).
Sales of retail fresh prepared foods topped $12.4 billion for the year ended Aug. 12, 2018, enjoying an increase of $2.3 billion in sales over the past five years (Dubois and Parker 2019).
Appetizers, with sales of $1.7 billion, and dips/sauces, at $298 million, led growth, each with sales up 11%. Entrées/meals remained the largest prepared category with sales of $5.3 billion, up 2.1% (Dubois and Parker 2019).
Value-added, pre-prepared, seasoned, or fresh-cut items contributed 50% of sales growth in fresh departments; ready-to-eat/heat-and-eat contributed 22% for the year ended Aug. 17, 2018 (Dubois and Parker 2019). Among recently polled consumers, four in 10 (39%) reported purchasing fully cooked meat/poultry in the prior month (FMI 2019a).
Value-added fresh vegetable sales rose 6.6% in 2018, per IRI; value-added fruit sales were flat. Packaged salad sales, likely impacted by the Romaine lettuce scare, still grew 4.0% to $5.8 billion (FMI 2019b).
Nine out of the 10 top-selling categories in frozen foods grew in dollars, and all 10 categories were up in unit sales. Leading growth were sides/soups, +9.8%; appetizers/snack rolls, +5.8%; and frozen breakfast items, +5.7% (AFFI 2019).
Gourmet refrigerated entrées ranked ninth among the top-selling gourmet/specialty food categories, and frozen lunch/dinner entrées ranked tenth; each category posted sales of approximately $2.1 billion, up 27% and 13%, respectively, over the past two years (SFA 2018).
 Over the past year, 34% of shoppers purchased meal kits from the grocery store. The category posted sales of $67 million, per IRI; 13% of consumers have ordered meal kits from a home delivery company although subscription sales are waning (FMI 2018a).
Packaged Facts (2018a) has lowered its projections from 2017, but it still expects meal kits to enjoy a compound annual growth rate (CAGR) of 12.2% from 2018 to 2023. Half of adults and 74% of Millennials say they would be likely to buy uncooked meal kits from their favorite restaurants (Riehle 2019).
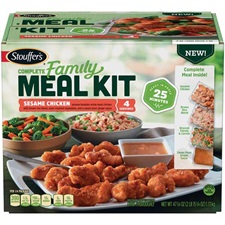
American Foods Group/Walmart now offers Steak Bowl fresh family meal kits (e.g., Korean Style Bulgogi Beef Bowl). Nestlé introduced frozen Stouffer’s Complete Family Meal Kits, and Hak’s debuted Kobe Beef Sliders kits, which it describes as “elevated meals.”
2. Natural Imaging
Transparency regarding processing claims/artificial ingredients remains one of the biggest influencers driving consumer food purchase behavior today. A complementary trend that is emerging involves creating a natural aura by adding ingredients (e.g., botanicals).
In 2018, 54% of consumers sought out all-natural foods/beverages while shopping, and 38% sought organic products. Two-thirds looked for claims that conveyed minimal processing, up 5% in 2018 versus 2017 (FMI 2018). One in five consumers (22%) searched for non-GM foods, and 42% tried to avoid/minimize their consumption (FMI 2018).
 Organic food/drink sales grew 9.1% in 2018 across all edibles, per Nielsen. Organic seafood posted the highest dollar gains, up 21%; other fast-growing organic product categories included deli products, meat, and frozen food (Hale 2019). Sixty-five percent of consumers bought organic produce in 2019, up 3% versus 2018. Organic produce volume grew 8.1% in 2018 (FMI 2019b).
One-third of all U.S. food/beverage products were classified by Nielsen as clean label in 2018; 24% of dairy products were classified that way. Clean labels have delivered $1 billion in incremental sales in the dairy category from 2015 to 2017 (Nielsen 2018b).
Nearly half of consumers look for verification of “real ingredients” in frozen foods; 38% seek no artificial ingredients; 35%, all natural; 28%, made/grown in the USA; and 24%, non-GM (AFFI 2019).
Adding nutrition via naturally nutrient-dense food sources, superfoods, extracts/infusions, fruits/vegetables, and new plant bases are among the new approaches to giving food products a naturally healthy halo.
One-quarter of women buy shakes/drinks because they contain superfoods, and 18% of men do so; 24% of men and 14% of women buy bars to get superfoods (Packaged Facts 2017a).
Fermented foods, followed by avocados, seeds, ancient grains, exotic fruit, blueberries, beets, nuts, coconut products, and nondairy milks comprise the top 10 list of hot superfoods for 2019, according to dietitians (Pollock 2019).
Honey is perceived as the cleanest sweetener, followed by brown sugar, beet sugar, agave, cane sugar, stevia, monk fruit, and brown rice syrup (FONA 2018a).
Turmeric, chia seeds, duckweed, goji berries/lingonberries, moringa, matcha, ginger, mushrooms, cumin seeds, yerba mate, acerola, maca powder, and black garlic are among the growing global superfoods (Nielsen 2018c). Turmeric supplement sales are projected to reach $500 million in 2021 (NBJ 2019).
Herbs/botanicals are the fastest-growing supplement category; 41% of supplement users opt for them (CRN 2018). Herbal supplement sales reached an all-time high of $8.1 billion in 2017, up 8.5% (Smith 2018).
Florals are moving into the spotlight. Ginger, honey, cinnamon, honeysuckle, coconut, hibiscus, lavender, elderflower, mint, cardamom, and chamomile are just a few of the botanicals being added to beverages and plant infusions (Jacobson 2018).
Vertical greenhouses, urban farms, and hydroponic gardens are poised to be the next wave in the local food movement. Four in 10 consumers have seen greenhouse-grown or hydroponically grown callouts on produce packaging or signage in-store (FMI 2019b).
More than half (55%) of consumers specifically seek out foods/drinks that are local; four in 10 say local foods are more important than last year (Dubois and Parker 2019). Consumers increasingly cite farmers as partners in the journey to eating well. In 2017, there were 8,755 farmers markets in the United States, per the U.S. Department of Agriculture (FMI 2018).
3. Origin-ality
With two-thirds of consumers buying specialty/gourmet foods, 55% enjoying trying new ethnic offerings, and 48% describing themselves as a foodie, it’s not surprising that both the origin and originality of foods/recipes have become an important factor in food selection (Packaged Facts 2018b).
Globally inspired breakfast dishes and global flavors in kids’ meals now rank fourth and fifth, respectively, on the overall list of hot culinary trends for 2019 (NRA 2018).
North and West African cuisines/flavors (e.g., fuul, tagines) are projected to set the pace for globally inspired flavor trends in 2019, followed by Peruvian, Ethiopian/Eritrean, and Filipino cuisines. Pacific Rim, Nikkei cuisine (Japanese-Peruvian), and Levantine, including Israeli cuisines, will also move into the spotlight (NRA 2018) (Technomic 2018).
Watch for North African condiments (e.g., dukkha, zhug, harissa, and ras el hanout); Japanese shichimi spice/powder; gochujang, a Korean red pepper sauce; and Ethiopian berbere to gain in popularity, especially among high-end restaurants (NRA 2018).
Other up-and-comers include Gazoz, an Israeli soda; Thai-rolled ice cream; katso sando, a Japanese cutlet sandwich, Ethiopian injera flatbread; caldo de pollo, a Mexican chicken soup; and tiropita, a Greek egg and cheese dish.
Just over one-third of consumers (36%) would like to explore regional varieties of mainstream ethnic cuisines (Technomic 2018). Americans’ domestic appetite for Asian foods is also diversifying, especially in the frozen case where Asian entrées grew two-and-one-half times faster than other dinners/entrées and Asian frozen bowl meal sales increased by 31% versus 2.1% for single-serve frozen meals in 2018, per IRI (McCorquodale 2019).
 Japanese is the fastest-growing Asian cuisine (Bonner 2018). Sales of Indian foods and snacks climbed to $22.6 million in 2018 (Leathers 2019a). Korean barbecue sauces and flavors to help replace MSG are other strong emerging trends.
Suji’s Korean Cuisine introduced a Korean Style Ramen meal; Kraft offers a Benihana Japanese Steakhouse line; and Ling Ling introduced a Vietnamese-Style Pho. At the same time, ethnic foods are moving off the dinner plate. Sukhi’s offers a frozen Chicken Tikka Masala Naanwich.
Frozen Mexican snacks/appetizers (up 5.5%), breakfast foods (up 4.9%), and single-serve entrées (up 3.2%) drove sales in the flat Mexican frozen food sector, which was up 0.7% for the 12 weeks ending Aug. 12, 2018. Sweet Earth Foods introduced Salsa Prime, a line of plant-based quesadillas (Blank 2018).
Bread/baked goods are the fifth-largest gourmet food category, with sales of $3 billion, up 18% over the past two years. Driven by multigrain, alternative grains, and gluten-free, the segment is projected to grow 40% by 2022 and now accounts for 11% of total bread/baked goods category sales.
Ethnic bread varieties, including brioche, naan, and bao, are among the fastest-growing breads on restaurant menus. Toast is also increasing in popularity as are tortas, Cuban breads, and cemitas (Datassential 2018).
Watch for Turkey’s doner kebab sandwiches, Chinese crepes, and classic French Croque Monsieur café sandwiches to grab attention (Ayoub 2019).
Figure 2. Food as a Remedy for Health Conditions

From Hartman 2017.
Figure 2. Food as a Remedy for Health Conditions
From Hartman 2017.
4. Buying by Benefit
Half (49%) of consumers rank heart health among the top three health benefits they want to get from foods/beverages; 39% are looking for weight management benefits; 36%, energy; 31%, brain, memory, focus, cognition; 23%, digestive health; 25%, muscle health/strength; 20%, immunity; and 18%, bone health (IFIC 2018a). Those aged 50 and over cite heart health, muscle health/mobility, energy, brain health, and weight as their most important health topics (IFIC 2018b). On average, consumers are making food choices in an effort to treat 2.7 conditions—led by weight, diabetes, food sensitivities, and cholesterol (Figure 2, Hartman 2017).
Ninety-two million Americans suffer from coronary heart disease, 95 million have high cholesterol levels, and 86 million have high blood pressure. What’s more, 157 million are overweight, and 82 million are obese (AHA 2019). Twenty-six million have been diagnosed with diabetes, and 91.8 million have prediabetes (AHA 2019).
Retaining mental sharpness with aging is America’s top health concern; memory ranks third (HealthFocus 2019). In 2017, nutraceutical manufacturers voted brain health/cognition/alertness as the largest new opportunity for targeted nutrition products (NBJ 2017). Sales of brain health supplements are projected to reach $1 billion by 2021, up 10% per year (NBJ 2019).
A third of consumers are trying to manage digestive problems. In 2017, 83% experienced some type of digestive issue; 65% suffered indigestion, gas, bloating, or flatulence; 56%, heartburn/reflux; 54%, diarrhea; and 48%, constipation (Mintel 2017).
Four in 10 consumers (38%) look for probiotics in foods (Hartman 2017). Sales of probiotic supplements are projected to reach $4 billion by 2021, up 10% per year (NBJ 2019). Prebiotics are fast moving into the spotlight, with supplement sales projected to top $399 million by 2020 (NBJ 2019).
After gut health and/or supporting probiotics, regularity, fiber, immunity, and brain health are the leading consumer associations with prebiotics (Monheit 2018).
One-third of U.S. consumers are extremely or very interested in the gut microbiome, led by adults aged 18–39 and households with kids. Six in 10 (58%) say that the role your digestive health/microbiome plays is extremely or very important for weight management; 57% think it’s important for daily energy levels and overall mental well-being (HealthFocus 2019).
The ability to continue normal activities with aging is the second overall health concern; 50% of those aged 65 and over are very/extremely concerned about muscle health/strength/mobility (HealthFocus 2019). In the United States, 45% of those over 65 years old already have some degree of muscle loss, called sarcopenia (USBJI 2018).
Bone health/strength ranks seventh on consumers’ list of health concerns (HealthFocus 2019). One-third of adults aged 55 and over take a calcium supplement. One-quarter of adults aged 55 and older take a magnesium supplement (CRN 2018).
One-third of those aged 35–54 cite immune health as their top reason for using supplements. The immune health supplement market is projected to reach $3.6 billion by 2021 (NBJ 2019).
5. Nix the Alternatives!
It’s time to nix the “alternative/substitute” positioning against other traditional foods and start marketing plant-based foods on their own merits, which include unique tastes, health benefits, reasonable costs, and the ability to appeal to culinary curiosity.
With sales up 20% to $3.3 billion for the year ended June 2018, plant-based foods are one of the fastest-growing industry sectors, although still relatively small versus the $58 billion meat or $39 billion snack food markets (PBFA 2018) (FMI 2019a).
Half (52%) of consumers say taste is the top reason for plant-based food consumption; health reasons and avoiding processed foods are each mentioned by 39%; weight management is noted by 31%; and cost cited by 16%. Only 13% are motivated to buy because of environmental concerns, 11% for reasons of animal protection, and 10% in order to eat a vegetarian diet, according to Mintel (Dornblaser 2018).
Legumes, nuts, and seeds are among the top five sources of protein in one out of five U.S. households; 39% of Americans are trying to eat more plant-based foods (Nielsen 2018d).
Veggie-centric/vegetable-forward cuisine ranks eighth among the hot overall culinary concepts for 2019; vegetable carb substitutes (e.g., cauliflower rice, zucchini spaghetti) rank second in the main dish category (NRA 2018).
Six percent of consumers followed a strictly vegetarian lifestyle in 2018; 3% were strictly vegan (Nielsen 2018e).
Plant-based milks remain the largest plant-based product category with sales of $1.6 billion, up 9% for the year ended in June 2018 (PBFA 2018). Plant-based “meat” sales reached $878 million (FMI 2019a).
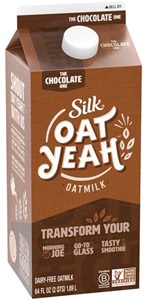 One-third of consumers are regular users of plant milks; 30% of users would drink more if they were fortified with more health benefits (Packaged Facts 2017b). Silk Oat Yeah oat milk is among the latest new varieties.
Protein content and fiber, cited by 35% and 28% of consumers, respectively, are the most important nutrition attributes when buying plant-based food/drinks (Johnson 2018). Meat alternatives with pea, soy, or wheat proteins alone or in combination with other ingredients score the highest for purchase intent (Johnson 2018).
Sales of plant-based ice cream topped $222 million, up 38%; plant-based yogurt sales were $162 million, up 55% (PBFA 2018). Oats, flax, legumes, hemp, rice, cashews, almonds, and peas are among the new nondairy yogurt bases (FONA 2018b).
In 2017, more than half (56%) of adults bought snacks made from whole grains; 51% bought multigrain combinations; 27% bought snacks made from chickpeas/garbanzos, lentils, beans, or dried peas; and 22% bought snacks made with ancient grains. Sales of alternative snacks are projected to reach $1.7 billion by 2019 (Packaged Facts 2017c).
Sales of plant-based pizza jumped 21%, albeit from a small base, and veggie noodle sales shot up by 115% for the year ended April 7, 2018 (Nielsen 2018e).
 Nondairy cheese-style dips like The Honest Stand’s Smoked Cheddar Style Dip, Caulipower’s iViva Cauliflower Tortilla!, and Cece’s Veggie Co.’s Shells & Cheez made from organic butternut squash are among the new plant-based food offerings.
Ronzoni SuperGreens pasta made with spinach, zucchini, broccoli, parsley, and kale delivers three servings of vegetables in a 3.5-ounce portion, is Non-GMO Project Verified, and is made in the United States.
6. Over-Performers
Over the past five years, exercise and sound mental health have become integral parts of a healthy lifestyle, spawning a new fitness-focused, active lifestyle demographic dubbed the “fit consumer.” Such individuals may well represent up to 40% of all U.S. adults (Sloan 2019).
Fit consumers are differentiated by integrating frequent physical exercise (three to five days per week, at least 30 minutes a day) and a focus on enhancing their everyday mental/physical performance. While fit consumers span all life stages, core consumers are under age 40; the older edge is age 65.
In 2017, 60% of adults exercised three or more days per week for more than 30 minutes; 15% exercised six to seven days each week. Although they’re credited with driving the $40 billion sports nutrition sector mainstream, only 20% describe themselves as “serious/strenuous” exercisers (MSI 2017).
 Among those who exercise three or more times per week, 83% used sports nutrition bars, and 71% consumed sports nutrition beverages. Thirty-six percent of all Millennials take a sports supplement versus 22% of the general population (CRN 2018).
Among active consumers, 74% always or usually choose foods because they’re high in protein, 70% choose foods because they are high in fiber, and 66% seek fortified foods (HealthFocus 2019).
More than half (55%) of U.S. households consider high protein an important attribute when shopping for food. Sales of foods/drinks with a “good” or “excellent” source of protein claim reached $22.6 billion for the year ended June 9, 2018 (Nielsen 2018f).
Seventeen percent of adults used protein beverages in 2018; 12% used meal replacements/mixes; 11%, nutritional drinks; and 6%, weight loss drinks/mixes (Mintel 2018). The sports nutrition/protein powder market was $6.5 billion in 2018 (NBJ 2019).
Tiredness/lack of energy ranks fifth among Americans’ health concerns (HealthFocus 2019). One in two adults aged 50 and older wish they had more strength/energy to participate in activities they enjoy; 28% have noticed muscle loss and 40% a loss of strength, with 34% being extremely concerned about it (Abbott 2016).
Adult use of energy drinks/shots, sports drinks, and meal replacements increases as the number of kids in the household goes up (Packaged Facts 2017d). Over half (57%) want snacks with an energy boost (Lyons Wyatt 2018b).
Lastly, with 72% of kids aged 6–12 involved in sports, kids’ sports nutrition products are a missed opportunity (Aspen 2018). One-third of teens say being fit is a big part of their life; 38% of those aged 13–17 work out three or more days per week; 27% do so once or twice weekly (Ypulse 2018).
7. Unplated Small Plates
While only 8% of consumers forego meals altogether in favor of snacking, 42% of consumers who snack more today do so by cutting back on the number of meals they eat in a day—so much so that 37% of the time a snack provides one of the three most substantial eatings of the day (Hartman 2019).
Moreover, with 60% of employed adults frequently not taking a real lunch break, the demand for more substantial mini meal kits and savory morsels is on the rise (Riehle 2019).
Half (54%) of consumers find snack-ified entrees very/somewhat appealing; 47% want to see more on menus (Smucker’s 2018a).
 Sales of fresh meat/cheese snack kits jumped 45% last year (Lyons Wyatt 2018b). Hillshire Snacking Small Plates now include Smoky Bourbon cuts of beef with Asiago cheese. Peckish Peck Packs come in an Eggs & Fried Rice variety. Sabra offers a grab-and-go Breakfast Avocado Toast kit.
Foster Farms offers refrigerated ready-to-eat single-serve chicken snacks, including Bold Bites Chicken in Korean BBQ and Chile Verde flavors. A single-serve pack of Trans-Ocean Seafood Snackers includes four surimi crab legs.
Bel Brands USA introduced Laughing Cow all-natural dippable single-serve cheese cups. Lantana Foods unveiled hummus in four fruit-based flavors, making it an innovative replacement for jelly or cream cheese at the breakfast hour.
Walmart’s restaurant-style grab-and-go fresh cravings salsa & tortilla chips snack packs are available in the produce department.
Half of consumers use frozen snacks/appetizers as a meal replacement; 62% say snacks make a convenient meal at work. One in five eat frozen snacks en route in the car (Mintel 2016).
Farm Rich’s American Grilled Cheese Sticks and Hormel’s Skippy PB & Jelly Minis are among the frozen snacks now positioned as a meal.
Frozen seafood appetizers are stepping into the spotlight; Phillips Foods introduced Crab Rangoon appetizers, and SeaPak Shrimp & Seafood Company offers Parmesan Shrimp & Spinach Bites.
 Feel Good Foods offers cauliflower-crusted empanadas and Snack Bites made with non-GM ingredients. And there’s plenty of room for culinary innovation. American Flatbread’s single-serve Frustas are a “canoe-shaped, pizza-like dish” in varieties that include BBQ Pulled Pork and Chicken & Pesto flavors. K&N’s Kabab Temptations varieties are made from meat/poultry that is flame grilled on skewers.
On the foodservice front, look for arepas, gyros, crepes, flaky croissant pastries, and bao buns to provide unique mini carriers for on-the-go fare. Au Bon Pain now features savory filled kolaches, breakfast rolls, and stuffed croissants.
Mini desserts have become increasingly important in the in-store bakery. Sales of mini brownies jumped 8.4%, doughnuts were up 5.3%, and mini muffin sales were up 4.9% versus the prior year, according to a 2019 Nielsen report (Nielsen 2019).
Breakfast snacks are very or somewhat appealing to 66% of consumers; 57% of Millennials typically order a second breakfast (Smucker’s 2018b).
More than half of shoppers purchase cold-pressed juices, veggie shakes, fruit smoothies, and produce-infused water as snacks at least occasionally (FMI 2019b).
Deli soups are finding a new role as snacks; for the 12 weeks ended Jan. 27, 2019, fresh soup sales shot up by 9.8% (Leathers 2019b).
8. Dietary Deliverables
In terms of specific product claims, 42% of consumers seek out a “good source of fiber” claim when purchasing a food or beverage, one-quarter seek a “vitamin-enriched,” “antioxidant-rich,” or “calcium-fortified” claim; one in five look for a “heart-healthy” claim (FMI 2018b).
In 2018, 75% of U.S. consumers used dietary supplements (CRN 2018). After multivitamins, vitamin D was the most used supplement, taken by 38%, followed by vitamin C at 30% (CRN 2018).
 In 2017, 63% of adults tried to add more fiber to their diet. Other sought-after dietary additions include protein, sought by 60%; vitamin D, 59%; whole grains, 58%; calcium, 54%; antioxidants, 43%; omega-3s, 42%; probiotics, 38%; and plant protein, 32%. Added nutrients are a top nutritional priority in the morning daypart (Hartman 2017).
While one in five adults admit that they don’t think they get enough of their basic vitamins/minerals, even more consumers—30% of Gen Xers, 27% of Millennials, and 24% of adults overall—don’t feel they get enough specialty nutrients (FMI 2018b).
Moreover, specialty supplements are now second only to vitamins/minerals as the most used supplements, taken by 51%; they are followed by herbals/botanicals at 41%; sports nutrition supplements at 32%; and weight management supplements at 20% (CRN 2018).
In 2018, half of Americans were watching their diet; 65% of those aged 65 and over were doing so versus 38% of those aged 18–34. One-third of adults over age 45 tried to lose weight versus 20% of those younger than age 35 (Packaged Facts 2018b).
Parents with kids under age 18 at home are more concerned about growth/physical development, (e.g., height, bones, and muscle) than low exercise levels (HealthFocus 2019).
In 2017, 44% of adults tried a special diet or eating approach, led by any low-carb diet at 12%; gluten-free and lactose-/dairy-free, each at 11%; vegetarian, 10%; Weight Watchers, the Whole30 Diet, or detox cleanse, each 9%; intermittent fasting, 6%; vegan or Paleo Diet, each 5%; and ketogenic diets, 2% (Hartman 2017).
Perhaps most important is the fact that although consumers are experimenting with eating plans, they don’t stay on them for long. In fact, many Millennials eat the keto way for one meal and take the Paleo approach for another. Fewer than 5% of consumers are interested in recipes based on diet plans such as Paleo or keto (FMI 2018b).
Personalized nutrition diet plans prescribed by various food apps represent another fast-moving nutrition trend. What is important is that the FDA has not reviewed the efficacy of these algorithms, nor have any clinical studies been conducted to verify the results.
Further, the results of direct-to-consumer DNA-based health/nutritional evaluations have an accuracy of only 40%, according to the American College of Medical Genetics and Genomics. Moreover, the Centers for Disease Control and the American College of Nutrition and Dietetics have recommended against their use. They are currently prohibited for sale in New Jersey, New York, and Rhode Island (CDC 2017).
9. Consciousness
Grass-fed tops claims that consumers want to find on meat department products, cited by 54%. It is followed by all natural, antibiotic free, and hormone free, each mentioned by 52%; raised in the USA, 49%; free-range, 47%; humanely raised, 43%; organic and locally raised, each 38%; and vegetarian-fed, 19% (FMI 2019a).
Despite some declines in the past year, practices to reduce food waste are important to three-quarters of consumers; recycling plastic and paper is important to seven in 10. Interest in minimizing food packaging continues to grow (FMI 2018b).
Zero-waste cooking, hyper-local, house-made items, and clean menus are among the top five hot culinary concepts for 2019 (NRA 2018).
 In the food retail space, the highest growth related to sustainability is among products touting sustainable farming and social responsibility, with sales up 14% and 8%, respectively. For the year ended June 5, 2018, products that highlight sustainable resource management are seeing sales growth of 6%; the growth rate for sustainable seafood is 3% (Nielsen 2018g).
Buying fair trade products is important to 46% of consumers; sustainable seafood is important to 39%; and pasture-raised eggs are important to 38%. One-third of consumers support food companies whose products are manufactured in the United States (FMI 2018b).
In addition to Celiac Gluten-free Certified (a program of the National Foundation for Celiac Awareness), biodynamic certified, BPA-free certified, and more than 50% whole grain certified were among the new prominent certifications at Natural Products Expo West last month.
In the past year, consumer reliance on the FDA to ensure that products purchased at the grocery store are safe dropped 6% from 56% in 2017 to 50% in 2018; reliance on the U.S. Department of Agriculture fell 2% to 49% (FMI 2018b).
In 2018, bacterial contamination remained the top food safety concern. It was cited by 75% of consumers as posing “a serious” or “some” health risk, followed by pesticide residues, cited by 71%; antibiotics/hormones, 62%; product tampering, 59%; food from China, 52%; biotechnology/GMOs, 47%; and eating food past the “use by” date, 40% (FMI 2018b).
Look for vegan to be the new gluten-free, not in the absolute sense, but as an indicator of cleaner, less processed foods. Twenty-nine percent of Gen Z consumers say a vegan claim enhances a food product’s appeal (Ypulse 2018).


10. Generational Complexity
Food marketers need to re-evaluate their market strategy to best meet the unique demands of an unprecedented generationally diverse marketplace.
While marketers are fixated on attracting younger generations with trendy fusion cuisines/flavors and niche marketing, they‘re overlooking or de-emphasizing some of the food and beverage favorites of consumers aged 50 and over—a population segment of 109 million. Food companies should exercise caution when it comes to cutting back on traditionally popular fare for this important segment. At the same time, the 82 million members of the Millennial generation are having children of their own, putting foods targeted to babies, kids, and teens back on the front burner.
Households with kids are much more likely to order from a restaurant at least once a week or to use fresh prepared foods; they are twice as likely to buy frozen foods; and they contribute 40% of snack food sales (Sloan 2018b).
 Concerns about getting older, a new health condition, lack of energy, and having a baby are among the top motivators for taking health-oriented actions. Forty-eight million Americans are aged 65-plus (Census 2015). Older consumers are the most likely to eat a full breakfast; to eat a balanced meal that includes vegetables, entrée, and sides; and to eat dessert.
Perhaps most exciting, Gen Z—whose oldest members are now 18–23—are beginning to make their mark on the food and beverage industry. And a different lot they are.
Influenced by their “foodie” parents and school programs aimed at healthier eating and preserving our planet, Gen Zers are among the heaviest users of alternative snacks. Nine in 10 want to add more plant-based foods to their diet, and 50% experiment with specialized diets or eating plans (Ypulse 2018).
Nearly half of Gen Zers are regular exercisers (Ypulse 2018). Stress, tiredness/lack of energy, muscle tone, mental sharpness, sleep, and skin are their main health concerns (HealthFocus 2019).
A. Elizabeth Sloan, PhD, a member of IFT and contributing editor of Food Technology, is president, Sloan Trends Inc., Escondido, Calif. ([email protected]).
About the Author
