

Refreshing the Fresh Food Sector
Prepackaged gourmet meats and seafood, dessert dips, and breakfast kits for on-the-go consumers are among the new fresh products grabbing customers’ attention.

Article Content
For the year ending June 17, 2018, fresh department sales rose 1.2%, down from 5.4% annual growth in 2014, according to IRI. In comparison, “other edibles,” including center store general foods, frozen foods, beverages, refrigerated products, and liquor, collectively posted gains of 2.0% (DuBois and Parker 2018).
Fresh produce sales reached $59.6 billion; dairy, $55.6 billion; meat, $49.8 billion; deli prepared foods, $12.4 billion; deli meat/cheese, $8.3 billion; in-store bakery products, $6.3 billion; and seafood, $4.4 billion over the same time frame, according to IRI (DuBois and Parker 2018).
Solutions for Time-Starved Consumers
With more dollars spent on food away from home than food prepared in the home for the first time last year, the need for more convenient fresh meal solutions/ingredients is undeniable (DuBois and Parker 2018).
The average number of dinners prepared at home per week fell from 4.9 last year to 4.6; it was 4.0 for Millennial households without children. Only 39% of meals were made from scratch (FMI 2018a).
Most important, those who say that convenience has a “significant impact” on their food purchase decision jumped 5% in 2017—to 54% (IFIC 2018).
At the same time, a lack of cooking skills/knowledge is limiting product selection, experimentation, and growth in the fresh meat, seafood, and produce departments.
Cooking instructions/recipes and an “easy to prepare” claim would make 55% and 48% of Millennials, respectively, much more likely to buy a fresh food product; for Gen Z, the figures are 48% and 43%, respectively (Ypulse 2018).
Fresh whole commodities continue to account for the bulk (76%) of fresh perimeter sales and 24% of the growth. They will always play an important role in fresh departments, but more convenient added-value offerings are driving 50% of the growth and ready-to-eat options are driving 22% of growth, per IRI (DuBois and Parker 2018).
Only 8% of consumers have purchased a meal kit from a retail food store in the past month (Packaged Facts 2018b). IRI reports that 0.4%, or $56 million, of perimeter sales are from retail meal kits (DuBois and Parker 2018). While “whole and fresh” (not packaged) is the characteristic that consumers would most like to see in their foods, ironically, many view meal kits as processed due to their extensive packaging (Packaged Facts 2018b).
Four in 10 consumers say fresh preprepared/ready-to-cook ingredients are very important in choosing where they shop (IRI 2017). Two-thirds own/use a crockpot (Mintel 2017a). Oven- and microwave-ready package information is important to 57% (FMI 2018a).
Half of fresh food buyers cite health as the most important reason for purchase. Just over half of fresh food consumers look for foods that are naturally nutrient rich (IRI 2017). Not surprisingly, some savvy fresh marketers are calling out nutrients on commodity products.
Naturipe Snacks combine fresh fruit, nuts, and cheese cubes in compact packaging, making them an appealing grab-and-go item.
Half of adults have purchased fresh foods that they believe provide medicinal properties; 45% have purchased foods recognized as home remedies (Lyons Wyatt 2018a).
One-third of adults buy mostly natural/organic food almost every time they shop. The quality of the fresh produce, meat, and seafood departments determines where they shop. Within this group, 88% of shoppers buy fresh ingredients for cooking versus 72% of adults overall who do so (Packaged Facts 2018c).
While only 40% of fresh foods/beverages were clean label in 2017, transparency/clean claims are very important to 78% of consumers for fresh meat/poultry/lunch meat. In addition, 75% consider it very important for produce; 73% for dairy; and 55% for bread/bakery (Nielsen 2017a; Label Insight 2016).
Figure 1. Shoppers' list of safety concerns

Figure 1. Source: FMI 2018a
Figure 1. Shoppers' list of safety concerns
Figure 1. Source: FMI 2018a
Nearly three-quarters (72%) of adults say that food safety/contamination is a major concern with fresh meat/poultry (Packaged Facts 2018c). Bacterial contamination and residues top shoppers’ list of safety concerns (FMI 2018a) (Figure 1). One in four fresh food shoppers say they find responsible sourcing and humane product attributes much more important now than one year ago (IRI 2017).
Practices to reduce food waste continue to attract shoppers; 74% try to buy only as much as they can use while 55% encourage everyone to finish their plate (FMI 2018a).
Local is very important when shopping for fresh fruits/vegetables for 30% of consumers; 21% say it is very important for fresh meat/poultry (IRI 2017). With more than half (55%) of adults actively looking for locally grown/produced foods, not touting fresh, daily delivered items and the regional nature of fresh baked goods, eggs, and dairy products is a missed opportunity (FMI 2018a).
Half of consumers bought fresh food in a supercenter last year, 27% in a specialty grocery store, and 24% in a farmers market (FMI 2018a).
With 27% of U.S. households consisting of a person living alone, single-serve/portionable packaging should be among the fresh food merchandise mix (FMI 2018a).
Lastly, while 28% of adults use online-only retailers for ordering groceries at least occasionally, perishable items remain among the least ordered items, with no gains over the past year (FMI 2108a).
Protein Power
Meat/poultry consumption has rebounded back to 2012 levels and is now included in four or more home-prepared dinners per week (FMI 2018b).
Nearly half of adults believe that unprocessed meat is good for your health (Nielsen 2017b). Three-quarters of Millennials associate meat/poultry with providing nutrients (e.g., protein); 62% associate it with supplying iron; 62% with energy; and 53% with building physical strength. One-third of those aged 65 and older associate it with mental health (FMI 2016).
Price, followed by appearance, nutrition, and preparation knowledge are the most influential meat selection factors. The number of those who regularly chose leaner cuts of meat fell 5% over the past two years (FMI 2018b).
Value-added meats (e.g., premarinated products, kebabs, etc.) continue to drive growth in fresh meat/poultry. Value-added meats are purchased frequently by one-fifth (21%) of shoppers, up from 9% two years ago (FMI 2018b).
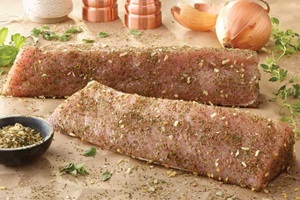 Hormel added a Greek Inspired Dry Seasoned Pork Loin Filet to its Hormel Always Tender line. Hatfield Quality Meats offers a Frenched Bone-in Pork Chop as well as Uncured Bacon-Wrapped Pork Loin Medallions.
About half of consumers serve heat-and-eat and ready-to-eat meat at least once a week; one in five consumers do so three or more times weekly (FMI 2018b).
Sales of precooked meat/poultry reached $3.6 billion in 2017, up 3.2%. Chicken, turkey, and products with vegetables/stuffing posted the highest sales gains; 42% of consumers are very interested in more precooked meat (FMI 2018b).
Most important, these convenient forms are adding incremental sales to the meat department rather than competing against fresh meat purchases (FMI 2018b).
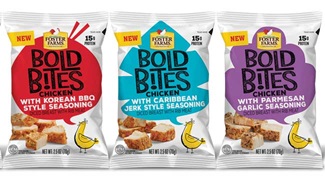
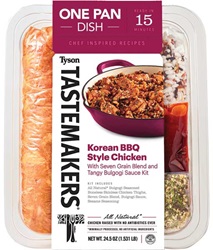 Seasoned patties are among the rising stars in the meat case, along with specialty sausages, stuffed/smoked items, Hispanic meats, and everything barbecue (Major and Taylor 2018). Tyson has introduced all-natural, no antibiotics ever ground chicken.
New cuts of meat (e.g., oyster steak, Vegas strip steak, Merlot cuts), grass-fed/heritage meats, duck, premium Iberian meats, slow-growth chickens, and Australian lamb are other premium meat directions.
Cross-marketing with produce is another emerging opportunity. Think bacon-wrapped asparagus and meat-stuffed portobello mushrooms.
Sales of no antibiotics ever meat reached $5.1 billion in 2017, with sales up 45%; sales of organic meat/poultry were $819 million, up 9%. Sales of antibiotic-free chicken now accounts for 28% of chicken sales; organic accounts for 4% (Lyons Wyatt and DuBois 2018).
Two-thirds of shoppers say humanely raised and/or antibiotic-/hormone-free descriptors make them most likely to purchase specialty meat/poultry. Other descriptors that influence specialty meat/poultry and the percentage influenced are as follows: all-natural, 57%; vegetarian-fed or grass-fed, 52%; free-range, 50%; and organic, 48% (FMI 2018b).
Only 8% of meat department operators currently carry fresh plant-based meat/poultry alternatives; 26% say they have no intention of doing so (Dudlicek 2018).
Lastly, education and package sizes are important tools for growth. Millennials, those who live alone, urbanites, and those with limited meat knowledge are the least frequent buyers of fresh meat/poultry. Those who buy a wider assortment cook meat/poultry 5–7 nights per week (FMI 2018b).
Go Fish!
Seafood has the lowest household penetration of any fresh department, despite two-thirds of adults eating fish/seafood at least occasionally (Nielsen 2017c).
For the year ending June 17, 2018, sales at the fresh seafood counter grew 1%, per IRI; volume fell 4.4%. Salmon, “all other fish combined,” shrimp, crab, and lobster are the largest categories (DuBois and Parker 2018).
Halibut, scallops, shrimp, and flounder posted the highest dollar gains for the year ending June 30, 2018; tilapia, mussels, and herring had the largest declines, per Nielsen (Browne and Hamstra 2018).
Prepared seafood sales showed 3% volume growth; deli seafood entrées were up 10%; deli sushi, +12%; fresh seafood meals, +32%; and poke, +48% (Browne and Hamstra 2018).
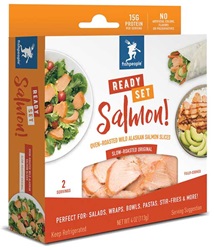 Fishpeople’s Ready, Set, Salmon! Oven-Roasted Salmon Slices are ready to go for salads, stir-fries, pastas, and more.
Value-added, preprepared seafood (e.g., premarinated or kebabs), contributed 41% of total dollar growth for the year ending May 12, 2018, per IRI (Goldschmidt 2018).
Shrimp is the most consumed seafood, followed by salmon, canned tuna, tilapia, Alaskan pollock, pangasius, cod, crab, catfish, and clams (NFI 2017).
American regional fish (e.g., walleye) and less expensive underutilized species (e.g., mullet), should grab customer attention. Seafood burgers and fresh fried clams, shrimp, or oysters are well poised as premium appetizers, breakfast meats, or burger alternatives.
Deli Quick Fix
In 2018, 55% of U.S. households bought retail ready-to-eat fresh prepared food often, sometimes, or every time they shopped; 54% bought heat-and-eat items. Households with kids were most likely to do so (FMI 2018a).
Entrées, lunches, and soups drive the refrigerated prepared meal section. Refrigerated meal sales topped $9.2 billion, up 8.6% for the year ending June 17, 2018, according to IRI (Crawford, Rodriguez, and Parker 2018).
Sales of fresh prepared entrées reached $5.5 billion, up 3.0%; sides, $2.9 billion, up 4.8%; prepared lunches, $2.5 billion, up 12.8%; salads, $1.8 billion, down 1.4%; sandwiches, $1.8 billion, flat; appetizers, $1.6 billion, up 5.4%; breakfast entrées, $558 million, up 16.9%; and fresh soup, $356 million, up 22.3% (Crawford, Rodriguez, and Parker 2018).
Sales of fresh prepared tacos jumped 78%; quiche, +49%; holiday meals, +44%; lasagna, +40%; and chef salad, +35% (Crawford 2018). Ready-to-eat stews, meatballs, chicken salad sandwiches, pork entrées, and burgers were among the top deli department prepared product sellers for the year ending May 5, 2018, per Nielsen (IDDBA 2019).
Asian appetizers/entrées, sushi, kids’ meals, and chef-prepared daily specials also posted strong gains. Mediterranean, Japanese, Thai, Vietnamese, Indian, and Middle Eastern prepared meals will have high appeal to Millennial prepared food users (FMI 2018c).
Among deli products positioned for convenience/entertaining, sales of dips/sauces topped $1 billion, up 11.3%; presliced meat, $801 million, +4.8%; hummus/spreads, $800 million, +4.4%; deli party trays, $580 million, +4.7%; artisan cheese, $2.9 billion, +0.3%; presliced cheese, $383 million, +3.0%; and refrigerated pasta, $415 million, +5.2% (Crawford, Rodriguez, and Parker 2018).
Turkey, ham, beef, chicken, salami, and bologna, in descending order, remain Americans’ favorite deli meats. Salami and Italian specialty meats are the fastest growing (IDDBA 2019).
Uncured (e.g., Nathan’s Famous All-Natural Uncured Beef Franks with “no nitrates or nitrites added”) and extra spicy and double-smoked packaged meats are emerging mainstream deli trends.
While potato, pasta, and chicken salads and coleslaw are the largest deli salad categories, vegetable salad sales posted the highest growth, up 33% for the year ending Jan. 27, 2018 (Nielsen 2018a).
Cheese cubes and refrigerated grated cheese continue to lead unit gains in the packaged cheese case for the year ending Aug. 12, 2018 (Canning 2018a).
Applegate Farms’ Applegate Naturals Italian and Mexican shredded cheese blends are certified non-GMO; Cabot Creamery’s shreds come in Bacon Cheddar and Rustic Pizza flavors.
Nine in 10 cheese eaters eat regular (full-fat) cheese, 9% opt for light/low fat, and 2% go for fat-free/nonfat. Thirty-seven percent of U.S. households buy wedges/chunks/sticks, 30% each buy shredded/sliced, 19% buy string cheese, and less than 10% purchase round/miniature/waxed/wrapped cheese (Packaged Facts 2018d).
After cheddar, mozzarella, and Parmesan/Romano, in descending order, Colby, Monterey Jack, Swiss, provolone, pepper jack, feta, blue, Gouda, Muenster, ricotta, Brie/Camembert, Havarti, longhorn, and Jarlsberg are the most consumed specialty cheeses (Packaged Facts 2018d).
For the year ending June 17, 2018, Nielsen reports that cheddar, Colby Jack, Dubliner, mozzarella, Hispanic varieties, and Gruyère had the largest specialty volume gains (IDDBA 2019).
Although they are currently only a small portion of fresh soup/chili sales, sales of family-size (32 ounce) fresh deli soups jumped 70% for the 12 weeks ending Aug. 12, 2018, and may represent a new opportunity (Leathers 2018a). Blount Fine Foods introduced a new Cheeseburger Soup just in time for the cold weather.
Lastly, while still very small categories, peppers/pimentos/olives posted unit gains of 21% for the 12 weeks ending July 15, 2018, per IRI; marinated vegetables were up 31%; pickles, up 8%; and marinated fish/herring/seafood, up 5.9% (Bovine 2018).
Center-Plate Produce
High-quality fruits/vegetables are the most important factor in selecting a primary grocery store (FMI 2018a). Moreover, when produce lands in the shopping cart, overall basket size is 44% higher (Busch 2018).
Vegetables accounted for 41% of produce sales for the year ending Aug. 12, 2018, followed by fruit at 33%; nuts, premium juices, and refrigerated dressings/dips, each at 6%; and all other items (e.g., exotics and mixes), at 8% (Fleenor 2018a).
More than half of fresh fruit sales (58%) were loose/random weight; 25%, packaged; and 17%, value-added; for fresh vegetables, the figures are 53%, 29%, and 18%, respectively (Fleenor 2018a).
Bananas are the most popular fresh fruit, purchased by 73% of primary shoppers who bought fresh fruit in the past year. They are followed by apples, purchased by 69%; grapes/strawberries, each 62%; oranges, 56%; watermelon, 54%; lemons, 48%; blueberries, 45%; and peaches/pineapples, each 42% (Johnson 2018).
Potatoes, bought by 68% of primary shoppers who made a vegetable purchase in the past year, are the most purchased fresh vegetable; they are followed by onions, purchased by 66%; tomatoes, 65%; carrots, 60%; bell peppers, 53%; lettuce, 53%; broccoli, 51%; salad mix, 50%; cucumbers, 49%; and celery, 46% (Johnson 2018).
Kale, green beans, pineapple, and watermelon had the highest increase in usage versus 2017. Avocados topped the list of produce items consumers purchased last year for the first time, followed by asparagus, varietal peppers, and broccoli (Kresin 2018a).
Sales of value-added vegetables and packaged salads/meal kits grew 7.4% and 14.1%, respectively (Taylor 2018). Blood orange vinaigrette, ponzu, green goddess, and apple cider vinaigrette are among the up-and-coming hot trends in salad dressing flavors (Datassential 2018).
Ready Pac’s fresh Wrap Kits and a Bistro Bowl line that includes Pulled Pork Salad are helping to move produce to the center of the plate.
Green Giant Fresh, the first to create Cauliflower Crumbles as a rice substitute, introduced a new line of globally inspired vegetable meal bowls, including a Fried Rice Bowl.
Del Monte Fresh Produce added Cauli Rice Curry and a Tomato Bolognese Veggie Noodle to its Mann’s Nourish Bowls line and claims to be the first ever warm veggie meals using vegan sausage and chicken.
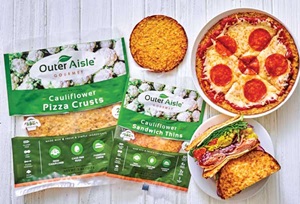 One-quarter of Millennials and Gen Zers have eaten avocado toast, superfoods, and spiralized/riced vegetables (Ypulse 2018). Outer Aisle Gourmet’s fresh Cauliflower Sandwich Thins and Pizza Crust offer a veggie-based, naturally gluten-free bread alternative.
Kosher, microwaveable, ease of use, organic, and no additives/preservatives were the top claims on new product introductions last year. One-quarter of shoppers say non-GMO is important when buying fresh vegetables (Mintel 2018).
Branded produce (e.g., Cuties and Halos, now represent half (49%) of produce sales, enjoying double-digit growth for the past five years (Feenor 2018b).
Prepackaged salads, apples, carrots, herbs/spices, and strawberries were the top five best-selling organic fresh produce items for the year ending June 8, 2018. Nearly half (46%) of shoppers bought more organic produce than last year (Browne and Hamstra 2018).
Asian pears, kale, cranberries, artichokes, eggplant, papaya, and sprouts were the fresh items almost exclusively purchased as organic (Kresin 2018b).
Navel oranges, pears, clementines, blood oranges, and brussels sprouts are among the trendiest seasonal items. Cotton candy grapes, jicama, dragon fruit, lychee, jackfruit, passionfruit, red guava, and starfruit are among the more exotic offerings (Fleenor 2018c).
Varietals remain a strong draw; watch for red, Napa, and bok choy to upstage green cabbage. Dole Food Co.’s Slawesome! line features Mango Sriracha and Sweet Apple varieties.
Hyperlocal farming (e.g., growing crops on premise) and estate/farm brands are other fast-emerging trends in the specialty produce category (NRA 2017).
Figure 2. Consumption of Fresh Fruit and Vegetables

Figure 2. Benefits Consumers Associate with the Consumption of Fresh Fruit/Vegetables (FMI 2018)
Figure 2. Consumption of Fresh Fruit and Vegetables
Figure 2. Benefits Consumers Associate with the Consumption of Fresh Fruit/Vegetables (FMI 2018)
With such strong health associations with various conditions, fresh produce marketers should embrace their nutritional attributes as a produce differentiator (FMI 2018d) (Figure 2).
Kale, brussels sprouts, little gem lettuce, roasted carrots, and spaghetti squash are among the fastest-growing vegetables on restaurant menus (Datassential 2018).
Lastly, Nielsen estimates produce snacking category sales at $1.1 billion. Six in 10 consumers say they snack more on fresh produce than they did one year ago (Kresin 2018a). Mucci Farms’ CuteCucumber Poppers are snack-sized fresh cucumbers.
Richly Rewarding
Ultra-rich/full-fat, even more healthy, just plain fun, and a move to reposition some traditional dairy products as snacks and/or cooking ingredients are among the trends driving innovation in the dairy case.
Cheese, with nearly $17 billion in sales, remains the largest dairy category. It is followed by milk products at $12 billion in sales; beverages, $7.5 billion; yogurt, $7.3 billion; and eggs, $5.5 billion for the year ending July 28, 2018 (Nielsen 2018b).
Refrigerated dips posted the largest sales gains, up 12.8% for the year ending June 17, 2018, per IRI. Rounding out the list were whipped toppings, +7.2%; butter/blends, +6.4%; cream, +6.1%; cream cheese, +2.4%; refrigerated desserts, +1.4%; and natural cheese/sour cream, each +0.8%. Margarine/spreads and milk sales each fell by 3.0%, processed cheese was down 2.9%, and yogurt sales dropped by 2.6% (Crawford, Rodriguez, and Parker 2018).
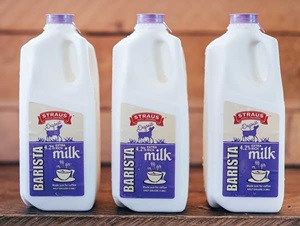 Whole milk’s share of the milk category has increased from 29% to 37% over the past five years (Canning 2018b). Straus Family Creamery introduced Organic Extra Rich Barista Milk (4.2% fat) targeted to culinary professionals. A new Double Cream Yogurt under the Oikos Oh! brand is available from Danone North America.
Although reduced-fat milk sales continue to slide, lactose-free products and Fairlife’s high-protein/high-calcium and flavored milks continued to post strong gains for the year ending Aug. 12, 2018, per IRI (Canning 2018b).
Clover Sonoma’s new line of non-GMO verified lactose-free milks includes chocolate milk. LaClare Farms’ goat milks are positioned as being easier to digest. Green Valley Creamery introduced a lactose-free cottage cheese.
Siggi’s Dairy Simple traditional Scandinavian 4% fat skyr yogurts have 19 grams of protein, contain less sugar than other yogurts, and are made with five active cultures. Chobani’s new A Hint of Flavor yogurts are made with 2% milk and natural sweeteners and have half the sugar of other yogurts. Organic Valley’s Grassmilk Kids Yogurt is higher in omega-3 fatty acids and conjugated linoleic acid than conventional milk.
DairyPure Mix-ins Cottage Cheese in Peach & Pecan and Strawberry & Almond varieties are among the traditional dairy products being repositioned as snacks. Oui by Yoplait Petites are indulgent snack-size yogurts that come in 3.5-ounce pots. Yogurt drinks and alternative beverages are among the latest beverages to be used as snacks (Lyons Wyatt 2018b).
Positioning cultured products as cooking ingredients is another fast-emerging dairy trend. Chobani’s squeezable plain lowfat Greek yogurt Savor and Hood Sour Cream Squeeze both come in a squeezable bottle and are designed for use in cooking or as toppings.
Land 0’Lakes introduced a squeezable butter. Challenge Dairy Products’ Danish Creamery spreadable butter is made with coconut oil.
Dessert dips are another fast-emerging trend. Duke Foods’ Dippin’ Delights come in Creamy Pineapple Pecan and Red Velvet flavors. Dark Chocolate Hummus is available under the Tribe brand label. Stonemill Kitchens serves up dessert dips in dulce de leche and strawberry cheesecake varieties.
Kraft Heinz added Hersey Milk Chocolate and Reese’s Peanut Butter Cup dairy whipped toppings. Lakeview Farms introduced new grab-and-go layered single-serve desserts under the Cheesecake Factory brand.
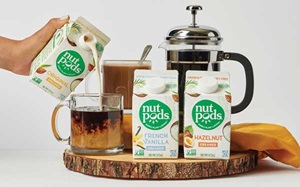 One-third of consumers use nondairy milk; 30% do so daily. Packaged Facts (2018c) projects that sales of nondairy milks will grow from $7 billion to $11 billion by 2021.
Nielsen reports sales of plant-based foods grew by 20% for the year ending June 30, 2018, to reach $3.3 billion. Sales of refrigerated nondairy milks topped $1.6 billion, up 9%; alternative meats were $670 million, up 24% (Leathers 2018b). Silk Protein Nutmilk Almond & Cashew contains 10 grams of protein and 40% less sugar than dairy chocolate milk.
Collectively, sales of all other alternative dairy products topped $697 million. Nondairy ice cream was $222 million, up 38%; nondairy yogurt, $162 million, up 55%; cheese alternatives, $124 million, up 43%; nondairy creamer, $109 million, up 131%; butter alternatives, $68 million, up 23%; nondairy dressings, $12 million, up 32%; and egg/mayo alternatives, $42 million, up 16% (Leathers 2018b).
Smaller refrigerated categories are posting impressive unit gains: refrigerated breakfast entrées are up 167%; snack cakes, +77%; refrigerated bread, +51%; nonaerosol whipped toppings, + 20%; refrigerated meat substitutes, +19.0%; prepared salad/coleslaw, +5.9%; pickles, +7.1%; flavored spreads, +5.4%—all for the 12 weeks ending Sept. 9, 2018, per IRI (Bovine 2018).
Unit sales increased 30% for refrigerated coffee; coffee concentrate unit sales were up 10.6%; fruit drinks were up 9.8%; and unit sales of ready-to-drink refrigerated teas climbed by 7.0% while orange juice units fell 14.8% (Bovine 2018). McDonald’s introduced its McCafé coffee drinks at retail.
Movable Feasts
 With snacks now accounting for half of all eating occasions and 59% of consumers saying they frequently eat snacks alone, the opportunities for fresh grab-and-go snacks are enormous. Most important, when consumers eat alone, they’re more likely to opt for fresh foods, per the Hartman Group (2016).
In 2017, sales of fresh snack kits jumped 45% (Lyons Wyatt 2018b). Retailers see a larger grab-and-go snack selection as the best way to fight competition to prepared food sales (Hamstra 2018).
With 53% of breakfasts, 45% of lunches, and 24% of dinners eaten alone, can more substantial fresh meal kits aimed at dayparts be far behind (Hartman 2016)?
Quaker Morning Go-Kit will help kick your day off with 18 grams of whole grains, real fruit, and nuts. Almark Foods’ Egg Buddies offer two cage-free hard-boiled eggs plus a separate container of dipping sauce.
Freshly Baked
Bread, bought by 56% of shoppers in a typical month, is the most purchased in-store bakery item. That is followed by doughnuts, bought by 38%; cookies, 30%; bagels, 29%; pastries, 24%; muffins, 23%; pies, 16%; croissants, 14%; cake slices, 12%; brownies, 10%; and ethnic/specialty, 4% (ProdegeMR 2018).
Millennials and Matures are the most likely to shop the in-store-bakery once a week or more; Gen Xers and Baby Boomers are less likely to so (ProdegeMR 2018).
Bakery department operators report that cookies are their best-sellers, followed by breads/doughnuts, cakes/tortes, muffins, celebration cakes, rolls, artisan breads, cupcakes, Danish/sweet rolls, bagels, Hispanic items, pies, and scones (Martin 2018).
For the year ending April 28, 2018, specialty desserts, muffins, brownies, doughnuts, and sweet goods posted the highest gains in units (Martin 2018).
Two-thirds of in-store fresh bakery operators report they offer gluten-free products; 43% offer nut-free products; 19%, egg-free; 16%, soy-free; and 2.7%, other allergen-free baked goods. About 2% do not offer any allergen-focused products (Martin 2018). Less than 5% of in-store-bakery products make a nutrition claim (IDDBA 2019).
Ancient grains (e.g., kamut, spelt, amaranth, and lupin), ranked fifth among the overall hot culinary trends for 2018; protein-rich grain/seeds (e.g., hemp, chia, quinoa, flax) ranked 16th (NRA 2017).
Four in 10 consumers want to explore international desserts (Mintel 2017b). Watch for classic French single-serve patisserie items and Italian mini classics to make a strong showing in the bakery case (e.g., opera cake, mille-feuille, macaroons).
Ethnic bread varieties, including brioche, naan, and bao, are among the fastest-growing breads on restaurant menus, per Datassential (2018).
And the future looks good; 57% of grocery operators say they will change their perimeter assortment in the next 12 months by introducing meal kits and more grab-and-go products, doing more cross merchandising and seasonal promotions, and focusing on clean label innovations (Hamstra 2018).
A. Elizabeth Sloan, PhD, a professional member of IFT and contributing editor of Food Technology, is president, Sloan Trends Inc., Escondido, Calif. ([email protected]).
References
Bovine, B. 2018. “Fastest Refrigerated.” Frozen & Refrigerated Buyer 10(4): 10, 12.
Browne, M. and M. Hamstra. 2018. “Front and Center.” Supermarket News 66(8): 38–52.
Busch, K. 2018. “The Power of Produce.” Progressive Grocer 97(10): 24.
Canning, K. 2018a. “2018 State of the Industry Report: Cheese Is a Standout on the Gridiron.” Dairy Foods, Nov. 8. dairyfoods.com.
Canning, K. 2018b. “2018 State of the Industry Report: Milk is Struggling in the Bunker.” Dairy Foods, Nov. 8.
Crawford, J., M. Rodriguez, and J. Parker. 2018. “Innovation and Trends in Dairy, Deli, & Bakery.” IRI webinar, July 18. Information Resources Inc., Chicago. iriworldwide.com.
Datassential. 2018 MenuTrends database and Menu Adoption Cycle research. Datassential, Chicago, datassential.com.
Dubois, C. and J. Parker. 2018. “New Consumerism & the Customization Continuum. IRI Top Trends in Fresh.” Webinar, Aug. 13.
Dudlicek, J. 2018. “Circling the Wagons.” Progressive Grocer 97(2): 74, 76–79, 81, 83.
Fleenor, G. 2018a. “The Pull of Produce.” Progressive Grocer 97(10): 70, 72, 74, 76.
Fleenor, G. 2018b. “The Name’s Familiar.” Progressive Grocer 87(9): 95.
Fleenor, G. 2018c. “Higher Education.” Progressive Grocer 97(7): 70, 72, 74
FMI. 2016. The Power of Meat. Food Marketing Institute, Arlington, Va. fmi.org.
FMI. 2017. The Power of Produce.
FMI. 2018a. U.S. Grocery Shopper Trends.
FMI. 2018b. The Power of Meat.
FMI. 2018c. The Power of Foodservice at Retail: Part 2.
FMI. 2017d. The Power of Produce.
Goldschmidt, B. 2018. “Sea Change.” Progressive Grocer 97(3): 62–64, 66, 68, 70, 71.
Hartman. 2016. The Future of Snacking. The Hartman Group, Bellevue, Wash. hartman-group.com.
IFIC. 2018. Food & Health Survey. International Food Information Council, Washington, D.C. foodinsight.com.
IDDBA. 2019. What’s in Store? International Dairy Deli Bakery Assoc., Madison, Wis. iddba.com.
IRI. 2017. Fresh Food Shopping Survey. Information Resources Inc., Chicago. iriworldwide.com.
Johnson, G. 2018. “Top 20 Fruits & Vegetables. Fresh Trends.” The Packer. thepacker.com.
Hamstra, M. 2018. “Fresh Takes.” Supermarket News 66(5): 38–40, 44, 46, 48–50.
Kresin, J. 2018a. “Sales Looking Bright. Fresh Trends.” The Packer 8–9.
Kresin, J. 2018b. “Solid Performers. Fresh Trends” The Packer 12–14.
Label Insight. 2016. The 2016 Label Insight Food Revolution Survey. Label Insight, Chicago. labelinsight.com.
Leathers, D. 2018a. “M’ M’M Good for You.” Frozen & Refrigerated Buyer 10(4): 72, 74.
Leathers, D. 2018b. “Plant-based Foods.” Frozen & Refrigerated Buyer 10(1): 26–28, 30, 32.
Lyons Wyatt. 2018a. “Holistic Health, Convenience. IRI’s Top Trends in Fresh Webinar Series, 1 of 5.” Information Resources Inc., Chicago. iriworldwide.com.
Lyons Wyatt, S. 2018b. “The State of the Snack Food industry.” IRI webinar, March 28. Information Resources Inc.
Lyons Wyatt, S., and C. DuBois. 2018. “Transparency & Social Strategy and Cultural Alignment.” IRI’s Top Trends in Fresh Webinar Series, 2 of 5. Information Resources Inc.
Major, M. and N. Taylor. 2018. “Top 7 Sizzling Meat and Seafood Trends.” Grocery Business 84(8): 42, 44.
Martin, K. 2018. “Proof of Life.” Progressive Grocer 97(6): 151, 152, 154, 155.
Mintel. 2017a. Small Appliances–U.S. Mintel Intl., Chicago. mintel.com.
Mintel. 2017b. Global Food & Drink Trends.
Mintel. 2018. “Fruits and Vegetables.” Progressive Grocer 97(10): 22.
NFI. 2017. “The Top 10 List Highlights Seafood Consumption Progress.” Press Release, Nov. 2. National Fisheries Institute, McLean, Va. aboutseafood.com.
Nielsen. 2017a. Clean Label Report. Aug. Nielsen, New York, N.Y. nielsen.com.
Nielsen. 2017b. “When it Comes to Protein, N. Americans Still Flock to Meat.” Press release, Sept. 15.
Nielsen. 2017c. “Getting Hooked on Seafood.” Press release, April 17.
Nielsen. 2018a. “Dressings/Salads/Prepared Foods.” Progressive Grocer 97(3): 18.
Nielsen. 2018b. “Dairy.” Progressive Grocer 97(10): 20.
NRA. 2017. What’s Hot 2018 Culinary Forecast. Dec. National Restaurant Assoc., Washington, D.C. restaurant.org.
Packaged Facts. 2018a. Trust, Transparency & Innovation: A Pet/Food Trends Perspective. April. Packaged Facts, Rockville, Md. packagedfacts.com.
Packaged Facts. 2018b. Meal Kits U.S. Trends & Opportunities. Nov.
Packaged Facts. 2018c. Organic and Clean Label Food Consumer in the U.S. Jan.
Packaged Facts. 2018d. U.S. Market Trends & Opportunities. May.
ProdegeMR. 2018. “Fresh Baked.” Progressive Grocer 97(6): 14.
Taylor, N. 2018. “Breaking Down the Barriers.” Grocery Business 86(10): 47, 48, 50, 51
Ypulse. 2018. Cooking/Food Trends Survey. New York, N.Y. Ypulse.com.Latest News


About the Author
