
People and Pets Go More Gourmet
From frozen teapops and breakfast cheese to cocktail-flavored pet treats, the specialty foods market is growing rapidly as a broad range of mainstream shoppers seek out distinctive products.

The pursuit of a more exciting food experience—anytime and anywhere, the personalization of food quality, and a need for more-serious health solutions have sent sales of specialty food/beverage products for people and pets soaring. In 2013, specialty retail food sales topped $70 billion; for foodservice products, the total was $18 billion (Tanner, 2014).
Three-quarters of U.S. consumers—or 225 million adults—purchased specialty foods last year, up from 46% in 2009. Men are now as likely to buy gourmet foods/drinks as women (Tanner, 2013).
While mainstream markets still account for two-thirds of gourmet food sales, sales in specialty food stores skyrocketed 42% from 2011–2013 and climbed 34% in natural food retailers (Tanner, 2014).
The U.S. natural and organic food and beverage markets collectively reached sales of $50.8 billion in 2012, up 12.7% and 10.8%, respectively (NBJ, 2013a). Global natural/organic food/beverage sales were estimated at $112 billion in 2013, up 10% over 2012 (NBJ, 2013b).
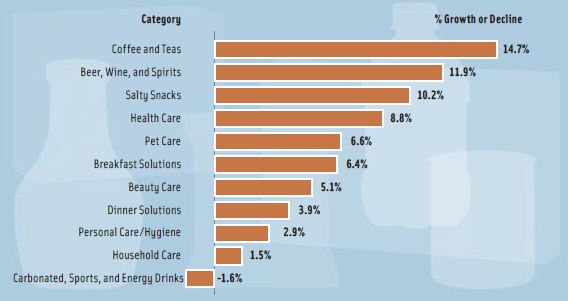
Coffee/tea; beer, wine and spirits; salty snacks; and pet care are among the food-based consumer packaged goods sectors that achieved above-average dollar sales growth over the past two years, driven for the most part by innovation and often new technologies (e.g., K-cups) on the premium end (Figure 1; IRI 2014).
Specialty Sales Surge
In 2013, 42% of all U.S. adult eating occasions and one-third (33%) of snacking alone occasions involved a more-sophisticated food experience characterized by gourmet flavors, compelling narratives, freshness, unique ingredient origins, and/or culinary traditions (Hartman, 2013a).
Two-thirds of adults buy specialty foods for everyday meals at home; 36% purchase them for everyday snacks; 30% for special occasions at home; 15% to have on hand for unexpected guests; and 13% to impress family/friends (Tanner, 2013). Those ages 18–24 are the top specialty food buyers followed by those ages 25–64. Use of specialty foods by seniors (age 65+) jumped 14% from 2011 to 2013 (Tanner, 2013).
Chocolate, specialty oils, and cheese were the most frequently purchased gourmet food items in 2013, bought by more than half of specialty food shoppers; yogurt, coffee, salty snacks, nonalcoholic beverages, frozen desserts/ice cream, meat/poultry/seafood, and specialty breads/baked goods were purchased by more than 40% (Tanner, 2013).
--- PAGE BREAK ---
Cheese/cheese alternatives was the largest specialty food category in 2013 with sales of $4 billion, up 16.1% from 2011, followed by frozen/ refrigerated meats, poultry, and seafood $2.2 billion, +17.6%; chips, pretzels, and snacks $2.2 billion, +19.1%; coffee, coffee substitutes, and cocoa $2.1 billion, +23.2%; and yogurt/kefir $1.9 billion, +20.4% (Tanner, 2014).
Greek other than feta, U.S. Southern, and sheep’s milk are among the hot cheese trends. Cheeseland Inc.’s KoKos Coconut Cheese and Sartori’s Espresso BellaVitano® Reserve Cheese are among the exciting new cheese flavors now available.
Wisconsin’s BelGioioso created bite-sized fresh mozzarella snacking cheese. Alabama’s Fromagerie Belle Chevre introduced Belle & the Bees Breakfast Cheese, a local goat cheese made with Tupelo honey. Rougette’s Grill Meister Grilling Cheese is barbecue ready.
Nut/seed butters was the fastest-growing specialty food category in 2013, up 51.6% in sales to $231 million. It was followed by eggs, +35.9% to $228 million; frozen desserts, +28.2% to $1.3 billion; refrigerated condiments, +28.1% to $382 million; and ready-to-drink tea/coffee, +25.2% to $565 million (Tanner, 2014).
American Culinary Federation (ACF) chefs named duck, quail, and emu eggs among the top culinary trends for 2014 (NRA, 2013). Maple Leaf Farms launched Applewood Smoked Duck Bacon.
DeeBee’s frozen TeaPops treats contain no caffeine and come in Southern Iced Tea flavor. Chloe’s Soft Serve Fruit Co.’s soft-serve fruit is made simply from real fruit and filtered water.
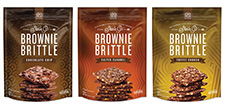
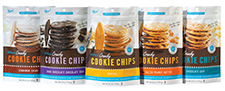 Specialty manufacturers continue to create new forms, flavors, and textures. Sheila G’s Brownie Brittle hybrid crisps contain only 120 calories/serving. HannahMax Baking’s super thin Crunchy Cookie Chips are made without artificial flavors or colors.
Carr Foods’ St. Pierre brand includes ready-to-use packaged brioche and fresh crepes. Sabine’s Collections Ltd. offers Baguette Crisps that are made from fresh-sliced baguettes and double-baked.
Epicurean Butter added a Maple Syrup variety. Conroy Foods Inc.’s Sandwich Shakers spice mixtures add pizazz to nearly any sandwich.
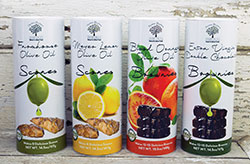
Sonoma Harvest’s balsamic vinegars are available in D’Anjou Pear and Peach White Vinegar varieties. Cherry, pumpkin, and tomato are among Strőger’s new specialty seed oils.
Vino de Milo bruschettas are made with real wines as are American Vintage’s wine and beer crackers, available in varieties like Chianti, Oregano & Crushed Red Pepper, and beer flavors.
Crunchtables™ Crouton Coated frozen vegetables deliver a new crispy texture for dinner vegetables or snacks. Gourmet du Village’s Chunky Country Homemade Ketchup is hard to differentiate from fresh salsa.
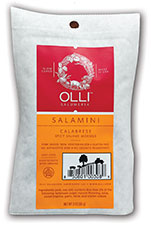 The mini gourmet trend continues with Olli Salumeria’s new Bite-Size Salamini, which includes a Calabrese variety. Zululand Queen Baby Pineapples from Frieda’s Inc., a specialty produce company, have an intense flavor and edible core.
Clearly, Frieda’s knows how to add an element of adventure to the specialty produce category. The company challenges consumers to “eat one fruit a day that scares you” (e.g., dragon fruit, cherimoya, or cactus pear).
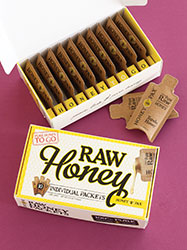 HoneyPax’s Raw Tupelo Honey Packets allow fans of the product to go so far as locating the bees’ yard of origin online.
Koppers Chocolate’s gourmet panned chocolates, glazed in uniquely spectacular iridescent finishes, live up to the name “eye candy.” Sanders Fine Chocolatiers’ decadent Orchard Collection Fruit & Snack Dips come in 2 oz single-serve cups.
The Blue Crab Bay Co.’s Crab House Nuts Gourmet Virginia Peanuts with Chesapeake Bay Seasoning and Ocean Beauty Seafoods’ Ocean Beauty Salmon Jerky reflect the hot trend of seafood snacks.
ACF chefs named heirloom and hybrid fruits/vegetables (e.g., plumcot, grapple, and broccoflower) and unusual/uncommon herbs (e.g., chervil, lovage, lemon balm, and papalo) as trendy for 2014 (NRA, 2013).
Dark greens (e.g., mustard or collard greens) and specialty potatoes remain strong gourmet trends (NRA, 2013). Fresh Solutions Network’s Side Delights Gourmet Petite Potatoes in Powerful Purple and Fusion Fingerling varieties don’t require peeling due to their small size and thin skin.
Eat Smart’s Ginger Bok Choy Vegetable Salad and Shanghai Blend Stir Fry Kits bring an ethnic gourmet flare to the salad aisle. Tru Table’s salad dressings and dips contain 9–12 g of protein per serving.
Non-wheat noodles/pasta (e.g., quinoa, buckwheat), black/forbidden rice, red rice, and pickled vegetables are trendy side dishes for 2014 (NRA, 2013).
--- PAGE BREAK ---
With 88% of Millennial consumer eating occasions including prepared or partially prepared foods vs 77% for other generations, specialty frozen and convenience foods are still an untapped opportunity (Hartman, 2013b).
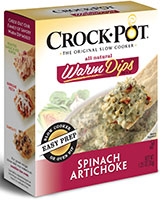 Sutter Buttes’ Meyer Lemon Olive Oil Scones baking mixes contain an oil pouch for healthier baking. Crock-Pot’s Slow Cooker Solutions makes warm crockpot dips and upscale recipes like Chicken Marsala easy.
Old Orchard Brands launched frozen canned concentrate drink mixes in Iced Sweet Tea and Iced Coffee varieties for more convenient and less costly preparation of specialty drinks.
Just over half (55%) of specialty shoppers bought Italian products or ingredients in 2013; 52% Mexican, 36% Chinese, 31% Greek, 30% Asian (Japanese, Korean, Thai, or Vietnamese), 24% regional American, 21% Spanish, 20% Mediterranean, 18% Hispanic (not Mexican), 14% Indian or French, 12% Middle Eastern, 8% Eastern European, and 5% African (Tanner, 2013).
Over half (54%) of specialty food importers expect Latin and Mediterranean cuisines to gain strength in 2014; 31% predict growth for Indian; and 23% expect African, Thai, and Vietnamese to gain ground. Other emerging cuisines the importers singled out include Chinese, Eastern European, Japanese, Korean, Russian, and Spanish (Tanner, 2014).
ACF chefs named Peruvian, Korean, Southeast Asian (e.g., Thai, Vietnamese, and Malaysian), regional ethnic, and ethnic fusion as the top trendy cuisines for 2014 (NRA, 2013).
The specialty ethnic ingredient market is also expected to grow. In early 2014, 55% of consumers had eaten Italian foods prepared at home; for Mexican fare, the figure was 51%. Other popular ethnic cuisines prepared at home include Chinese, prepared by 18%; Spanish 17%; Middle Eastern and Japanese 17%; Indian and Thai 13%; Greek 11%; and Korean 9% (Mintel, 2014a).
Those ages 18–24, the top specialty food buyers, are the most likely to prepare ethnic foods at home and to prepare them from packaged items; those ages 25–34 are most likely to prepare them from scratch (Mintel, 2014a).
Natural Priorities
Recent class action suits and the legal/regulatory complexity of making all-natural claims, growing interest in clean labels and products free of genetically modified organisms (GMOs), along with the advent of product certifications, are fueling a dramatic reorientation of the natural foods marketplace (NBJ, 2013a).
Clean-label attributes (e.g., made with all-natural ingredients), rank third behind an added or good source of nutrient claim and free from health claims as the most important criteria for making a food/drink healthy (Hartman, 2013c).
One-quarter (23%) of U.S. adults are serious clean-label advocates; 70% purchased what they perceived as clean-label foods/beverages in 2013 (MSI, 2013; Sloan, 2014).
In descending order, all-natural ingredients, recognizable ingredients, no artificial preservatives, no artificial ingredients, no added sugar, no high fructose corn syrup, and no MSG were the top clean-label attributes sought by consumers (MSI, 2013).
In 2014, more than one-third of consumers buy foods on a regular basis because they are labeled as natural, 35% local, and 32% organic, with the latter up from 27% in 2013 (IFIC, 2014).
Although four in 10 of the best-selling new foods/beverages introduced in 2013 carried a natural or organic claim, the number of new items with a natural claim has been falling (IRI, 2014; Vierhile, 2013).
Sales of organic foods/beverages jumped 12% in 2013 to reach $32.3 billion. Fruits/vegetables remained the largest category with sales up 15% to $11.6 billion. Organic condiment sales grew 17% to $830 million; snack foods 15% to $1.7 billion; bread/grains 12% to $3.8 billion; meat, poultry, and fish 11% to $675 million; packaged/prepared foods 10% to $4.8 billion; dairy 8% to $4.9 billion; and beverages 5% to $4 billion (OTA, 2014).
Beverages were the largest natural food category with sales of $5.9 billion, up 11% in 2012; packaged/ prepared foods sales were $3.9 billion, +9%; bread/grains $3.7 billion, +10%; dairy $3.3 billion, +31%; fruits/vegetables $2.6 billion, +10%; meat, fish, and poultry $2.4 billion, +14%; snack foods $1.7 billion, +10%; and condiments $1.1 billion, + 9% (NBJ, 2013a).
Although one-third of moms look for organic or natural foods, moms’ interest falls as their children age: 39% of those with kids under age two buy natural/organic foods; 33% of those with children ages 3–5; 29% of those with kids ages 6–11; and 25% of those with children ages 12–17 (Packaged Facts, 2012).
In the fresh departments, moms are more likely to choose organic over regular yogurt, meat/poultry, cheese, bread, and fresh produce; they’re 36% more likely to opt for organic frozen foods, 30% pasta, 28% sauces/marinades, 26% soups, 22% chocolate, and 17% breakfast cereal (Packaged Facts, 2012).
One-quarter (27%) of consumers are looking to organic foods/beverages to avoid GMOs (Packaged Facts, 2013a). Just over half (54%) associate organic with no-GMOs; 46% associate natural with being free of GMOs (Hartman, 2012).
--- PAGE BREAK ---
Middle-income mothers in their 30s with young children, especially those with children ages 6–11 and living in urban areas, are the most likely to make an effort to buy non-GMO foods/drinks (Packaged Facts, 2013a). Overall, one in five consumers (19%) sought non-GMO certified foods in 2013 (Hartman, 2013a).
With half of adults believing that imported foods are less safe than domestic products, a “grown/raised in the U.S.” descriptor can be a powerful product differentiator; eight in 10 consumers say they want to be informed if an organic product is from another country (IFIC, 2014; Consumer Reports, 2014).
One-quarter of consumers say they give a lot of thought and 48% give a little thought to the way their foods/drinks were farmed or produced (IFIC, 2014). Four in 10 are trying to avoid growth hormones in foods, up 10% from five years ago; 27% look for antibiotic-free on the label (Hartman, 2013b).
Animal welfare is very important to 52% of consumers when purchasing meat; seven in 10 Millennials place a high priority on the humane treatment of animals (Hartman, 2013b,d). In consumers’ minds, grassfed, pasture-raised, free range, cage-free, and kosher also convey health and flavor benefits. Organic Valley’s new Grassmilk comes from cows fed only fresh grasses and dried forages with no supplemental grains or soybeans.
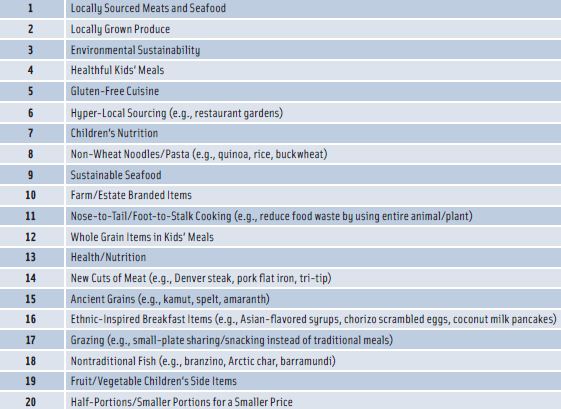
Hyper-local sourcing (e.g., restaurant gardens) is among the ACF chefs’ hot culinary trends for 2014, coming in at No. 6 on the list; farm/estate branded items are tenth (NRA, 2013). See Figure 2 for a list of the top 20 trends.
Although 74% of Americans are familiar with the term sustainability, those who say it has a significant impact on their food/beverage purchases fell from 52% in 2011 to 38% in 2013 (Hartman, 2013b; IFIC, 2014). And just one in five consumers report looking for products that are Fair Trade certified (Hartman, 2013b).
Pampered Pets
 With four out of five pet owners considering their pet a member of the family and 79% saying the quality of their pet’s food is as important as their own, it’s not surprising that the premium sector accounted for 40% of the $26 billion U.S. pet food market in 2013; superpremium accounted for 10% (Mintel, 2013a; Packaged Facts, 2014).
In 2013, more U.S. households had dogs than children (39% vs 32%); 25% had cats; and 11% both dogs and cats (Packaged Facts, 2014).
Adding excitement to a pet’s diet via flavors, gravies, look-a-like human recipes, daypart foods (e.g., breakfast food/eggs or appetizers) was a top driver of the best-selling new pet foods in 2013 along with improving the pet’s health (IRI, 2014).
Evanger’s Super Premium line of cat foods offers a Seafood & Caviar Dinner; Fromm has a Gourmet Bird SKU. Energy bars are among the new pet treats; pet beverages remain an enormous untapped opportunity.
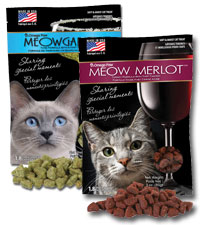 Omega Paw expanded its Brew Buddies and Meowtinis treats for dogs and cats with Meowgaritas and Meowmerlot flavors.
Half of new pet foods touted added vitamins, antioxidants, protein, DHA for puppies/kittens, and no fillers, artificial ingredients, or byproducts (IRI, 2014). Sales of natural pet foods totaled $4.1 billion in 2012 (Packaged Facts, 2014).
The Paleo Diet has created a new sector of “ancestral” foods reflective of the earlier wild diets of canines and felines. Such products are focused on high-quality protein and free of grains (e.g., EVO’s Ancestral Diet for dogs).
Fresh pet food is another sector with dramatic growth. Market leader Freshpet forecasts sales of $100 million in 2014, up 300% over the past three years (Packaged Facts, 2014).
With 45% of dog owners and 46% of cat owners having a pet age 7 or older and 53% of dogs and 58% of cats overweight, the need for functional and therapeutic pet foods is great (APOP, 2013).
--- PAGE BREAK ---
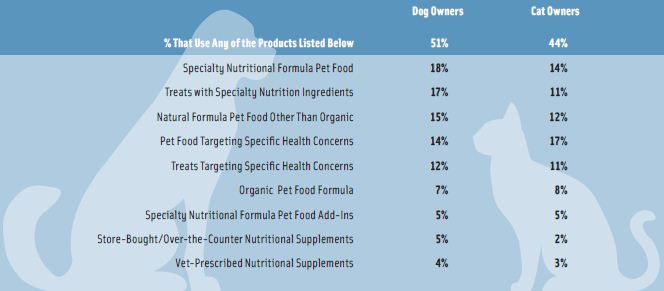
Older pets suffer from joint, coronary, cognitive, and immune issues as well as diabetes and cancer. Products to address oral care, weight, and skin/coat are other emerging needs. See Figure 3 for a breakout of what consumers are seeking in pet food.
Iams ProActive Health Adult Weight Control and Iams Sensitive Naturals Ocean Fish and Rice for allergic pets were among the most successful new pet foods in 2013 (IRI, 2014).
With fear of contamination/product safety a key concern for 51% of dog owners and 44% of cat owners, “made in the U.S.” has become a very important pet food claim (Packaged Facts, 2014).
Specialty Liquor
Those ages 22–34 are the heaviest users of alcoholic beverages and the most likely to try a new alcoholic drink, so it’s to be expected that unique flavors, less-familiar foreign liquors, and craft/artisan brews have brought excitement to the liquor segment (Mintel, 2013b).
U.S. spending on alcohol has risen every quarter for the past four years (Wong, 2014). Two-thirds (64%) of adults age 18 or older drink alcoholic beverages (NIH, 2014).
In 2013, 53% drank spirits, 52% wine, 46% regular domestic beer, 43% regular imported beer, 42% light domestic beer, 35% craft/ microbrew beer, 33% light imported beer, 31% ready-to-drink, premade cocktails or flavored alcoholic beverages, 23% hard cider, 18% malt liquor, and 14% nonalcoholic beer (Mintel, 2013b).
On-site barrel-aged drinks top the list of trendy alcoholic beverages for 2014, cited by 69% of ACF chefs. This was followed by regional signature cocktails cited by 64%; flavored/herbed tonics 58%; organic cocktails 55%; botanicals in cocktails (e.g., flower essence, lavender) 54%; skinny/lower-calorie cocktails 53%; custom shapes/flavored ice 50%; and bottled/ house-bottled cocktails 48% (NRA, 2013).
More than one-third (37%) of wine drinkers would drink more wine if it had fewer calories; 41% would drink more spirits (Mintel, 2013b,c,d). Thus it stands to reason that Skinnygirl Cocktails—low-calorie alcoholic drinks—were among the best-selling new products of 2013 (IRI, 2014).
Nearly one in five consumers (17%) are interested in all-natural wines. Low-alcohol wines are another fast-emerging wine trend coming from Europe (Mintel, 2013c).
Many say they’ll drink less beer and more wine and spirits in 2014 (Mintel, 2013b). Four in 10 beer drinkers would like to know how their brew is produced; 37% are interested in smaller beer producers (Mintel, 2013b).
Beer, wine, and spirits were among the top 10 fastest-growing categories in convenience stores over the past five years (IRI, 2013).
Bud Light’s Lime-A-Rita was the fifth-best-selling new food/beverage in 2013, bringing in $113.1 million in year-one convenience-store sales plus $97 million in mass channels (IRI, 2014).
 Despite the proliferation of new products, 77% of spirits drinkers say they would still be interested in trying new spirits with unique flavors; 67% are interested in less-familiar spirits from other countries (e.g., cachaça rum, sake, or Chinese baijiu); and 55% have an interest in more artisan/craft spirits (Mintel, 2013c). Fair Quinoa Vodka is made from organic Bolivian quinoa.
Nearly three-quarters (71%) of dark spirits drinkers would like more craft/artisan liquors and hybrid spirits (e.g., cognac blended with wine) (Mintel, 2013d).
Gourmet mixers and flavored glass rimmers, including margarita salt, are also enjoying brisk sales (Tanner, 2014). Tonics now come in wild ginger and hibiscus lemon flavors; bitters in sassafras and sorghum; and Bloody Mary mixers with Sriracha and barbecue infusions.
Venue Menus
With such widespread interest in specialty foods, marketers have an enormous untapped and very lucrative opportunity, which they might achieve by better aligning with today’s grab-and-go lifestyles and the retail venues that cater to them.
As convenience stores continue to successfully compete with quick-service restaurants and grocery outlets, they continue to upgrade their culinary quality and healthful product assortments, creating new outlets for specialty foods.
In 2012, convenience stores posted foodservice and prepared food sales of $27.6 billion, +4.7%; packaged beverages $23 billion; edible grocery $9.8 billion; salty snacks $4.9 billion; wine/liquor $2.3 billion; ice cream/frozen novelties $1.9 billion; and alternative snacks $1.8 billion (Anon., 2013).
Forty-three percent of U.S. consumers were regular visitors to convenience stores in 2013 (Mintel, 2014b). Those ages 18–44 are the most frequent convenience store customers (Lisanti, 2013).
--- PAGE BREAK ---
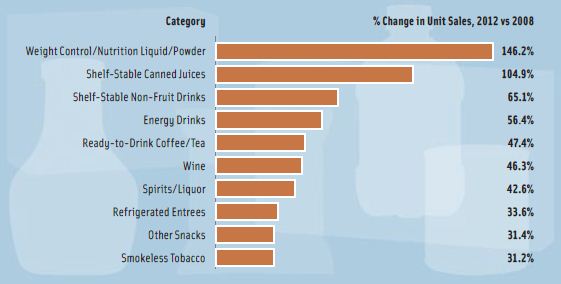
In January 2014, 61% of those visiting a convenience store purchased prepackaged foods (e.g., chips, candy); 57% prepackaged drinks; 43% self-serve coffee or made-to-order coffee drinks; 40% self-serve beverages from a fountain machine; and 33% fresh prepared food made in-store (Mintel, 2014b). Convenience stores’ fastest-growing items now mirror product sales in traditional grocery outlets (Figure 4; IRI, 2013). 7-Eleven has announced a plan to grow fresh foods from 10% to 20% of its sales.
Food/beverage vending machine/kiosk revenues are projected to reach $12 billion by 2015; 30% of U.S. adults buy food/drink regularly from a vending machine (Packaged Facts, 2013b).
Nearly one-quarter (23%) of food/drink vending machines are located in manufacturing locations; 20% are in offices, 8.5% elementary schools, and 6.6% colleges (Refermat, 2013). Snacks account for 57% of vended eating occasions; lunch 24%, breakfast 10%, and dinner 10% (Packaged Facts, 2013b). Sales of vended cold beverages reached $5.8 billion in 2012; candy, snacks, confections were $4.1 billion, vended foods $1.2 billion, and hot beverages $730 million (Refermat, 2013).
With 128,000 refrigerated food vending machines in service in 2012, 53,000 frozen food vending units, and 1,000 food systems designed to prepare and serve hot foods (e.g., pizza, French fries, etc.), the future for more upscale vended foods looks strong (Refermat, 2013).
More sophisticated and healthier single-serve opportunities at the check-out counter/front-of-store represent yet another opportunity for specialty foods.
Confectionery currently accounts for 36% of front-end sales, beverages 29%, and snacks 3.6%; for front-end profits, the figures are, respectively, 37%, 28%, and 2.8% respectively (Turcsik, 2013). Health food, gourmet/natural, and drug stores frequently lack for more sophisticated upfront food and beverage items to entice consumers as they exit the store.
Grab-and-go delis are another critical channel for specialty foods. Six in 10 deli operators plan to enhance their rotisserie program in 2014; 58% their sandwich offerings; 53% catering; 26% soup stations; 25% sushi; 22% hot/cold bars; 12% antipasto bars; 10% concept stations (e.g., Asian kitchens, pasta, carving, etc.); and 6% the beverage bar (Chanil and Dudlicek, 2013).
Food trucks are another niche venue with high potential for specialty foods; two out of five consumers have purchased items from a food truck (NRA, 2013).
Lastly, upscale private label brands represent another high-potential opportunity. Supermarket retailers ranked expanding their private label/store brands sixth on a list of their best investments for the next five years, right after updating technology and remodeling/expanding new stores (Anon., 2014).
Three-quarters of adults are actively buying specialty foods, and even the traditionally less-interested consumers (e.g., those age 65+ and Hispanics) are now going gourmet. Thus the food and beverage industries will continue to be challenged to deliver cutting-edge culinary excitement, indulgent in-home restaurant experiences, and healthier and less-processed foods. It will be essential to stay on top of global tastes, cuisines, and traditions; advances in farming/production techniques; and new food technologies.
A. Elizabeth Sloan, Ph.D., a Professional Member of IFT and Contributing Editor of Food Technology, is President, Sloan Trends Inc., 2958 Sunset Hills, Suite 202, Escondido, CA 92025 ([email protected]).
References
Anon. 2013. Convenience Store News industry report 2013. Convenience Store News 49(6):42-43, 46, 48, 50.
Anon. 2014. 81st annual report of the grocery industry. Progressive Grocer 93(4): 32, 34, 36, 40, 42, 44, 46, 48, 50, 52.
APOP. 2014. National pet obesity awareness day survey. Oct. Assn. for Pet Obesity Prevention, Calabash, N.C. www.petobesityprevention.org.
Chanil, D. and Dudlicek, J. 2013. Deli operations review: over the counter. Progressive Grocer 92(6): 137.
Consumer Reports. 2014. Organic food labels survey. March. Yonkers, N.Y.
Hartman. 2012. Organic and natural. The Hartman Group, Bellevue, Wash. www.hartman-group.com.
Hartman. 2013a. Eating occasions compass database and analytics.
Hartman. 2013b. Health + wellness: a culture of wellness. Winter.
Hartman. 2013c. Reimagining health & nutrition.
Hartman. 2013d. Millennials in focus: the emerging food culture of the young & restless. Presented at the Culinary Inst. of America’s Worlds of Flavor Conference, Napa Valley, Calif., Nov. 14-16.
IFIC. 2014. 2014 food & health survey. International Food Information Council Foundation, Washington, D.C. www.foodinsight.org.
IRI. 2013. Convenience stores. Times & Trends. May/June. Information Resources Inc., Chicago, Ill. www.iriworldwide.com.
IRI. 2014. New product pacesetters. Times & Trends. March.
Lisanti. L. 2013. Food for thought. Convenience Store News Consumer Insights Special Edition. April.
Mintel. 2013a. Pet food—U.S. March. Mintel Group Ltd., Chicago, Ill. www.mintel.com.
Mintel. 2013b. Beer—U.S. Dec.
Mintel. 2013c. Wine—U.S. Oct.
Mintel. 2013d. White spirits—U.S. Nov.
Mintel. 2014a. Ethnic foods—U.S. Jan.
Mintel. 2014b. Convenience stores—U.S. March.
MSI. 2013. The 2013 Gallup study of clean food & beverage labels. Multi-sponsor Surveys, Princeton, N.J. www.multisponsor.com.
NBJ. 2013a. Has the moment arrived? Nutrition Business Journal XVIII (9): 1, 3-7.
NBJ. 2013b. Global nutrition. XVIII (11/12): 1, 3-21.
NIH. 2014. National survey on drug use and health (NSDUH). Feb. https://nsduhweb.rti.org/respweb/homepage.cfm.
NRA. 2013. What’s hot 2014 culinary forecast. Oct./Nov. National Restaurant Assn., Washington, D.C. www.restaurant.org.
OTA. 2014. American appetite for organic products breaks through $35 billion mark. Press release, May 15. Organic Trade Assn., Brattleboro, Vt. www.ota.com.
Packaged Facts. 2012. Moms as food shoppers. Nov. Packaged Facts, Rockville, Md. www.packagedfacts.com.
Packaged Facts. 2013a. Non-GMO foods: U.S. market perspective. Sept.
Packaged Facts. 2013b. Food and beverage vending trends in the U.S. Jan.
Packaged Facts. 2014. The U.S. pet market outlook 2014-15. April.
Refermat, E. 2013. The wait for recovery is over. Automatic Merchandiser June: 24-37.
Sloan, A.E. 2014. Coming clean. Food Technol. 68(5): 26.
Tanner, R. 2013. Today’s specialty food consumer 2013 annual report. Specialty Food Magazine 43(7): C2-C16.
Tanner, R. 2014. The state of the specialty food industry 2014. Specialty Food Magazine 44(2): 2A-16A.
Turcsik, R. 2013. Grocery Headquarters 79(12): 37-40, 42.
Vierhile, T. 2013. The natural and clean label market opportunity. Presented at Natural & Clean Label Trends 2013 Online Event by Food Navigator, June 26. www.foodnavigator-usa.com.
Wong, V. 2014. An intoxicating new year: America’s alcohol sales on the rise. http://www.businessweek.com/articles/2014-02-11/an-intoxicating-new-year-americas-alcohol-sales-on-the-rise. Accessed May 23, 2014.