
Healthy Vending and Other Emerging Trends
From vending of healthful foods and beverages to blood sugar management, food technologists are following a new recipe for growth.
It’s a whole new world out there—energizing beers and spirits, frozen baby food and even espresso in self-heating cans—and it’s moving at a record pace. An unprecedented and aggressive focus on healthier eating to prevent unhealthy conditions later in life, an overwhelming demand for immediate-consumption easy-access foods and beverages, and new generations with very new attitudes, have already re-charted the future of food. This article will discuss a series of high potential up-and-coming markets and identify those niche markets likely to move mainstream.
 Healthy Vending
With more than 7 million vending machines—and 100 million Americans using them every day—the $33-billion vending industry has the power to provide almost instant access to fresh and convenient meals, snacks, and beverages 24/7 and the potential to achieve astronomical growth in the next decade. High-tech machines allow fresh food to stay fresh longer, frozen foods to be heated, and beverages to be mixed “just for you.” Just under one-third of vending machines (30%) are located in manufacturing settings; 16% in schools/colleges (Maras, 2004a).
Despite the negative image of vending machines as obesity-promoting purveyors of junk food and sugary beverages, healthy eating might just be the biggest vending sales opportunity yet. Caught off guard by low-carb and healthier-eating movements, sales of cold beverages fell from $7.1 billion in 2000 to $6.0 billion in 2003, while candy, snacks, and confections dropped from $6.3 billion to $4.0 billion, with the exception of nuts and meat snacks, which posted gains; milk led all product categories with a 45% sales gain (Maras, 2004a).
Most recently, health advocates have turned to healthy school vending as a means to help slim the ranks of overweight kids. Adding to the controversy, recent research suggests that caffeine-laden sodas may have played a role in tripling the incidence of hypertension in children over the past decade. As of January 2005, 26 states were developing legislation to curtail vending of “junk food,” sugary beverages and other “unhealthy” items on school grounds. One-quarter of elementary and 87% of high school children have access to school vending; 50% of all school children have access to school stores/snack bars, and 77% of children use them at least once a week (Sodexho, 2003).
And a win-win situation it will be. In a recent Management Science Associates, Inc. (Maras, 2004b) survey regarding school snack machines, vending operators were found to be increasing their offerings of nontraditional, vendible, “better-for-you” snacks. “Food snacks”—meat, cheese, and pickle snacks—and nuts/seeds were the largest first-year sales gainers. Gains posted by food snacks far outpaced those for crackers, baked goods, salty snacks, chocolate candy, gum, mints, and non-chocolate candy. Nabisco’s Fruit Snacks and General Mills’ Bugles Nacho Cheese were the first- and second-fastest-growing items.
School milk vending, whose market potential is estimated at 130 million 16-oz plastic single servings of milk per year, is another success story. In the Fluid Milk Strategic Thinking Initiative School Test, FMSTI (MPEP, 2004a), sales of single-serve milks remained strong—280 units/machine—and steady throughout the test period. Two-thirds of students bought vended milk—30% once a week—which translates to one incremental gallon of milk/student/year. Milk also did not cannibalize sales of other products in the vending bank. Chocolate milk (27%) and strawberry (60%) lead consumption of vended milk, although new flavors like banana are coming on strong. Coca-Cola’s Swerve and Dr Pepper/7-Up’s Raging Cow flavored milks, Mac Farms Inc.’s E-moo 100% carbonated milk drink, and Nestlé’s Chocolut milk in a can were among the first “new generation” of vending-focused kid-flavored milks. The 2004 Child Nutrition Act gives foodservice directors even more flexibility in serving milk.
--- PAGE BREAK ---
But today, healthy school vending goes way beyond milk. Stonyfield Farm, the leading United States marketer of organic yogurt, launched its “Menu for Change Program” in 2003, introducing the first “healthy-product-only” branded school vending machines. The machines contain only products that meet local and/or state nutrition guidelines and have passed student taste tests. Although products vary by region, the machines generally contain a variety of natural and organic snacks and beverages, such as Stonyfield Farm Smoothies, Stacy’s Pita Chips, Newman’s Own Pretzels, Organic Valley Milk, Silk’s Soymilk, EnviroKidz Granola Bar, and Robert’s Pirate Booty.
Stonyfield Farm’s product selection process is based on California’s FSB-19 guidelines for snacks sold outside the federal meals program: no more than 35% calories from total fat, 10% calories from saturated fat, and 35% sugar by weight. Naturally occurring fats like those in nuts and seeds are the only exemption. Stonyfield Farm supports 100% of the lease cost for the machine for one year, helping to dissuade the concern over the potential loss of discretionary school revenues garnered from soda-based machines.
On January 13, 2005, the National Automatic Vending Merchandising Association announced its anti-obesity program to encourage healthy food choices. The program includes use of color-coded stickers on vending machines to flag more-healthful items.
But healthy vending isn’t just for kids. The Compass Group has launched “Balanced Choices,” a vending system that offers only better-for-you foods and beverages. Salads, fresh fruit, yogurt, meal replacement beverages/bars, smoothies, diet soda, energy drinks, and fair trade/organic coffee are among the items included (NNB, 2004). Vended milk is also a big hit with grownups. In an FMSTI multi-channel milk study (MPEP, 2004b), post-installation sales remained high—nearly 80% across all vendors, better than the industry average of 50–60%. Flavored milk represented 27% of category growth. Vendors that carried 7 or more SKUs sold almost twice as much milk as those that carried only 4 products. New and exciting adult flavors like orange cream and mocha cappuccino are fast grabbing attention.
• Shoppers Shifting to Functional Beverages. It appears that the shift from sugary to more functional drinks in the vending channel may be beginning to play out in the mass market. Information Resources, Inc. (IRI, 2004a) reported that sales of energy drinks jumped 56% in mass channel sales, refrigerated soy milk 24%, bottled water 10%, and sports drinks 10%. Although low-calorie soda sales grew 9% and lite beer 2%, they have not kept pace with more-functional beverages such as Gatorade, while sales of carbonated soft drinks declined overall.
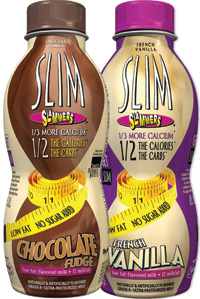
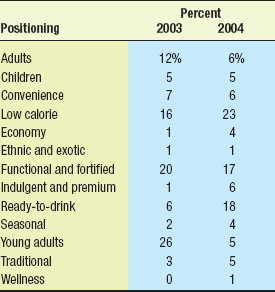 Although recent soft drink innovation has focused on lower-calorie options, like Pepsi Edge and Coca-Cola’s forthcoming Coke Zero, “near” fruit-flavored waters and fortified waters will also come on strong. Examples include CCW Holding’s naturally high-calcium Sanfaustino Aqua Minerale and Apple & Eve’s fortified Water Fruits for kids and fortified soft drinks such as 7-UP Plus for women. The Natural Marketing Institute (NMI, 2004a) observed that of the 48% of consumers who bought a regular soda in the past three months, 69% also purchased natural soda, 38% functional soda, and 12% low-carb soda. Of the 53% who bought a diet soda, 44% bought natural diet soda, 37% functional diet soda, and 18% low-carb soda. Switch Beverage Co.’s Switch all-natural 100% carbonated juice drinks, Quaker Oat’s Milk Chillers, Bravo! Foods’ Slim Slammers (milk), 8th Continent’s Light Soymilk, and Silk’s omega-fortified, heart-healthy Soymilk are other important market additions. Low-calorie positioning dominated new beverage launches in 2004, followed by ready-to-drink/immediate consumption and functional and fortified drinks (Table 1; Innova, 2004).
--- PAGE BREAK ---
• Better-for-You Snacks. With more than half of shoppers (55%) making a lot of effort to eat healthfully, half of Americans already regular snackers, and one-third of consumers either skipping a meal or grazing all day, the demand for more healthful snacks—and healthier versions of America’s favorite snacks—are at an all time high. Mintel (2004a) reports that the healthy snack market grew 41% in 2003 to $5.5 billion and projects sales will reach $7.2 billion by 2008. And, America’s top marketers have responded. In the coming months, the “0 grams trans fat” message will appear on many Frito-Lay snacks, including Lay’s, Ruffles, Doritos, Fritos and Cheetos. Frito-Lay now offers a wide variety of healthy options including Edge low-carb snacks, Lay’s baked chips, a natural and organic line of familiar brands, and Rold Gold Heartzels.
Pillsbury offers sugar-free ready-to-bake chocolate chip cookies, Hershey a low-carb Kit Kat, and Kraft Foods Inc. a number of its best-sellers from Wheat Thins to Chips Ahoy in 100-calorie packs. IRI (2004b) reports that healthy snacks for those age 55+ as well as highly health-conscious minority groups, such as Hispanics, are a virtually untapped opportunity.
Healthy Markets
Carb counting and low-carb dieting—which has been a fact of food life for the past two years—has created a major shift in the marketplace, according to IRI (2004a). Carb-counting shoppers generated growth shifts from shelf-stable grocery, bakery, and frozen departments to dairy and deli, where consumers sent sales of eggs, bacon, and natural cheeses soaring. Breakfast solutions and salty snacks have led shopper growth in the past two years—a shift from the faster pace of beverages and dinner solutions, which dominated growth in the prior two years. With the low-carb craze maturing into a lifestyle, we’ll likely see a reorientation of consumer spending in various categories and some renewed interest in pastries, pastas, and breads, now characterized among little food “luxuries” and decadent menu additions.
• Low-Carb Goes Low-Cal. More than half of shoppers (55%) say that health concerns have a lot of influence on their grocery purchasing decisions. And for the past two years, a lot of the influence has had to do with low carbs (FMI, 2004a). Shoppers appear to be moving from counting carbs to counting calories. IRI (2004a) reports that sales of naturally low-carb products—such as poultry, bottled water, diet, and meat snacks which drove the low-carb movement—and low-carb brands appear to be slowing. Combined sales of these two categories fell from 6.8% for the most recent 52 weeks ending 9/5/04 to 6.7% for the most recent 24 weeks and 5.6% for the last 12 weeks ending 9/5/04. During the same time period, unit growth dropped from 1.5% to 0%.
Low-carb weight loss dieting also appears to have peaked in early 2004. In the last week of January 2004, 9.1% of people were on a low-carb “diet” compared with 3.6% in November. Nearly three-quarters of consumers used low-calorie foods and beverages in 2004, 71% low sugar, 63% sugar-free, 60% low-carb, and 55% artificial sweeteners (NMI, 2004).
While controlling total calorie content and counting calories appears to be the hot new approach to losing weight, carb concerns—especially sugar—aren’t likely to go away. Much of consumers’ carb counting was subconscious and likely reflected their deep-seated beliefs that eating too much bread, pasta, desserts, or starches caused weight gain. Looking at attitudinal data prior to the low-carb movement, the number of consumers who thought that bread was fattening grew from 38% in 1996 to 56% in 2002, that pasta was fattening grew from 29% to 54%, and that starch should be avoided grew from 36% to 48%; those who thought complex carbs were good for them fell from 72% to 63% (WFC, 2002).
The concern for calorie reduction is also driving the increased use of artificial sweeteners. Just over one-third (38%) of consumer use sweeteners to reduce calories (up 13% in the past two years), 29% when dieting (up 10%), 24% to reduce carbs, and 16% for a diabetic diet (up 2%). However, 53% say that they are concerned about the negative side effects of artificial sweeteners (NMI, 2004a).
--- PAGE BREAK ---
• Low-Fat, Low-Trans. The advent of trans-fat food labeling in January 2006 and recent FDA-qualified health claims for olive oil and monounsaturated fats may well bring back a new generation of low-fat foods. Fat (71%) and calories (70%) are back on top of the list of items consumers checked most often when they read a packaged food label (FMI, 2004a). Just over half (57%) looked for the sugar content, 45% sodium, 40% carbs, 30%, 25% trans fats, and 25% vitamins. One-quarter (27%) of consumers put a product back on the shelf due to fat content and 22% because of carb content. And, with one in four Americans already having one or more forms of coronary disease, 107 million high cholesterol, and 100 million high blood pressure or pre-hypertension, they’ll bring a new zest for reduced-sodium and other heart-healthy products.
New markets such as women’s heart-health, risk-factor management in children, and new biomarker-driven segments such as those involving homocysteine level control and the role of C-reactive protein and inflammation are other fast-moving segments. New research from IRI (2005) indicates that when shoppers come into a supermarket pharmacy to pick up heart-related prescription medication, cross-marketing of foods and beverages to these individuals through potential “connector” products, such as diet soft drinks, represents a $71-billion untapped front-end sales opportunity.
With 24% of adults having two or more risk factors for heart disease and one-third of them having three—obesity, hypertension and high cholesterol—the demand for foods and beverages that address a combination or risk factors will continue to grow.
• Blood Sugar Control. Without a doubt, the biggest issue that will dominate the healthy food market—and help to keep carb concerns center stage—is the issue of blood sugar management and low glycemic foods. Although long known for its critical role in managing diabetes, proper blood sugar management has also been associated with lifestyle issues including cravings, mood swings, endurance, appetite control, and the ability to concentrate. More important, it may well be a key element in weight control and is one of the symptoms of Metabolic Syndrome (MetS), which predisposes people to Type 2 diabetes and heart disease. An estimated 47 million Americans already have MetS, 49-69 million exhibit insulin resistance, and 41 million have “pre-diabetes”—a formal new medical category. More than 1 million children ages 12-19 already have MetS (AHA, 2005). About 18 million Americans have diabetes, and there are 1.43 million new cases each year.
HealthFocus reports that 61% of American adults want more information on foods that help manage blood sugar, 53% want details on the blood sugar and insulin connection, and 48% are interested in the glycemic index (GI)—one of the measures for determining a food or beverage’s ability to impact blood sugar levels. NMI reports that 2004 showed breakthrough awareness levels in net carbs (66%), ketosis (52%) and the glycemic index (33%). One-quarter of consumers said they, or someone in their household, are trying to manage or treat weight loss (appearance) 50%, weight loss (health), hypertension 31%, blood sugar level 24%, diabetes 20%, and hypoglycemia 6%. One-quarter have added some foods to their diet to keep blood sugar stable (NMI, 2004a).
With tiredness in the top three health concerns in all regions of Western Europe, and 150 million already suffering from diabetes worldwide—expected to double to 333 million by 2025—the launch of low glycemic foods/beverages, or at least the labeling of products as such, is certain to be one key trend in the next few years (Innova, 2004). In Belgium, Novartis launched a low GI bar InZone in two versions—one with polydextrose and the other with oligofructose. InZone is also availabile as a powdered drink mix. Tesco supermarkets in the UK has declared 200 of its products low GI (Innova, 2004). Australians have an on-pack symbol to flag low glycemic foods.
The Luxury Food Movement
Although affluence is not widespread, a new affluent attitude is—and it’s causing consumers to “trade up” and treat themselves to premium foods, beverages, and services, creating lucrative opportunities at the high and low ends of food markets. New luxury products typically account for 20% of a category’s unit volume, 40% of its dollar volume, and 60% of its profits (BCG, 2004). Datamonitor (2004) projects that the U.S. premium-food market will grow 30% to $94 billion by 2008.
--- PAGE BREAK ---
• Soul Foods. Premium products that offer an emotional connection allow consumers to reflect their personal lifestyle (e.g., Jim Beam Kentucky Bourbon Sunflower Seeds or Remy Martin’s Strawberry Kiwi Infusion cognac) or simply provide a “take-time-for-me” indulgence are fast finding new devotees. Handmade artisan chocolates in a decadent diet variety or with an unexpected spicier notes or retro-twist still dominate sales in premium markets. Super-premium blends of Kenya, Sumatra, and Sulawesi coffees take drinkers on an exotic escape, while artisans like Peets Coffee & Teas who hand-roast daily in small batches and ship in less than 24 hr create an emotional bond, with its carefully cared-for, “just-for-you” coffees. Starbucks brought us Chantico, a steamed milk beverage once available only from small artisan chocolatiers abroad. Micro-brewed iced teas and cold-brewed coffees, white teas—once the privilege of Emperors—indulgent dessert teas like Hain Celestial’s English Toffee Tea and spiced natural ciders are other take-time-for-me premium concepts. Not surprisingly, McDonald’s is expected to roll-out “premium coffee” in 2005–06, while Starbucks, with 12% of its revenues from food, eyes the nosh side of the market.
• Premium Mainstream. Indulgent dessert-flavored yogurts such as Yoplait’s Custard-Style Crème Caramel are the fastest-growing segment of the yogurt business, while exotic natural cheeses top the list of mass-channel food sales (IRI, 2004a). Other fast-emerging premium markets include flavored nuts; dried and liquored fruits such as Brickstone Fruits’ Select Blueberries in Peach Schnapps; and crackers such as American Vintage’s Wine Biscuits’ in Chianti, Oregano and Crushed Red Pepper flavor.
Bumble Bee Seafoods’ Bumble Bee Prime Fillet Albacore Steaks and Allen Brothers Kobe-Style Beef Pastrami are among the new premium protein offerings. Sales of new upscale “meal products” jumped 538%, gourmet soups 35%, and pet food 35% (Mintel, 2004a).
Upscale casual dining is a new restaurant segment that allows consumers to enjoy premium foods in a classy but casual environment at a more reasonable cost. For example, Bonefish Grill, the third-fastest-growing restaurant chain in 2004, has found a niche between gourmet and low-end seafood houses (Technomic, 2004a). Fast-food followers want premium foods, too. Burger King offers an Angus Steak Burger, Carl’s Jr. a Pastrami Burger, and Au Bon Pain artisan breads made with organic flours and Guérande Sea Salt.
The Years Ahead
By 2020, 50–80 million people are projected to be added to the U.S. population, and they’ll raise total food spending by 26%, or an additional $208 billion (Blisard, 2004). Away-from-home food spending will grow 27.5%; foods for in-home dining 24.3%. Fruits, especially apples and citrus; vegetables and potatoes, with the exception of fried potatoes; and fish/seafood will enjoy the largest increases in per capita consumption. Fish, certain fruits and vegetables, nuts, seeds, and grains will top the list of the largest gainers in away-from-home spending. America’s changing ethnic mix will boost consumption of fruits, beef, fish, and poultry.
• The Boomer Bonus. It’s time to focus on the 64 million consumers over age 55. With a substantial majority of women, very few minorities, and the bulk of the nation’s disposable income, this segment is growing at three times the rate of the general population. And what a different audience it is. Those aged 50–64 are the least likely to eat their evening meal at a restaurant or use take-out or home-delivered foods (FMI, 2004a). In fact, they are more likely to cook from scratch with their free time (IRI, 2005). They are among the least interested in trying truly new foods, eating gourmet regularly, foods with a lot of spices, low prices, ethnic foods, and fresh deli/take-out (Packaged Facts, 2005, 2004a; FMI, 2004a).
Conversely, they have an increased likelihood of having a chronic health condition or being on a specialized diet. They spend significantly higher on beer, wine, and spirits and on pet food, especially for cats (IRI, 2005). They are the highest users of health and nutrition information, are curious about food ingredients, and demand high-quality fresh fruits, vegetables, and meats. The U.S. Dept. of Agriculture projects that this age group will drive increased consumption of fruits, vegetables, fish, eggs, and pork and reduced intake of fried potato, cheese, and sugar (Blisard, 2004). While convenience is important, products designed for hectic families won’t fit the bill.
ConAgra’s Golden Cuisine frozen meals are a bold new entry targeting seniors or their caregivers who have a limited ability to acquire meals by traditional means. Consumers can order the meals through a Web site—www.goldencuisine.com.
--- PAGE BREAK ---
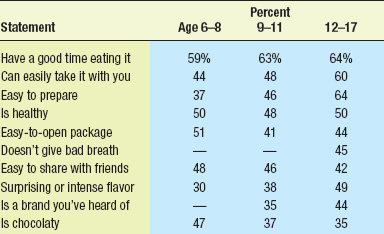 • Kids’ Foods Grow Up. While having a good time eating it still tops the list of reasons kids decide to ask for or eat a specific food (Yankelovich, 2003), health has become a key factor for about half of 6- to 17-year-olds (Table 2). One-quarter of kids say that extra added vitamins/nutrients affect their food decisions, while interest in calories becomes important in the pre-teen years; 10% of those aged 12–17 want organic foods.
Young kids also want foods that are easy to share with their friends. Nine out of 10 high school students told Aramark (2004a) that the most important thing about lunch was spending time with friends. Another contemporary criterion is having a surprising or intense flavor. With grab-and-go meals a must, convenience and portability are also becoming important at a younger age. And with kids’ having greater input into decisions at home and customizing everything from their music to sneakers, simply offering more choices—such as Denny’s Restaurant offering red grapes, applesauce, and Goldfish crackers as side options for kids—should have high appeal.
Massive foodservice menu overhauls aimed at youngsters but driven by grownup food trends—bolder flavors, more ethnic offerings, additional courses, wider choices, and a growing eye for health—are long overdue. While Technomic (2004b) reports that chicken strips/nuggets, burgers, and grilled cheese topped the list of the most menued restaurant items for kids, NPD (2004a) reports that vegetables and seafood were among the most ordered items for kids but rarely appear on kids’ menus today.
Carbonated soft drinks are the food most frequently ordered by kids in restaurants, followed by French fries, burgers, pizza, chicken nuggets, Mexican, vegetables, iced tea, seafood, and ice cream. With half of diners in family restaurants looking for “something familiar,” such frequent family-dinner-at-home favorites as steak/beef, fish, pork, turkey, “beyond-tacos” Mexican foods, soup, and Chinese fare will be important kids’ menu additions. Cheese, cereal, vegetables, fruit, salty snacks, crackers, pasta, sweets, and peanut butter top the list of foods pre-teen kids eat on a weekly basis (MSI, 2003a).
• New Twists for Teens. Aramark (2004a) reports that while pizza and chicken still topped high school students’ list of favorite foods, Italian, Mexican, and Chinese dishes rated higher than hamburgers. And 46% named soft drinks their No. 1 beverage choice, while one-third cited “still” beverages—water, iced tea, juice, Gatorade, and milk, in that order. Sports drinks (41%) topped the list of drinks students would buy if available, followed by bottled water (33%), fruit juice (31%), iced tea (23%), hot coffee/tea (22%), and milk (19%). When students go offsite for lunch, fast-food burger chains (47%), sandwich shops (30%), non-burger chains like Taco Bell, KFC, or Pizza Hut (29%), and convenience stores (17%) get the business.
Two-thirds of high school students say they make an effort to eat or drink something healthy every day, and 50% are at least a little concerned about health (Aramark, 2004a). Fresh fruits and vegetables topped the list of healthy foods they’d like to see more of in the cafeteria.
And savvy industry leaders are making changes, too. Mc-Donald’s found success with Apple Dippers, 100% pure apple juice and 1% Milk Jugs. Wendy’s sold 1 million units of milk and 425,000 fruit cups/week (12/6/04), and its Kids’ Meal option includes Mandarin oranges instead of French fries. Burger King offers Mott’s Strawberry Flavored Applesauce, Subway a Fruit Roll-Up, and Ruby Tuesday a kid’s salad bar. Red Lobster is one of the few chains addressing kids’ adult tastes. Its Kid’s Connection Menu gives young diners a free appetizer of applesauce or a platter of fresh veggies and dip. And the new entrees include Snow Crab Legs, Grilled Mahi-Mahi, and Grilled Chicken for kids. Food Beat (2004) reports that for the first half of 2004, only 1% of kids’ menu items carried a nutritional reference.
--- PAGE BREAK ---
Young Adults Spur Mega-Markets
Understanding the 40 million young adults age 18–24 is critical for food marketers—not only because they will set the trends for the 72-million “Echo Boom” generation, but also because research has shown that the behaviors they exhibit now will likely stay with them for the rest of their lives.
• Energy and Sports Nutrition. Although U.S. energy drink sales are just under $1 billion, with only 11% of adults as users, they are still a niche market (Mintel, 2004b). But energy foods and beverages—and their serious sports nutrition counterparts—will get a mainstream boost from the 40 million young adults as they move into the age bracket that historically has had the highest use of sports nutrition products, according to NMI (2004a). The No. 1 reason teens made a dietary change, went on a nutrition regimen, or added a food/beverage to their diet was to increase performance (63%), compared to 50% for weight management/control (MSI, 2003b). More than half of teens (58%) rank extra energy foods as a key buying influencer.
And the potential is larger still. NMI (2004a) reports that 70% of U.S. households are trying to prevent or treat a lack of energy. Energy beverages were the fastest-growing supermarket item in 2003, jumping 56% in mass-market sales (IRI, 2004a). According to NPD (2004b), teens now consume six times more nutrition bars than 5 years ago. NBJ (2004) estimates the U.S. sports/energy beverage market at $4.7 billion and nutrition bar sales at $2.4 billion.
Less-extreme beverages, beverages for women, longer-lasting, low-sugar, low-carb, and ethnic drinks are helping to broaden appeal. Fuze Beverage LLC’s Fuze Slenderize line boosts energy and helps lose weight. Anheuser-Busch’s Budweiser’s B-to-the-E, is the first U.S. energy beer infused with caffeine, guarana, and ginseng.
• Earthy Product Values. Food purity and social/earth-friendly values are other niche markets gaining momentum. Environmentally active and socially conscious young adults—coupled with increased targeting of “Lifestyles of Health and Sustainability” (LOHAS) consumers—will help drive natural and organic foods, sustainable agricultural practices/products, and socially responsible food business platforms mainstream.
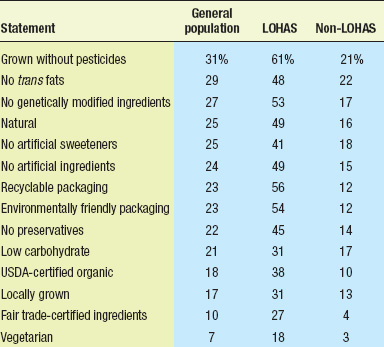 The 55 million LOHAS consumers demand products that have a meaningful sense of environmental and social responsibility and incorporate those values into their purchase decisions. They are more than twice as likely to pay 20% more for LOHAS-related products and 14% less likely to choose the lowest-priced item. Table 3 compares several attitudes of the LOHAS consumer to those of the general public (NMI, 2004b).
Although organic sales grew 20% to $10.3 billion in 2003, only 52% of shoppers purchased organic foods within the past 6 months, unchanged for the past 3 years (FMI, 2004b). When organic shoppers are indexed against all shoppers, Gen X/Y indexes the highest for organic food purchases (FMI, 2004b). Young adults are also more likely to shop at organic food stores (FMI, 2004a).
In Aramark’s (2004b) survey of more than 100,000 college students, 24% said that finding vegan meals on campus was important to them, compared to 19% for low-carb. Vegan dishes contain no meat, fish, poultry, or other products derived from animals. Among the general population, 25% said they plan to eat more vegetarian, 22% more raw, and 22% more organic foods in 2005. One-quarter (24%) said they now eat vegetarian on a regular basis (Lempert, 2004a).
--- PAGE BREAK ---
At the same time, the trend to locally grown, free-range, kosher, and “living” foods—the latter fruits and vegetables with roots or stems still on—remains strong. Organic Valley Family of Farms launched a line of regional milks called Rocky Mountain Pastures, made exclusively by farmers on the Colorado Front Range, bottled locally in Colorado Springs, and distributed nationally. Ecofish is the first nationally distributed organic shrimp raised with sustainable practices by Florida-based Ocean Boy Farms. Ancient and earthy grains such as amaranth and quinoa remain in vogue and have become an integral part of many new products, including Nestlé’s Lean Cuisine’s Spa Cuisine Classics Line.
• Chilled Will Be Top Choice. Freshness (74%) is the most important food selection criteria for these young adults and for the general population, too (Buzzback, 2004). Not surprisingly, consumers are selecting more refrigerated options. Of the “Top 10 Multi-Channel Food Growth Categories” (IRI, 2004a), natural cheese ranked 1st overall (up 11.7%), fresh eggs 3rd (28.9%), yogurt 5th (18.2%), refrigerated salad/coleslaw 7th (13.7%), luncheon meats 8th (7.9%), and refrigerated meat/poultry products 9th (30.9%). Refrigerated side dishes—such as Unilever’s Country Crock portionable line, which includes tubs of mashed potatoes and macaroni and cheese, and Zatarain’s ready-to-serve rice mixes such as Jambalaya Rice—are right on target.
And fresh-focused restaurants and offerings—such as Rubio’s HealthMex Chicken Burrito—will benefit, too. Mongolian barbecue chains like HuHots, where diners select from fresh ingredients, and Cold Stone Creamery, where ice cream is customized with “add-ins” and sold in fresh-baked cones—are among the fastest-growing restaurant concepts (Sloane, 2004).
But with fewer trips to the grocery store and a growing attitude that perishability assn’t practical for some, the pressure will be on food manufacturers to extend the shelf life of fresh foods even longer with sophisticated controlled-atmosphere packaging, sos vide processing, and other fresh-directed technologies.
Three-quarters of shoppers said they would buy more fresh fruits and vegetables if they would keep fresher longer; 47% said that one-quarter of their fresh foods go bad (Limper, ba). Farmland Foods has been able to extend the shelf life of its fresh case-ready pork in the meat case for 30 days with no special handling.
Consumers are also increasingly more willing to accept technologies that keep their foods fresh and safe. FM (2004a) found that 48% are very or somewhat likely to buy irradiated poultry, pork, or strawberries.
• Home-Meal Replacements. With 71% of young adults saying that easy and fast to prepare is a major factor in deciding what to eat—and with ready-to-eat and heat-and-eat the most desirable new food product parameters on everyone’s list—home-meal replacements (HMRs) appear poised for explosive growth. Three in ten adults said they plan to eat more freshly prepared foods that just need to be heated in 2005; 25% plan to cook more meals at home using prepared ingredients (Lempert, 2004a). While young adults’ cooking skills—and interest in learning to cook—are limited, their budgets are, too, and food marketers will have to find more-affordable, fresh products to capture the virtually untapped younger HMR market.
But it’s not just the cost alone. One-third of those aged 15–24 eat their evening meal at a restaurant three or more times/week—almost double the frequency of any other population segment—and in-home products must be able to compete (FMI, 2004a). While Boomer consumers prefer their life-long favorites (e.g., the roasted turkey or beef tip ready-to-eat entrees currently available), younger adults like to try new foods and want to eat gourmet whenever they can. They like their food presented in a casual manner and don’t really like spicier foods, although they like bold flavors. Products with a casual-culinary edge, such as Smithfield’s Flavoré heat-and-serve refrigerated entrees—which include Island Grill Chicken in Caribbean-style Sauce with Rice or Italian-Style Meat Loaf with Asiago Cheese in Marinara Sauce—are likely to have high appeal. Complete dinners rather than entrees will likely have longer-term appeal.
--- PAGE BREAK ---
• Ethnic Grab-’n-Go. With grab-and-go important to nearly two-thirds (61%) of young adults and one-third of young adults a minority—the opportunity for unique ethnic on-the-go foods will move center stage. More than 70% of consumers age 18–24 are frequent ethnic food purchasers and prefer, in descending order, Chinese, Mexican, Japanese, Italian, and American, although sushi and crossover Caribbean, Indian, Latin/Spanish, and Middle Eastern are starting to grow (Packaged Facts, 2004a; 2003). Young adults are also twice as likely as others to shop at special ethnic food stores (FMI, 2004a).
With time-saving food behaviors, including drive-thru and take-out/take-home foods, curb-side pickup, and home delivery at an all-time high—and 55% of lunches, 40% of breakfasts, 38% of mid-afternoon snacks, and 37% of dinners including a “grab-and-go” item—the potential for the ethnic “take-away” market is enormous (Yankelovich, 2005; NPD, 2004c). Hispanic foods—including mainstream Mexican, authentic Hispanic, and Nuevo Latino—will lead the way, projected to jump from $4.4 billion to $7.0 billion by 2009 (Packaged Facts, 2004b). Sales of Hispanic convenience foods such as entrees and handheld items grew 103% to $505 million during the past five years. Dinner kits, single-serve beverages, frozen foods, and Latin street foods such as papusas and empanadas are the fastest-growing segments. Publix Super Markets will launch store-brand Hispanic foods later this year.
• Casual Entertaining. “Hiving” is a strong mega-trend that will not only drive the HMR market mainstream but also keep food products and rituals that foster a sense of “connection” centered on the home. Put more simply, the home has become a “hive,” where friends and family—and especially young people—get together and enjoy various activities in a “safe setting abuzz with activity and excitement.”
And a new casual entertaining trend appears to be part of the charm. Yankelovich (2005) reports that 80% of consumers now feel a growing need to share and observe important occasions with others, and 54% think that having a party is worth the effort—up 4% in just one year. Today, 58% of consumers regularly have family get-togethers, 52% cookouts, and 39% holiday parties, and 16% invite friends over for cocktails.
Whether these consumers are tailgating or movie watching, convenient culinary-driven products for casual in-home or away-from-home get-togethers are in short supply. Baja Fresh’s Burrito Party Pack feeds 6–8 hungry guests and comes complete with everything from serving utensils and plates to salsa and chips. Smart sit-down restaurateurs are creating their own “hives” by promoting sharing and sampling platters and encouraging social interaction, especially among younger diners (Sloan, 2004a).
The author, a Professional Member of IFT, is President, Sloan Trends & Solutions, Inc., P.O. Box 461149, Escondido, CA 92046. E-mail: [email protected].
References
AHA. 2005. Heart disease and stroke statistics. American Heart Assn., Dallas, Texas. www.americanheart.org.
Aramark. 2004a. High school cafeteria research results & recommendations. August. Aramark Corp., Philadelphia.
Aramark. 2004b. One out of every four college students wants vegan meals, according to Aramark nationwide survey. Press release, Oct. 19.
BCG. 2004. Trading up: Trends, brands and practices—2004 research update. May 2004. Boston Consulting Group, Cambridge, Mass. www.bcg.com.
Blisard, N. 2004 America’s changing appetite: Food consumption and spending to 2020. Rural Economics Div., Econ. Res. Service, U.S. Dept. of Agri., Beltsville, Md. [email protected].
Buzzback. 2004. Understanding teen attitudes. July. Buzzback Research, New York. www.buzzback.com.
Datamonitor. 2004. Opportunities for offering premium food and drink on the forecourt. Feb. Datamonitor, New York. www.datamonitor.com.
FMI. 2004a. Trends 2004 in the United States: Consumer attitudes and the supermarket. Food Mktg. Inst., Washington, D.C. www.fmi.org.
FMI. 2004b. Shopping for health 2004: Making sense of nutrition news and health claims. Food Mktg. Inst., Washington, D.C. and Prevention Magazine, Emmaus, Pa. www.fmi.org.
Food Beat. 2004. Highlighting nutrition. Food Beat, Inc. newsletter, 3rd Qtr., p. 1. Wheaton, Ill. www.foodbeat.com.
HealthFocus. 2005. HealthFocus market views. HealthFocus International, Inc., Tampa, Fla. www.healthfocus.com.
Innova. 2004. Lao Tsu to launch energy teas: Energy drinks by gender. Food and Beverage Innovation Newsletter No. 7, Nov., p. 5. Innova, Duiven, The Netherlands. www.innova-food.com.
IRI. 2004a. Shoppers shifting gears: Consumers making better-for-me CPG shifts. Times & Trends, Dec., p. 8. Information Resources, Inc., Chicago. www.infores.com.
IRI. 2004b. Food-to-go shoppers—Searching for healthier portable meals & snacks. Times & Trends, April 2004.
IRI. 2005. Aging baby boomers. Times & Trends, Jan.
Lempert, P. 2004a. 2005 food trends . . . Better nutrition and better flavor. Facts, Figures & Future Newsletter, Dec., p. 5. Food Mktg. Inst., Washington, D.C. www.fmi.org.
Lempert, P. 2004b. Waste not…want not. Facts, Figures & Future Newsletter, Aug., p. 7.
Maras, E. 2004a. 2003: Industry loses another 5 points as employers curtail manpower needs. Automatic Merchandiser, Aug. 2004, p. 44-54, 56, 58-59.
Maras, E. 2004b. Schools want more nutritional vend products: how are we doing? Vend Trends On-Line. March 12. www.amonline.com.
Mintel. 2004a. Mintel snacking study. Mintel International Group, Chicago. www.mintel.com.
Mintel. 2004b. Specialty foods: State of the industry report. Mintel International Group in conjunction with Natl. Assn. of Specialty Food Retailers and SPINS, San Francisco.
Mintel. 2004c. Energy beverages.
MPEP. 2004a. FMSTI school test fact sheet. Milk Processor Education Program, Washington, D.C. www.milkdelivers.org.
MPEP. 2004b. FMSTI multi-channel vending test fact sheet.
MSI. 2003a. Gallup study of pre-teen children’s nutrition and eating habits. Multi-Sponsor Surveys, Inc., Princeton, N.J. www.multisponsor.com.
MSI. 2003b. The Gallup report on teens’ food and beverage consumption.
NBJ. 2004. NBJ Newport summit 2004 market overview snapshot. Presented by Grant Ferrier at Nutrition Business Summit, Coronado Island, Calif. July. www.nutritionbusiness.com.
NMI. 2004a. The health & wellness trends database. Natural Mktg. Inst. Harleysville, Pa. www.nmisolutions.com.
NMI. 2004b. The LOHAS consumer data base.
NNB. 2004. Wellness foods at the push of a button? New Nutr. Bus. 9(10): 9. www.new-nutrition.com.
NPD. 2004a. Personal communication from C. Hilsenrath, Dec. 14. NPD Group, Port Washington, N.Y. www.npdfoodworld.com.
NPD. 2004b. The NPD Group reports kids are choosing healthier snacks. Press release for “Snacking in America Study,” Jan. 28.
NPD. 2004c. 19th annual eating trends in America survey.
Packaged Facts. 2003. The U.S. market for emerging ethnic foods. June. Packaged Facts, a Div. of MarketResearch.com, New York. www.packagedfacts.com
Packaged Facts. 2004a. Flavor/ingredients outlook 2004. Jan.
Packaged Facts. 2004b. The U.S. market for Hispanic foods & beverages, Nov.
Packaged Facts. 2005. The U.S. market for 55+ consumers.
Sloan, A.E. 2004. Taking off and piling on: Restaurants take new approaches. Food Technol. 58(10): 20-27.
Sodexho. 2003. School meals study. Sodexho USA, Gaithersburg, Md. www.sedexhousa.com.
Technomic. 2004a. The top 50 growth chains. Personal Communication, Chris Urban. Technomic Services, Inc., Chicago. www.technomic.com.
Technomic. 2004b. Understanding kids’ menu 2004.
WFC, 2002. Gallup survey: Grains of truth about fad diets & obesity. Wheat Foods Council, Parker, Colo. www.wheatfoods.com.
Yankelovich. 2003. Youth monitor. Yankelovich, New York. www.yankelovich.com.
Yankelovich. 2005. Understanding transitions to create opportunities in the age of personal authenticity. Yankelovich Monitor, Dec. 9.