
Cruising the Center-Store Aisles
Lower-calorie treats, gourmet sauces and spreads, and healthier convenience foods have re-centered attention on the inner aisles of the store.
Over the past few years, food marketers and retailers have been concerned that an almost overwhelming assortment of packaged foods and an increasing demand for fresh have caused consumers to cut back on shopping the less-glamorous center-store aisles. But the growing practice of self-enhancing the flavor of foods with sauces, syrups, and spreads, a penchant for gourmet, specialty, and organic items, and unprecedented growth in home entertaining have sent shoppers scurrying down the dry-grocery aisles in search of new flavors, ingredients, and true product innovations.
 And with 82% of dinner entrees and main courses still prepared at home during the week—67% on weekends—and 56% of them still "made from scratch," 22% from pre-packaged foods that need preparation, and only 8% from frozen or heat-and-serve packaged foods (MSI, 2004), the products found in the dry-grocery section of stores will fill an even greater part of nearly everyone’s shopping list.
In the majority of stores, the grocery department—also referred to as the center of the store—is made up of the dry-grocery, dairy, and frozen sections. On a dollar basis, it is the largest contributor to the bottom line, generating 30% of store sales and 42% of "total store true profit" (WBC, 2005). It generates five times as much "true profit" as the "perimeter" departments—deli, produce, meat, seafood, and bakery. Dairy is the second-most-profitable department on a "total true profit" basis, while deli—both serviced and packaged—leads perimeter sales, followed by produce and the fresh-meat department.
Center-store food sales hit $124 billion in mass food, drug, and mass merchandiser markets (FDMx), excluding Wal-Mart, for the year ending July 2005 (ACNielsen, 2005a).
While dry grocery items will remain a shopping staple, they may not be as likely to be purchased in a supermarket. Nine out of ten (90%) shoppers for the household now visit at least five retail outlets to stock up on weekly groceries (Coca-Cola, 2005). Shoppers average 2.2 supermarket visits per week and frequent a variety of other stores for groceries, including dollar stores and natural supermarkets (FMI, 2005). Sales in the traditional grocery channel are projected to fall from 52% to 46% by 2009, while dollar share in supercenters will rise from 12.9% to 18% (WBC, 2005).
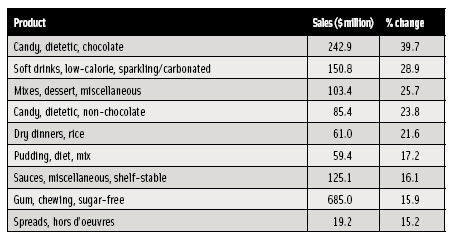 Dietetic candy, low-calorie soft drinks, dry dessert and rice mixes, and sauces/spreads were the fastest-growing dry grocery categories in the grocery channel in 2004 (ACNielsen, 2005b; Table 1). In 2003, shelf-stable meal starters, dessert mixes, and diet candy/soft drinks topped the list.
Last year’s most successful new products delivered against consumers’ desire to experience new tastes and varieties, manage weight, improve overall health, and offer value-added convenience, according to IRI (2005a). Breyer’s CarbSmart ice cream/novelties, Pepsi Vanilla, Diet Coke with Lime, Sprite Remix, and Yoplait’s Nouriche led IRI’s "Pacesetter" list, each earning more than $100 million in year-one FDMx sales. The snack bars/granola bar category sported the highest number of new "pacesetter" blockbuster products in 2004 with 18 products, cold cereal 15, cookies 12, and carbonated beverages 10. On average, Pacesetter products touted 3.5 product benefits.
The following discussion is intended to identify mega trends and opportunities in many of the traditional center-of-the-store categories. While the definition of "center store" segments often differs by source beyond dry grocery, this report will not include frozen foods or the perishable dairy case.
--- PAGE BREAK ---
 Downing Diet Drinks
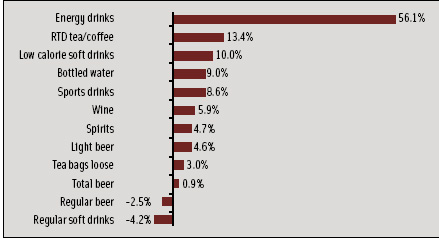
With 69% of Boomers and 56% of Gen Yers trying to manage their weight, it’s not surprising that calorie concerns have reoriented nearly every segment of the beverage business (FMI, 2004). NMI (2005a) reports that in post–low-carb 2005, 70% of consumers who check the label are looking for calories and 57% for sugar content. Even the $1.8-billion energy category, which led sales again last year (Figure 1; IRI, 2005a) is moving toward lower-calorie, sugar-free options such as Coca-Cola’s new Sugar Free Full Throttle.
Even the inherently healthy juice category saw sales volume fall 1.7% in 2004, as concern over calories and sugar drove sales from 100% juice to drinks (IRI, 2005b). Cadbury Schweppes now offers Mott’s Plus for Kids’ Health, a fortified 100%-juice product, and Mott’s Plus Light, a lower-calorie version designed for weight-conscious older family members. Ocean Spray® Light Juice Drinks with fewer calories and no artificial preservatives, colors, or flavors are enjoying brisk sales. With the kids’ market softening as a result of dramatic demographic changes over the next 7–10 years, juice-box sales will also likely suffer (Sloan, 2005).
But it’s not just weight. NMI (2005a) reports that of the 48% who purchased a regular soda in the past three months, 69% also bought a natural soda and 38% a functional soda; behavior was similar for diet soda users. Mintel (2005b) projects that functional beverage sales will grow from $10 billion in 2004 to $12.8 billion in 2009. Beverage Marketing Corp. projects that per-capita bottled water consumption will jump from 24 to 35 gallons by 2009 (BMC, 2005) and flavored waters will add $800 million to the bottom line.
For the first time in six years, daily coffee drinkers rose to 53% of consumers and hit an all-time high—26%—of those age 18–24; gourmet coffee stalled at 15% of coffee drinkers (NCA, 2005). Premium and exotic teas are also "hot"—projected to grow from $6.8 to $10 billion by 2010 (Packaged Facts, 2005c). And with Empty Nesters sending the sales of spirits and wine soaring to a level not seen in generations—and more than 4 million young adults turning age 21 yearly for the next 10 years—alcoholic-beverage aisles will enjoy unprecedented attention.
Weight-Wasting Cereals
With four out of ten moms saying that sugar is the ingredient they are most trying to avoid—and just under half of women reporting that it’s their most important factor in buying a cereal—beverages aren’t the only category shying away from sugar and further embracing health (HealthFocus, 2005). Dollar sales of RTE cereals with "less sugar" jumped 62% to $138 million for the year ending 4/16/05, a sharp contrast to the 1.6% decline for the RTE category overall (Lempert, 2005a). Kellogg’s’ Frosted Flakes now have one-third less sugar, while General Mills reduced sugar by 75% in Cocoa Puffs and other cereals by adding Splenda.
Kashi introduced Mighty Bites whole-grain cereal containing choline, iron, zinc, and vitamin C and formulated with fiber, calcium, and protein to support a growing body and mind. With more moms looking to substitute organic staples for their children whenever affordable, Annie’s Homegrown’s organic Honey Bunny Grahams and Nature’s Path’s EnviroKidz gluten-free Amazon Frosted Flakes provide a more-natural option.
Among the 83% of adults who buy cereals, 27% say whole grains are the most important nutritional factor when buying a cereal for themselves, 18% dietary fiber, and 13% sugar (Mintel, 2005c). Very high-fiber cereals, such as General Mills’ Fiber One Honey Clusters, with 14 g of fiber (more than 50% of the daily value) per serving, are another fast-emerging segment. A horsepower race is also developing over the number of whole grains included in a serving; an example is Kashi’s Seven Whole Grain Foods cereal. In addition, there is a new exciting focus on ancient grains, as exemplified by Nature’s Path’s Organic Heritage flakes—with kamut, spelt, millet, barley, and quinoa.
--- PAGE BREAK ---
Other marketers are luring customers with the natural goodness of fruit (e.g., Kellogg’s Fruit Harvest™ Strawberry Blueberry), new trendy flavors, and heart-health appeal (e.g., Kashi’s Heart to Heart and Kellogg’s Smart Start with Antioxidants), or by simply offering sound basic nutrition (e.g., General Mills’ Whole Grain Basic 4). Nevertheless, it’s the latest move into weight control that will likely take the cereal category—both hot and cold—by storm.
While Kellogg’s Special K and Kashi’s GoLean have long touted weight-management platforms, new products directed solely at weight control such as Cascadian Farms’ organic Great Measure™, designed to give those watching their weight the nutrients they desire, will bring a powerful new focus to the category. Quaker Oats launched Weight Control Instant Oatmeal, specially designed with 25% more whole grains, fiber, and protein to help people feel full.
Quaker’s recent introductions—which also include emphasis on the potential benefits of oatmeal on management of blood pressure as well as of cholesterol—pushed up sales in the hot cereal category by 7.1% during 2005 (Mintel, 2005c). Hot cereals account for 11.4% of cereal category sales. Kellogg’s’ K-Life and Healthy Beginnings program help visitors to the company’s Web site choose products for weight and other lifestyle concerns.
Factors such as a smaller pool of kids over the next 7–10 years, 24% of adults skipping breakfast on all or some days, higher price points, and unprecedented competition from grab-and-go early-morning alternatives such as yogurt drinks, breakfast bars, and frozen sandwiches have made the mature $8.9-billion breakfast-cereal category one of the toughest marketing assignments in the center store. But some cutting-edge health positionings, including weight control and performance appeal, might just get this mature category back on the table yet.
With increased performance on the minds of 72 million Gen Yers, Nature’s Path’s Optimum ReBound™ cereal, designed to refuel the body after a workout, and Back-to-Nature’s Hi-Protein Granola will have high appeal for young adults and weekday warriors, too.
Flavor Creators
With few cooking skills and little interest in acquiring them, and an increase in home entertaining, consumers are turning to ready-made cooking sauces, marinades, and more-creative condiments and toppers to make every day a little more gourmet. With Subway popularizing the diversity of sandwich spreads and with barbecuing, both indoors and out, at an all-time high, it’s not surprising that shelf-stable sauces and spreads were among the fastest-growing categories in the center store in 2004. Mintel (2005d) reports that two-thirds of those between the ages of 18 and 34 use cooking sauces and marinades, implying strong future potential for use.
In 2004, barbecued foods topped the list of meal preparations using a cooking sauce or marinade (83%), followed by Mexican dishes/tacos (70%), Italian dishes/pasta salad (68%), stir-fry/Asian dishes (67%), casseroles (33%), and Indian dishes/curry (19%) (Mintel, 2005d). Look for more Asian/Japanese sauces, regional BBQ sauces, bolder Hispanic-driven flavored marinades, and seafood accompaniments such as Ashan Manufacturing Co.’s Honey Ginger Sauce for Salmon.
While pasta sauces took a hit from their high-carb pasta partners over the past few years, sales of organic and all-natural pasta sauces have jumped 71% since 1999, albeit from a small base (Mintel, 2005d). Sacla Italia’s spoon-and-serve pasta sauces in Sun Dried Tomato & Garlic, Classic Basil Pesto, Olive & Tomato, and other flavors are a new and more-contemporary approach to adding an Italian twist to pasta.
Among the top sellers in the specialty channels are such products as cheese toppers with fruit or nuts, fruit and nut butters, specialty spreads such as aioli and olive tapenade, bruschetta, and organically produced chutneys, spreads, and salsas (Mintel, 2005d). Dipping sauces, such as Private Harvest’s Ginger Balsamic Bread Dipper, and finishing sauces, such as Earth & Vine’s Apricot Dijon Tarragon and Chili Ponzu sauces, are another explosive category.
--- PAGE BREAK ---
Consumers are finding that pepper jellies and hot and sweet spreads like Rothschild Farms’ Hot Pepper Peach and Fruit Spread or the Republic of Tea’s Tropical Tart and Sweet Pink Grapefruit Tea Marmalade can zip of the flavor of nearly any sandwich, meat, or cheese preparation, especially hors d’ouvres. Stonewall Kitchen’s No Sugar Added Wild Maine Blueberry Spread and Red Raspberry Spread mirror the trend to reduced-sugar spreads and regionally sourced ingredients.
At the same time, more taste-sophisticated consumers, health concerns, and growing ethnic interests are converging to grow the specialty condiment category—up 26% since 2002, compared to 8% for traditional condiments (Mintel, 2005a). All-American condiments are taking on worldly flavors in an attempt to appeal to those gourmet-everyday consumers under age 35. World’s Best Ketchup comes in Basil, Dill and other varieties, while Terrapin Ridge offers Balsamic & Herb and Smokey Onion Mustards. With $2 billion spent across all retail channels in 2004 on the pickles, olives, and relish categories—and with 63% of United States households buying peanut butter, 53% dill pickles, 48% barbecue sauce, 37% radishes, 37% black olives, and 24% canned/jarred peppers—these all-American accompaniments could use an update, too (Lempert, 2005b).
While Ranch remains the most popular salad dressing flavor, followed by Blue Cheese, Italian, French, Thousand Island, Caesar, Honey Dijon, Poppyseed, and Balsamic Vinaigrette, watch for mainstream America to fully discover the flavor of enhancing everything from salads to finished meat with specialty vinegars and oils. Pastorelli’s Gourmet Vinegar Collection includes cider vinegar from choice Michigan apples and red wine vinegar from New York State’s Concord grapes.
And HealthFocus (2005) reports that health-active shoppers are frequent users of salad dressing and mayonnaise. Hellmann’s better-for-you Real Canola Mayonnaise will help set a much healthier pace. The shift toward healthier oils drove worldwide oil sales up 7% in 2004 (ACNielsen, 2005c). Olive oil tops the list of oils that consumers perceive to be healthiest, mentioned by 91% of consumers compared to 87% for soybean, sunflower 82%, canola 82%, safflower 79%, and corn 67% (USB, 2004).
Balanced Snacking
With consumers traditionally spending one-third of their food budgets on foods and beverages for pure enjoyment and 81% eating desserts or indulgent snacks on most days, it was only a matter of time before they began to balance indulgence and healthy eating when it comes to snacking and splurging on treats.
Not surprisingly, diet chocolate and non-chocolate diet candies were among the fastest-growing dry grocery items again this year. ACNielsen (2005a) reports that for the first time in several years, salty snack sales rose 1.7% in FDMx (excluding Wal-Mart) for the year ending 5/15/05, ice cream 1.6%, chocolate candy 0.7%, and crackers 0.9%. Light ice cream sales rose 7.6%, light salty snacks 4.7%, and light chocolate candy 2.0% (IRI, 2005c).
Smaller portions are gaining in importance across all indulgence categories, according to Technomic Inc. (2005). Nearly two-thirds (61%) of consumers want to cut down the amount of food they eat, and 69% think it is healthier to eat mini-meals. Kraft Foods’ Nabisco 100 Calorie packs and Procter & Gamble’s Pringles 100 Calorie Packs exemplify one of the strongest trends in the snack category. Products like Pepperidge Farm’s Whims™ Crispy Waves will also help to reinvigorate the cookie category. Whims Crispy Waves and Whims Crunchy Clusters are bite-sized sweet snacks sold in a canister that fits into a cup holder. Snacks nuts, seeds, and corn nuts are one of the fastest-growing snack categories, up 15.5% in FDMx sales (excluding Wal-Mart) in 2004.
--- PAGE BREAK ---
Mintel (2005g) expects that the 18% growth experienced by the salty snack market through 2008 will be fueled primarily by growth in the potato chips, tortilla chip, snack nuts, and corn snacks segments, all projected to increase by more than 20% through 2008. The cookie market, however, is expected to decline by 4% through 2009, with gains in premium cookies up 29%, health-oriented cookies up 5%, and cookie bars up 85%, albeit a smaller category (Mintel, 2005h).
Mintel (2005f) estimates nutrition and energy bar growth at 21% for the two-year period 2005–06. The diet segment, driven by the success of low-carb products, increased 55.3% and overtook the energy/wellness segment as the largest in the category. Energy/wellness bars grew by 6%, as products like Luna, Balance Gold, Clif, and PowerBar remained best sellers. Sales in the athletic segment slowed. Only 21 % of consumers are regular energy bar users.
Easy-Does-It Meals
If there’s one thing that will get today’s busy consumers down the food aisles, it’s a complete hearty and healthy ready-to-make meal kit or a show-off side dish—and with 25% of consumers using prepackaged foods that need preparation to make their dinner entrée during the week and 22% on weekends, the potential for future growth is strong (MSI, 2004).
Last year, crock-pot dinner kits topped the list of the fastest-growing dry grocery items, and two years before it was complete meal kits.
While meal kits remain infinitely popular again this year, it is the organic and health-driven dry and shelf-stable meal kits, ethnic mixes, and premium upscale dry mixes that are grabbing the spotlight. Kraft Foods will get kudos from health-conscious moms with its new SuperMac™ & Cheese pasta and sauce, which is now a good source of whole grain and vitamins B-1, C, D, and E and an excellent source of calcium. Annie’s all-natural Bunny Pasta and Yummy Cheese and Arthur’s Macaroni & Cheese provide other health options.
Rice mixes—which most likely have gotten a boost from the current interest in whole grains—are this year’s favorite dinner dry mixes. Exotic rice dishes such as Lundberg Farms’ Moroccan Pilaf, Rice Expression’s Indian Basmati Rice, and Near East’s Sesame Ginger Rice will also get shoppers’ attention. Lundberg’s new Risotto with Nutra-farmed California arborio in Tomato Basil, Creamy Parmesan, and other versions will be right on target for more gourmet diners, as will Cugino’s dried soups and chili mixes, which include Baked Burgundy French Onion and Chicken Enchilada soups and EnCHILIada Chili Fixin’s mix, perfect for singles, couples, or students.
Soup’s Up!
Nothing serves up a hearty and satisfying meal quicker than soup. Not surprisingly, ready-to-serve soups are gaining on condensed and dry versions, despite the versatility of dry in single-serve form. The $4-billion shelf-stable soup category is one of the most mature and brand-loyal categories in the grocery aisle: 85% of consumers normally keep a supply of soup on hand, 73% buy the same brands, and 66% buy the same flavors. But despite recent success with portable and healthier options, the soup category—plagued by the growth of refrigerated, fresh, and private-label—is projected to post only modest gains through 2008 (Mintel, 2005e).
With taste the No. 1 driver of the soup category, it’s not surprising that soups are getting more adventuresome. Campbell’s Select line added a new Mexican-style Chicken Tortilla Soup, while Progresso features a Grilled Chicken Italiano with Vegetables & Penne. Campbell is introducing a super-premium soup line—Campbell’s Select Gold Label Soups—ready to serve and packaged in a tall aseptic carton. All varieties have 90–120 calories, and four of the five have 4 g of fiber per serving. Blended Red Pepper and Black Bean and Creamy Portobello Mushroom are among the new varieties.
--- PAGE BREAK ---
Health is also driving the category. Campbell’s Healthy Request condensed soups rose 17% last year; 42% of all consumers ate low-fat or low sodium soups (Mintel, 2005e). Progresso’s recent nutrition campaign, which flags the company’s soups that are 100 calories or less per serving or provide less than 3 g of fat per serving, will also help to remind consumers of the health aspects of soup. In the natural channel, ready-to-serve soups grew 15.7%, while organic soup sales also climbed, led by Amy’s Kitchen, Health Valley, and Pacific Foods soups. Pacific Foods’ all-natural Hearty Soups made with free-range chicken and antibiotic-free meats are sold in microwavable pouches.
Condensed and dry soups also continue their role as a key ingredient, as a sauce starter or base. Watch as other soup-like categories grow in importance, including chili. Bush’s Best Homestyle Chili in family-sized glass jars is sure to grab the attention of quality-conscious shoppers. Ethnic soups and Asian noodle bowls such as Annie Chun’s Chicken Noodle Soup in Fresh Pak™ Noodle Bowls and Thai kitchen’s single-serve Noodle Cart and Simply Asia™ instant noodle bowls represent another explosive segment, one of keen interest to Gen Y, whose favorite cuisine is now Chinese. Watch for other easy-delivery systems on-shelf, such as Campbell’s IQ Maximizer system for convenient condensed soup display and delivery. The gravity-fed dispensing system organizes the cans by soup variety and feeds the cans forward as the consumer removes one.
And, last, while organic soups, meals, and other products are fast grabbing customer attention, their household penetration has stalled and may even be declining, according to NMI (2005b). The percentage of households who say they use organic foods has dropped to 30%, although sales of organic foods are rising. Apparently, those consumers who are using organic foods are using more of them, while other new organic buyers are not coming on board (NMI, 2005b).
A Key Shopping Destination
With an insatiable appetite for more adventuresome flavors and more gourmet flair, healthier versions of their favorite foods, and even more convenient meal solutions, more shoppers will make the dry-grocery aisles a key shopping destination, whether in a superstore, dollar store, or traditional supermarket. And true product innovation, rather than line extensions, will be the key to cutting through the clutter of the invigorated center store!
Trading Up to Higher-Quality Ingredients
Across mainstream food product categories as diverse as salad dressing and side dish mixes, there is increasingly a two-tiered market. One segment is items purchased for everyday use. The other, higher-priced, segment is items purchased for special occasions to make a statement about a lifestyle commitment—such as fair trade business practices or organic farming—or simply for enjoyment, self reward, and adventuresome discovery (Mintel, 2005a).
According to BCG (2005), products with higher levels of quality, taste, emotional resonance, and aspiration posted average sales gains of 21% in 2004. BCG estimates that 122 million adults—excluding households with incomes greater than $150,000—have the means and desire to "trade-up" for foods important to them. High-quality ingredients are the most important factor in making a food or beverage "premium"—less than one in five consumers define "premium" by price, celebrity chefs, organic/natural, or high-end packaging (ICG, 2005).
--- PAGE BREAK ---
With 18% of Americans considered true gourmets, and the majority of Americans perceiving specialty foods as an affordable treat, premium food and beverage sales are exploding, projected by Packaged Facts (2005a) to jump from $41.2 billion in 2004 to $62 billion in sales by 2009, an increase of 9.7% per year. By 2009, specialty beverages are expected to reach $21.8 billion, baked goods/pasta/grains $10.5 billion, fresh produce $6.8 billion, ready-to-eat meals $5.6 billion, cheese $4.2 billion, candy $3.9 billion, condiments/sauces $3.7 billion, and ice cream/frozen desserts $1.6 billion. Half (49%) of specialty sales take place in supermarkets, 21% in gourmet stores, and 7% in warehouse/clubs.
Loving Private Label
Private-label and store brands are among the fastest-growing center-store categories, and in 2004 they became the third-most-powerful driver of food industry sales worldwide, right behind health and convenience (ACNielsen, 2005c). Private-label food and beverage sales are projected to grow from $46.5 billion in 2004 to $57.8 billion in 2009 (Packaged Facts, 2005b). While foods will drive growth, private-label beverage sales enjoyed a 6% jump last year as a result of increased gains for soda, milk, and water in supercenters.
Private-label apple juice is now the third-best-selling juice brand, while private-label soups are becoming a force to be reckoned with. Most retailers are relying on a three-tiered approach to private label: low-cost, added-value, and premium/gourmet.
With large households and lower-income shoppers still accounting for about half of all private-label food and beverage sales, household food staples remain the most frequently purchased items.
With 77% of adults believing that private-label products are a good alternative to brands, 81% an extremely good value for the money, and 72% as high quality as most big brands—and margins still on the order of 40% higher than national brands—it’s not surprising that retailers are upscaling their brands even further (ACNielsen, 2005d; Packaged Facts, 2005b).
Watch for more premium-priced private-label products—specialty, natural and organic, upscale convenience, and gourmet ethnic foods. Mixed vegetables, side dishes, frozen fruit salads, and packaged ethnic rice dishes are among the hottest growth opportunities (Packaged Facts, 2005b). Also, the private-label segment appears to be moving out front with vegan, vegetarian, no-gluten, and no-dairy tags (MIS, 2004).
by A. Elizabeth Sloan, a Professional Member of IFT, is President of Sloan Trends, Inc., 2958 Sunset Hills, Escondido, CA 92046 • [email protected]
References
ACNielsen. 2005a. The convenience store. In "Grocery Headquarters’ Center Store Handbook," July 2005, p.16. Grocery Headquarters, New York, N.Y. www.groceryheadquarters.com.
ACNielsen. 2005b. ACNielsen’s hot 10. Progressive Grocer, April, p. 11. www.progressivegrocer.com.
ACNielsen. 2005c. What’s hot around the globe—Insights on growth in food and beverages 2004. ACNielsen, Schaumburg, Ill. www.acnielsen.com.
ACNielsen. 2005d. The power of private label 2005 executive news report Sept. 2005.
BCG. 2005. "New luxury" companies continued to be standout performers of consumer economy in 2004. Press release, Feb. 9. Boston Consulting Group, Boston, Mass. www.bcg.com.
BMC. 2005. 2005 Multiple beverage marketplace in the U.S. June. Beverage Mktg. Corp., New York, N.Y. www.beveragemarketing.com.
Coca-Cola. 2005. Solutions for growth: How do shoppers pick where they shop. Coca-Cola Retailing Research Council, Atlanta, Ga.
FMI. 2004. Shopping for health. Food Mktg. Inst., Washington, D.C.
FMI. 2005. US grocery shopper trends, 2005, p.11. Food Mktg. Inst., Washington, D.C. www.fmi.org.
HealthFocus. 2005. HealthFocus 2005 trends report. HealthFocus Intl., Tampa, Fla. www.healthfocus.com.
ICG. 2005. Shoppertunities study. ICG Research, London, UK.
IRI. 2005a. 2004 New product pacesetters. Times & Trends, March, p.11. Information Resources, Inc., Chicago, Ill. www.infores.com.
IRI. 2005b. US CPG industry year in review. Times & Trends, Feb. p. 15. Information Resources, Inc., Chicago, Ill.
IRI. 2005c. The enjoyment factor. Times & Trends, July, pp. 9-10. Information Resources, Inc., Chicago, Ill.
Lempert, P. 2005a. Ready-to-eat cereals slim down. Facts, Figures & the Future, July, pp. 2-3. 2005. Food Mktg. Inst., Washington, D.C. www.fmi.org.
Lempert, P. 2005b. Channel watch. Facts, Figures & the Future, June, p.3-4. 2005. Food Mktg. Inst., Washington, D.C.
Mintel. 2005a. Specialty foods—The NAFST state of the industry report—The market—US—May 2005. Mintel Intl., Chicago, Ill. www.mintel.com.
Mintel. 2005b. Functional beverages—US—September 2004. Mintel Intl., Chicago, Ill.
Mintel. 2005c. Breakfast cereal—US—August 2005. Mintel Intl., Chicago, Ill.
Mintel. 2005d. Condiments—US—August 2005. Mintel Intl., Chicago, Ill.
Mintel. 2005e. Soup—US—May 2005. Mintel Intl., Chicago, Ill.
Mintel. 2005f. Nutrition and energy bar market—September 2005. Mintel Intl., Chicago, Ill.
Mintel. 2005g. Salty snacks—US—July 2005. Mintel Intl., Chicago Ill.
Mintel. 2005h. Cookies – US –April 2005. Mintel Intl., Chicago Ill.
MIS. 2004. Productscan data. Marketing Intelligence Service, Ltd., Naples, N.Y. www.productscan.com.
MSI. 2004. The 2004 Gallup dinner survey. Gallup/Multi-Sponsor Surveys, Inc. Princeton, N.J. www.multisponsor.com.
NCA. 2005. National coffee drinking trends 2005. National Coffee Association. New York, N.Y. www.ncausa.org.
NMI. 2005a. Health and wellness trends database. Natural Mktg. Inst., Harleysville, Pa. www.nmisolutions.com.
NMI. 2005b. The organic consumer trends report. Natural Mktg. Inst., Harleysville, Pa.
Packaged Facts. 2005a. The US market for gourmet & specialty foods and beverages. Sept. Packaged Facts, a Div. of marketresearch.com, New York, N.Y. www.packagedfacts.com.
Packaged Facts. 2005b. US market for private label foods and beverages, June. Packaged Facts, a Div. of marketresearch.com, New York, N.Y.
Packaged Facts. 2005c. The US market for tea and Ready-to-drink tea. Packaged Facts, a Div. of marketresearch.com, New York, N.Y.
Sloan, A.E. 2005. Demographic directions. Food Technol. 59(7): 34-36, 39-40, 43-45.
Technomic. 2005. Consumer update: What we want? A Technomic market research survey. June. Technomic Services, Inc., Chicago, Ill. www.technomic.com.
USB. 2004. Consumer attitudes about nutrition. United Soybean Board, Des Moines, Iowa. www.talksoy.com.
WBC. 2005. Willard Bishop Consulting store format report. Willard Bishop Consulting, Barrington, Ill. www.bishopconsulting.com.