A New Perspective on Premium
A changing definition of food quality reflects consumer demand for more exciting, transparent, and less processed foods.

More and more, consumers want their culinary experiences to be exciting. They are looking for products that have narratives that illustrate how the particular food or beverage product differs from mainstream, established brands. Consumers also continue to seek greater food transparency and demonstrate a passion for all things fresh, real, and sustainable. You might say that expectations like these are redefining specialty foods and beverages.
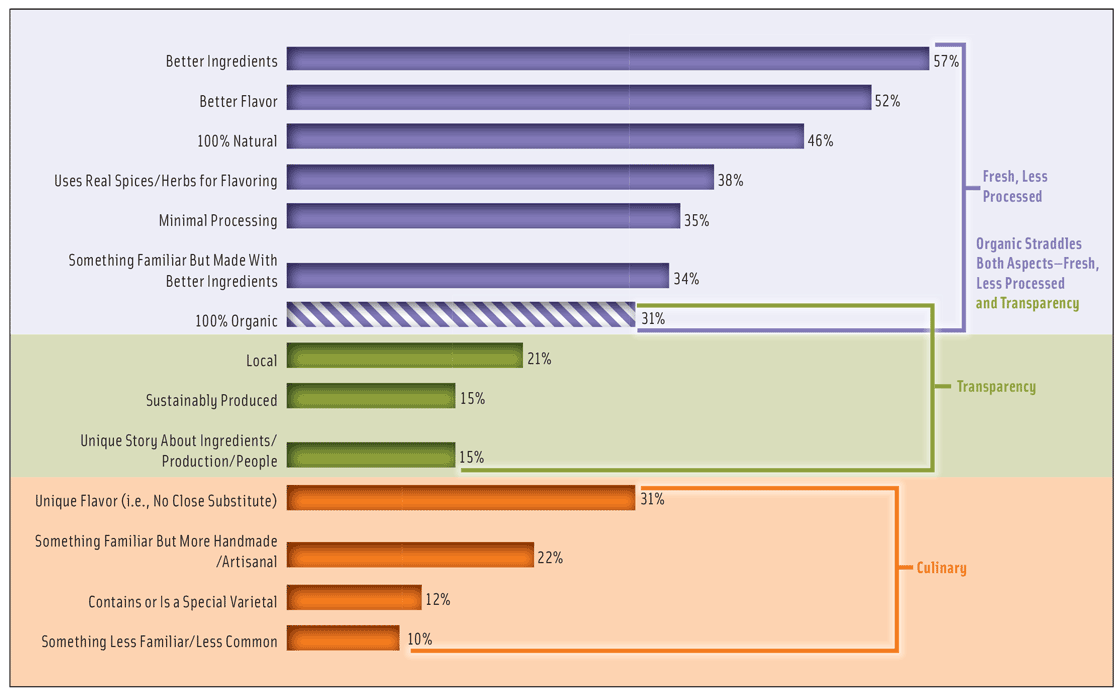
So how do today’s consumers define high quality foods and beverages? According to the Hartman Group, right after better ingredients and better flavor, cited by 57% and 52% of adults, respectively, consumers most often associate 100% natural, uses real spices/herbs for flavoring, minimal processing, unique flavors, and 100% organic with higher quality fare (Hartman 2015a, Figure 1).
Four in 10 U.S. adults regularly purchased premium foods/beverages in 2015; 29% looked for new foods and drinks that let them indulge without paying restaurant prices; 24% sought products that added excitement to their daily diet; and 21% looked for offerings that were truly new and different (IRI 2016a).
“Convenient decadence” was a dominant theme among the best-selling new foods and beverages introduced in the United States in 2015; even healthy best-sellers had a sophisticated flair (IRI 2016a).
With year one sales of $172.7 million, McDonald’s McCafé coffee topped the list of best-selling new foods/beverages last year, followed by Oscar Mayer Deli Fresh BOLD, with sales of $146.2 million; Dannon Oikos Triple Zero, $108.0 million; fairlife, $87.1 million; Yoplait Greek 100 Whips!, $83.6 million; Chili’s at Home, $78.9 million; Simply Juice Drinks, $70.5 million; Breyers Gelato Indulgences, $66.9 million; Cobblestone Bread Co., $60.2 million; and Cheerios Protein, $49.8 million (IRI 2016a).
Fresh premium items that are easy to prepare and eat are enjoying brisk sales. In 2015, sales of gourmet frozen lunch/dinner entrees and refrigerated entrees/prepared meals skyrocketed into the best-selling gourmet/specialty food category with sales of $1.9 billion (+21% over the past two years) and $1.2 billion (+37%), respectively (SFA 2016).
In 2015, sales of fresh snack-size vegetables grew at twice the rate of raw vegetables; sales of fresh-cut fruit climbed by 9.9%; and ready-to-cook fresh vegetable sales were up 5.4% in 2015. Forty percent of consumers bought premium precut fruits/vegetables in 2015 (IRI 2016b).
Sales of supermarket prepared food entrees jumped 10% in 2015. Sales of fresh prepared sides, salads, and appetizers each rose 9%; fresh breakfast entrees, +14%; fresh soups, +23%; and fresh deli dips/sauces, +35% (IRI 2016b).
--- PAGE BREAK ---
Take-and-bake fresh bread sales rose 12.5% in 2015, and sales of value-added meat (e.g., stir-fry mixes or preprepared items) were up by 5.4%. Value-added seafood (precooked/preseasoned) accounted for 21% of fish counter sales (IRI 2016b).
Sales of fresh-squeezed premium juice, infused water, and smoothies grew 22% in 2015 (IRI 2016b). Single-serve specialty desserts were the fastest-growing category within in-store fresh bakeries last year (IDDBA 2016).
The demand for fresh prepared foods is fueling a nationwide explosion of “grocerants,” which are small-footprint stores that only sell fresh prepared food. One-third of American Culinary Federation chefs surveyed by the National Restaurant Assoc. cited European-style “food halls” as a hot culinary trend for 2016 (NRA 2015).
Premium products increased share across all retail formats in 2015, especially mass merchandisers. Wine, yogurt, chocolate candy, and beer were the categories with the highest premium product share. Wine and energy drinks drove premium sales in convenience stores (c-stores); natural cheese, yogurt, and wine were the drivers in drug stores (IRI 2016c).
Consumers associate smaller companies, brands, and retail stores with higher quality, which translates into greater market share for many of these smaller players (IRI 2016d). Over the past five years, the 25 largest food manufacturers realized a compound annual growth rate (CAGR) of only 0.1%; for the next group of 75 manufacturers, the CAGR was 3.2%, and for the smaller companies tracked, the CAGR was 6.3% (Nielsen 2016).
The Foodie Phenomenon
Over the past five years, the number of consumers who want to be among the first to try a new food product rose by 39%; the number of those who want to eat more gourmet foods every day climbed by 27% (Packaged Facts 2015a).
Forty-eight million Americans define themselves as “foodies;” 29 million are further categorized by Packaged Facts as members of a highly involved, serious culinary core group. Millennials account for 36% of this dedicated group, Baby Boomers for 32%.
 Foodies are good for business. They’re most likely to shop for groceries four or more days per week and spend more time in the store than the average shopper. Although they usually buy 10 items or fewer per trip, foodies are more likely to spend $100 or more per visit; 47% of foodies do so versus 34% of “non-foodies” (Packaged Facts 2015a).
Surprisingly, keeping cooking time short is 66% more important to foodies than it is to the average consumer. Nearly half (47%) of foodies bake for fun versus just about a third (32%) of adults overall. Foodies are twice as likely to say that religion-based food guidelines, local customs, and keeping up family food traditions are very important (Packaged Facts 2015a).
These culinarily aware adults are also five times more likely to shop the natural channel (e.g., Trader Joe’s or Whole Foods) four or more times per month. They’re 60% more likely to buy organic/natural foods and 40% more likely to select local items, Packaged Facts reports.
Foodies are also more likely to eat several small meals per day and have a greater tendency to snack only on healthy items. Core foodies are much more likely than adults overall to count calories, be on a diet, and exercise regularly (Packaged Facts 2015a). According to Packaged Facts, foodies are also twice as likely to avoid certain foods/ingredients due to allergies or intolerances or to be vegetarian.
One in five foodies bought food from a restaurant 15 or more times in a typical month, which translates to at least every other day (Packaged Facts 2015a).
--- PAGE BREAK ---
Still Going Gourmet
Sales of specialty foods reached an all-time high of $120.5 billion in 2015, up 21.2% in dollar sales and 13.7% in unit sales over the preceding two years (SFA 2016). Sixty-one percent of adults bought specialty foods for everyday meals at home last year, 44% for everyday snacks, 33% for special occasions, and 16% as gifts (SFA 2015).
Those aged 25–44 were the most likely to buy gourmet foods, followed by those aged 18–24. While older consumers have a lower likelihood of purchase, they’re most likely to buy specialty foods/ingredients for meal preparation; younger adults are most likely to buy them for snacks, drinks, and easy meals (SFA 2015).
For the first time last year, men were slightly more likely than women to buy specialty foods (SFA 2015). With men now the primary food shoppers in 43% of U.S. households, catering to male specialty shoppers is a very big idea (FMI 2015a). Hispanics are far more likely than blacks or whites to buy specialty foods. Those on the coasts are the heaviest users (SFA 2015).
Indulgence remains an important driver of specialty foods. Premium cheese, frozen treats, chocolate, coffee, and cookies/baked goods were the most purchased specialty items last year. Oils, tea, pasta, yogurt, and meat/poultry/seafood rounded out the top 10 (SFA 2015).
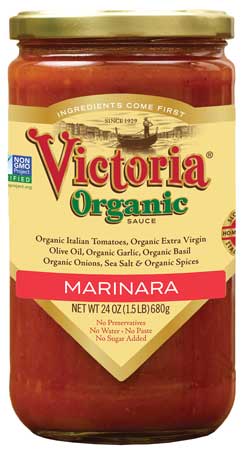 More fresh options drove significant gains in sales of gourmet pasta/pizza sauces. Oils and salty snacks were purchased less frequently than two years ago although chips made with alternative grains were among the fastest-growing specialty snack segments (SFA 2016).
Grocery stores still contribute 81% of retail specialty food sales ($45.9 billion), gourmet stores 11% ($6.3 billion), and natural food stores 7% ($4 billion). Sales grew at about the same rate—20%—across all three channels over the past two years (SFA 2016).
Cheese/cheese alternatives remained the largest specialty food category with sales of $4.3 billion, +9.7% in unit sales over the past two years. Unique blends, pimento, mascarpone, queso varieties, pecorino Romano, Cotija, Asiago, and Edam are among the fastest-growing cheese varieties. Smoked, nutty, and bitter flavors (e.g., espresso, beer/wine infusions), uncommon herbs, and fruit are among the up-and-coming cheese flavors (IDDBA 2016).
Frozen/refrigerated meat, poultry, seafood ($3.6 billion, +23%) and chips, pretzels, and snacks ($3.4 billion, +22%) rose to the No. 2 and No. 3 spots, respectively. Rounding out the list of the 10 largest categories are coffee, with sales of $3.2 billion, +17% in unit sales; bread/baked goods ($2.8 billion, +15%); candy/individual snacks ($2.2 billion, +21%); frozen lunch/dinner entrees ($1.9 billion, +21%); condiments, dressings, marinades ($1.9 billion, +10%); yogurt/kefir ($1.8 billion, +28%); and refrigerated entrees/prepared meals ($1.2 billion, + 37%) (SFA 2016).
Single-source and cold-brewed coffee are fast-emerging coffee megatrends (Packaged Facts 2015b). Fifty-eight of the top 61 specialty food categories posted double-digit sales growth in 2015; refrigerated tea/coffee, specialty eggs, jerky/meat snacks, refrigerated pasta, and water were the fastest-growing categories. Frozen juices/drinks, shelf-stable nondairy beverages, cold cereals, shelf-stable pasta, pickles, peppers, olives, and veggies were the slowest-growing (SFA 2016).
Italian was the top choice among ethnic specialty products/ingredients, purchased by 57% of shoppers, followed by Mexican (49%); regional American (36%); Chinese (33%); Asian non-Chinese, which includes Japanese, Korean, Thai, and Vietnamese, (32%); Spanish (26%); Hispanic, not including Mexican but including Central and South American, (25%); Greek/Mediterranean (21%); Middle Eastern and Indian (each 17%); and Eastern European (15%) (SFA 2015).
Ethnic condiments/spices (e.g., harissa, curry, peri peri, sriracha, chimichurri); authentic ethnic cuisines; and ethnic-inspired breakfast items are among the top 20 hot culinary trends overall for 2016. Ethnic-inspired street food appetizers/center-of-the-plate items, ethnic kids’ foods, and ethnic cheeses, flours, and dips are other up-and-coming 2016 culinary categories (NRA 2015).
Ethnic sandwiches (e.g., Cubano, tortas, cemitas, and banh mi); ethnic carriers/breads (e.g., brioche, challah, naan, and bao buns); and ethnic sauces (e.g., giardiniera, romesco, tapenade, tzatziki, chutney, and pickled) are fast gaining in popularity. Specialty food retailers project Mediterranean, Middle Eastern, and Thai to be the next wave of ethnic best sellers (SFA 2016).
Italian specialty deli meats, up 10% in sales in 2015, and deli salamis, up 20%, were the two fastest-growing deli meats last year (IDDBA 2016).
With 40% of all children’s eating occasions involving more sophisticated fare, it’s not surprising that gourmet kids’ meals are another one of the hot culinary trends for 2016 (Hartman 2014, NRA 2016).
Pickling, fermenting, smoking, and fire-roasting remain hot food preparation trends for 2016 (NRA 2015). Soufflés, frittatas, and bowl meals are also finding widespread acceptance as unique food forms for adventurous eaters.
SeaWatch International’s Deep Fried Clam Chowda comes in breadcrumb-coated bite-size pieces with a clam chowder center. Chicken breakfast sausages from Jones Dairy Farm introduce poultry to the early morning daypart.
Lastly, foodservice, which currently accounts for only 22% of specialty food sales, is a fast-emerging marketing opportunity. Sales of specialty foods in foodservice outlets climbed by 27% over the past two years. Tropical nachos, made with fruit salsa and lime-flavored chips, and Simplot’s ancient grain toppings for baked potatoes are among the unique new foodservice products now available.
--- PAGE BREAK ---
 Naturally Speaking
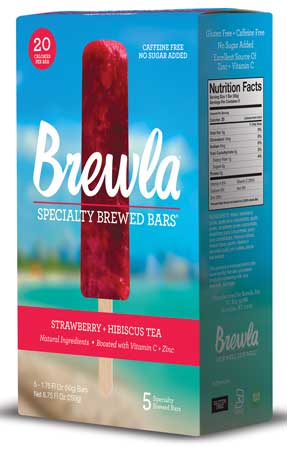
Eating more natural and healthy foods, especially those without artificial ingredients and preservatives, is second only to liking to try new items as the top reason for buying specialty foods (SFA 2015).
Food sales in natural products retailers reached $29.8 billion in 2014, the latest industry-wide data available (NFM 2015). SPINS estimates natural channel dollar sales growth at 8.3% for the year ended July 15, 2015 (Reina 2015).
In 2015, 10% of consumers shopped in natural/organic stores fairly often; 30% did so occasionally. Only 4% considered these stores their primary shopping channel (FMI 2015a).
Across all channels, organic foods/beverages posted the largest dollar gains ever, reaching sales of $39.7 billion, up 11% versus 2014. Nearly 5% of all food sold in the United States in 2015 was organic (OTA 2016).
Organic produce remains the largest of all organic categories with sales of organic fruits/vegetables—fresh, canned, frozen, and dried—totaling $14.4 billion, up 10.5% in 2015, followed by organic dairy with sales of $6.0 billion, up more than 10%.
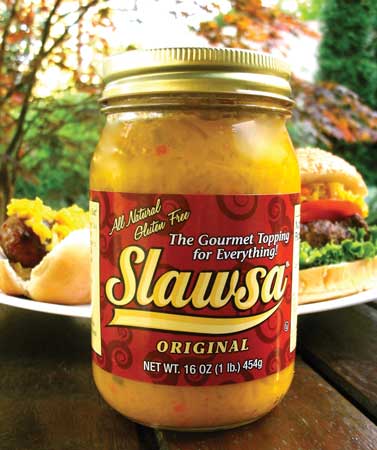 Sales of organic snack foods topped $2.3 billion, up nearly 14%. Condiments, which topped $1 billion in sales in 2015, were the fastest-growing of the eight major organic categories, up 19.5% (OTA 2016).
Demand for fresh organic products was evident in the continued growth of fresh juices and drinks, which saw explosive growth of 33.5% in 2015, making this the fastest-growing organic subcategory. Sales of fresh organic eggs jumped almost as much—32%, according to the Organic Trade Assoc.
Specialty food consumers spend the most on foods that carry an all-natural or organic claim, followed by locally sourced and products that are not genetically modified (GM) (SFA 2016). While local/organic and natural are the top specialty food claims today, specialty food retailers, brokers, and importers predict that non-GM will be the most important claim within three years (SFA 2016).
Developing gluten-free products is on the new product innovation agenda for 52% of specialty food manufacturers, followed by non-GM (cited by 49%), convenient/easy to prepare (46%), indulgent (32%), and functional (29%). Other product development priorities for specialty food manufacturers include allergen-free/free-from (e.g., dairy, nut, soy), organic, portable, reduced/no sugar, less indulgent, and high protein (SFA 2016).
With “made with organic ingredients” now a fast-emerging trend in the mass market, it’s not surprising that sales of foods/beverages carrying claims of “more than 70% organic” are finding favor in the natural channel. Sales of such products were up 13% in dollar sales for the year ended July 12, 2015, per SPINS (Reina 2015).
While many of the most popular claims of natural, clean, and/or sustainable have emanated from specialty markets, they’re quickly moving mainstream. More than one-third (34%) of all consumers said it is especially important to choose foods that are not genetically modified (Sprinkle 2016).
--- PAGE BREAK ---
Nielsen reports that sales of products that carried GM-free claims jumped 14.3% in mass channels from 2012 to 2015. Other product attributes associated with sales growth include made with ancient grains, gluten-free, no high fructose corn syrup, no artificial flavors, no artificial sweeteners, and kosher (Mandzy 2016).
The compound annual growth rate in mainstream channels for foods that carry a “no hormone” claim was 29% between 2011 and 2015; for products that make an antibiotic-free claim, the CAGR was 34% (Mandzy 2016). In 2015, more than half (52%) of all consumers were trying to avoid growth hormones; 35% of mainstream shoppers purchased natural or organic meat (FMI 2016, Hartman 2015b). Two-thirds of consumers are very interested in meat and poultry grown or raised in the United States, and 59% are very interested in U.S.-grown produce.
In 2015, 15% of consumers bought a grocery product that featured sprouted grains; for ancient grains, the figure was 16%. Quinoa, barley, chia, ancient grain blends, buckwheat, bulgur, millet, amaranth, and spelt were the most purchased in descending order (Packaged Facts 2015c).
More than half (55%) of those who bought ancient grains did so to eat more whole grains; 31% did so to avoid GM ingredients and 19% to avoid gluten (Packaged Facts 2015c). Four in 10 consumers (44%) bought sprouted grains to get more vitamins; 34% did so for minerals. In addition, 27% opted for them because of their protein content, and the same percentage said it was because they believed they were easier to digest.
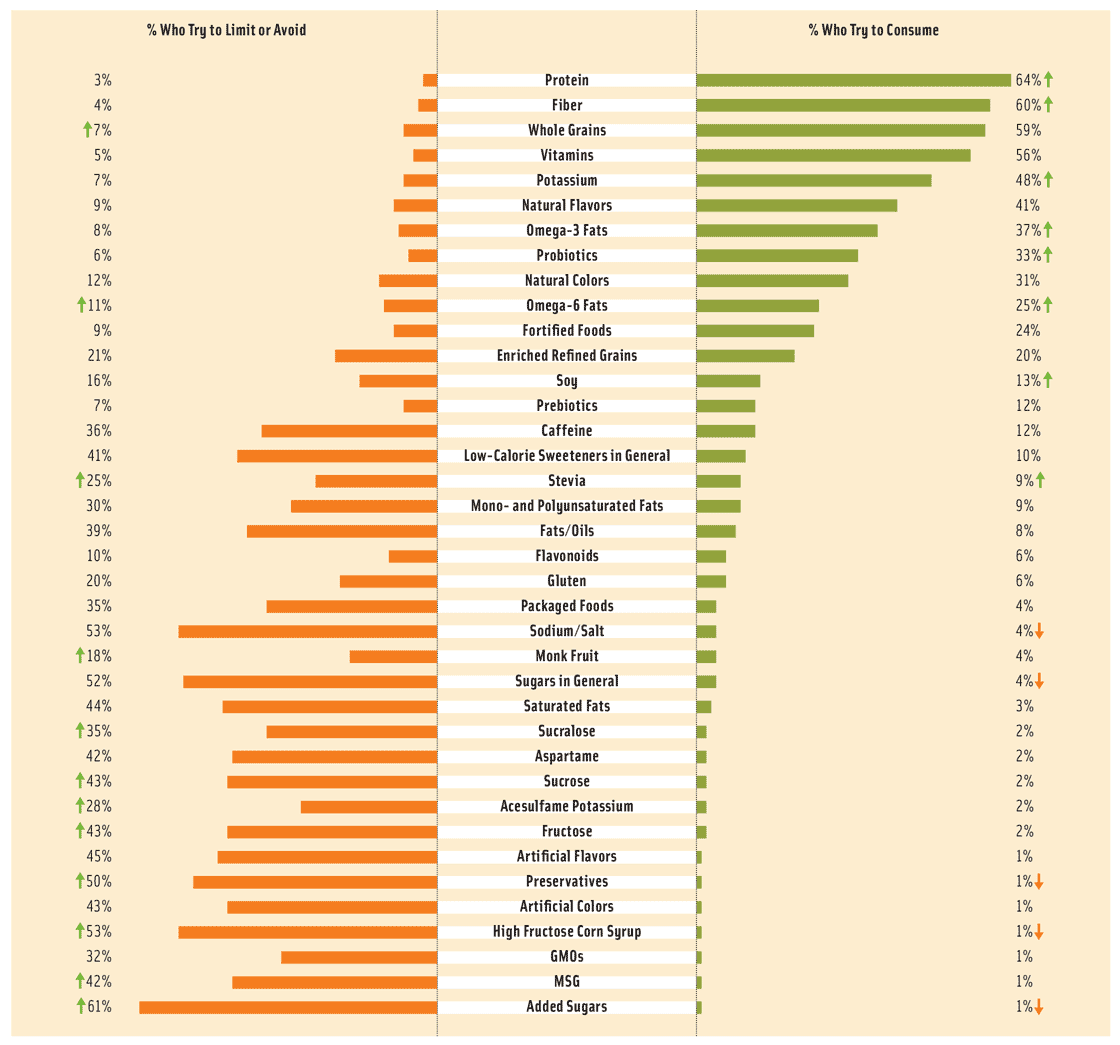
Nearly two-thirds of consumers (64%) are trying to consume more protein (IFIC 2016, Figure 2). One in five adults, led by those aged 25 to 39 as well as Asian and Hispanic consumers, specifically seek out products formulated with plant protein (Packaged Facts 2016a).
Unusual/uncommon herbs (e.g., chervil), hybrid fruits/vegetables, heirloom products, exotic fruits (e.g., jackfruit and pepino melons), and extra-hot peppers (e.g., ghost peppers) remain center stage (NRA 2015).
In 2015, about a quarter (24%) of all consumers said they thought a lot about how their food was produced, and 47% said they gave it some thought (IFIC 2015).
Two-thirds of consumers say they want animals raised in as natural an environment as possible; 47% say humane treatment of food animals is very important in their purchase decisions (Hartman 2015c). Four in 10 claim that sustainability has a great impact on the foods they buy, up from 35% in 2015 (IFIC 2016).
Locally sourced meats, seafood, and poultry; hyper-local sourcing; natural ingredients/minimally processed foods; environmental sustainability; sustainable seafood; farm-/estate-branded items; and food waste reduction/management are among the top 20 overall hot culinary trends for 2016 (NRA 2015).
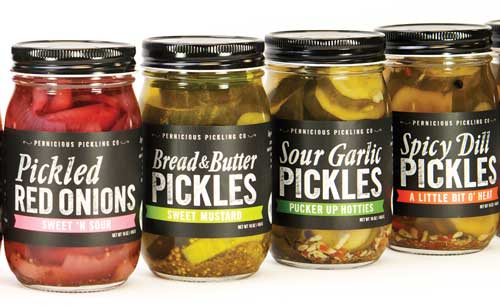 Homemade/house-made/handmade, seasonal, and craft descriptors have maintained their quality distinction. Homemade/house-made soft drinks, pickles, sausage/charcuterie, onsite barrel-aged alcoholic drinks, and artisan ice cream are also among the hot culinary trends for 2016 (NRA 2015).
Vegetarian diet–fed, vegan, Bisphenol A–free, B Corp Certified, paraben-free, and free of phthalates are up-and-coming descriptors in the specialty arena, per SPINS (Reina 2015). Products made using upcycling (creative reuse) are also trendy.
Twenty-six percent of adults say they’re more likely to purchase a food/beverage that is Fair Trade certified. In addition, 23% feel that way about Rain Forest Alliance certification and 13% about Marine Stewardship Council certification (Burkley 2016).
--- PAGE BREAK ---
Venue Menus
One of the biggest opportunities for premium food marketers may well come from greater alignment with retail formats/services that cater to today’s time-constrained, on-the-go consumers.
It’s time to pay attention to the convenience channel, which has 154,195 outlets—more than triple the number of supermarkets, supercenters, or superettes (51,055), drug stores (41,969), or dollar stores (27,378) (NACS 2016).
The largest c-store CPG categories include beer, with sales of $18.5 billion in 2015, up 2.3% in unit sales versus 2014; carbonated beverages, $9.0 billion, +1.8%; energy drinks, $8.8 billion, +8.1%; salty snacks, $4.8 billion, +4.7%; bottled water, $3.8 billion, +10.1%; and sports drinks, $2.9 billion, +8.3%. It’s the fresh prepared, culinarily inspired, and better-for-you items that are poised for growth, however (CSP 2016).
Six in 10 c-store operators predict that sandwiches and meats will drive sales for the remainder of 2016; 54% say packaged drinks; 47%, fountain drinks; 30%, fresh fruits, vegetables, and prepared salads; and 29%, healthy packaged snacks (Anonymous 2016).
In 2015, c-store foodservice sales reached $19.5 billion, up 3.9%; supermarket fresh prepared food sales were $28.2 billion, +8.6% (CSP 2016).
Sixty-two percent of c-store customers bought a fresh/refrigerated meal solution in 2015, according to Technomic; 48% of those aged 18–34 did so at least once a week. Unit sales of refrigerated handheld entrées jumped 11.3% in c-stores in 2015; sales of refrigerated breakfast entrées climbed by 13.5%; and sales of refrigerated handheld lunches surged by 32.2% (CSP 2016).
Sandwiches contributed 24.7% of prepared food entrée dollars; hot dogs, 17.0%; pizza, 16.6%; chicken, 12.3%; bakery, 6.9%; salads, 4.0%; hamburgers, 3.4%; soup, 2.4%; and frozen, 1.8% (CSP 2016). Tamales, ethnic sausages, Chinese egg rolls, and unique breakfast items are among the trending roller grill offerings (Phillips 2016).
Right after gasoline and packaged beverages, snacks are the top reason to visit a c-store; 38% of consumers buy a snack at a c-store at least once a month. Afternoon snacking (2–4 p.m.) is the fourth-most-lucrative c-store daypart, after breakfast, lunch, and dinner (Powell 2016). All c-store snack categories posted gains in dollar and unit sales, led by snack nuts, dried meat snacks, cheese snacks, pretzels, nutritional snacks/trail mixes, and pork rinds (CSP 2016).
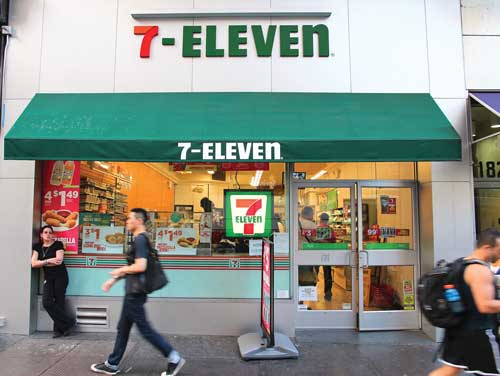 Forty-four percent of c-store shoppers feel it is extremely/very important for stores to offer more better-for-you products; 63% of Millennial c-store shoppers feel that way (CSN 2016). Sixty-two percent of c-store shoppers feel natural foods/beverages are important to maintain their health (NACS 2015).
Sales of health/nutrition bars jumped 16.6% in c-stores in 2015; fresh produce was up 10.3% (CSN 2016). C-store unit sales of refrigerated weight loss liquids/powders shot up 24.8% in 2015 (CSP 2016). Convenience retailer Wawa flags sandwiches that are less than 500 calories with a special seal.
One in five fill-in grocery shopping trips (19%) in the United States is to a c-store. Items most purchased on fill-in trips include milk, bread, soda, eggs, salty snacks, ice cream, cheese, and juice (General Mills 2016).
Drug stores are also expanding their food offerings to take advantage of fill-in trips, adding items to the grocery merchandise mix (e.g., milk, cheese, yogurt, and lunch solutions). In 2015, 19% of consumers bought a ready-to-eat/heat prepared food at a drug store, according to Technomic (CSN 2016).
Lastly, because half (53%) of c-store customers have children under the age of 12 at home, kid-specific prepared foods and healthy snacks for kids are an untapped market opportunity (CSN 2016).
Sales by meal-kit delivery services—which supply premeasured ingredients/recipes that allow consumers to easily prepare restaurant-quality meals at home—are projected by Packaged Facts (2016b) to reach $1.6 billion in 2016 and to double within the next few years.
Although there are more than 150 meal-kit delivery services—led by Blue Apron, HelloFresh, and Plated, there’s plenty of room for growth. Watch for greater growth in ethnic-specific, vegetarian/vegan, and organic meal options as well as those for adults eating alone or families with young children (Packaged Facts 2016b).
--- PAGE BREAK ---
Crock-Pot Cuisine delivers flash-frozen meals that are ready to toss into the crock-pot and slow cook. Ahold offers fresh meal kits for in-store purchase or delivery via Peapod. Love with Foods will mail a month of unique, healthy premium snacks to your door.
With 13% of those who are trying to lose weight following a diet plan that offers food delivery, catering to specific health needs with food kits is a very timely idea (Mintel 2016b).
The number of restaurant meal deliveries outside of pizza has jumped 33% since 2012 while the number of pizza deliveries has declined. UberEATS and Amazon Prime Now restaurant delivery services continue to roll out nationally; EAT24, Grub Hub, and Seamless are growing foodservice meal delivery chains (NPD 2016).
The opportunities in this area have not been lost on packaged foods manufacturers. Campbell Soup, Tyson, ConAgra, Barilla and others are partnering with retailers to create home-delivered and in-store meal kits.
Specialty food and beverage users are also helping to pave the way for e-commerce food retailing. Fifty-three percent of specialty shoppers ordered at least one food item online in 2015; one-third are using or actively looking for an online grocery delivery service. Chocolate, coffee, and tea were the gourmet food items purchased most frequently online (SFA 2015).
While online grocery retail shopping—whether home-delivered or picked up elsewhere—currently accounts for less than 1% of the $675 billion grocery category in the United States, e-grocery sales are projected to enjoy a CAGR of 21.1% through 2018, reaching $18 billion in sales (BI 2015).
In 2015, 7% of shoppers used an online channel for grocery shopping/delivery. This includes 12% of Millennials, 6% of Gen Xers, 5% of Baby Boomers, and 6% of those aged 70-plus. Half of online users placed orders less frequently than once a month (FMI 2015a).
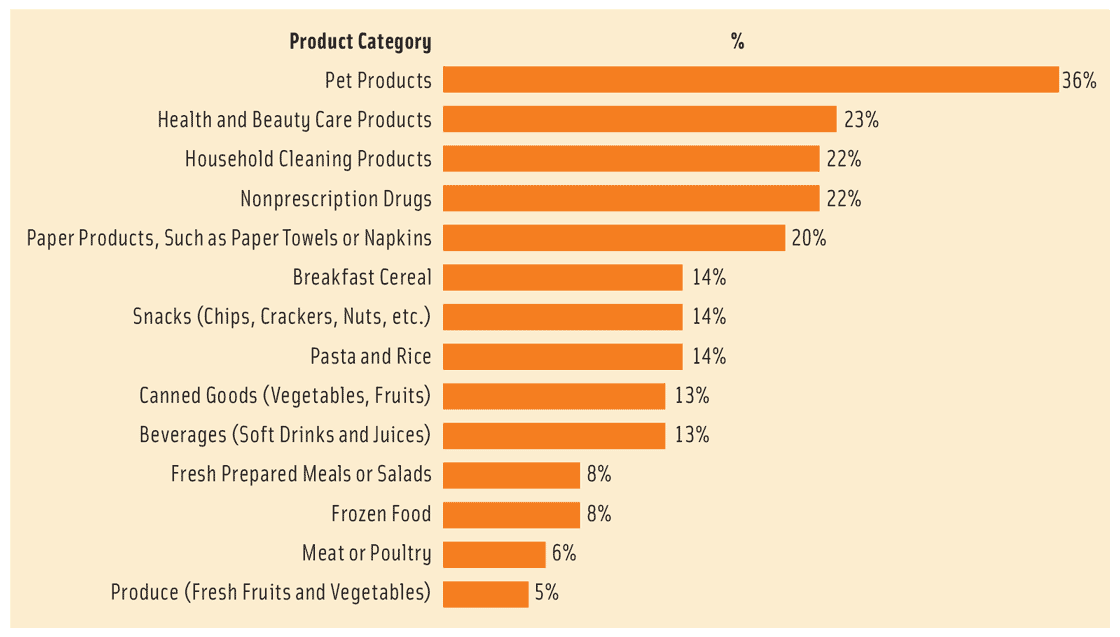
One-third of shoppers say they would prefer to order pet food online. For breakfast cereal, snacks, and pasta, the figure is 14% (FMI 2015a, Figure 3).
Instacart provides same-day delivery from Costco, Whole Foods, and Safeway stores in some areas. Walmart has announced expansion of its Walmart.com grocery pickup service in more than 200 stores.
Mondelēz, General Mills, PepsiCo, and Campbell’s Soup have shared plans for more aggressive direct-to-consumer Internet sales programs. There is enormous potential for sales growth given that the U.S. market is serviced by 3.3 million cold beverage vending machines, 1.4 million candy/snack machines, 317,744 hot beverage machines, and 184,519 vending machines that dispense fresh/frozen prepared products. In 2014, cold beverage machines posted revenues of $7.6 billion; candy/snack/confections, $7.2 billion (Refermat 2015).
While carbonated soft drinks, chips, candy, diet soft drinks, sandwiches, and energy drinks are the most frequently purchased vended food items, eight in 10 vending operators reported that their locations asked to increase the proportion of heathy items in 2015 (Refermat 2015).
Healthier options, including beverages other than carbonated soft drinks, cheese/meat snacks, nuts/seeds, granola, fruit/vegetable snacks, organic items, specialty crackers/pastries/cookies, nutrition bars, dried fruit, and hummus posted strong gains in vending machine sales (Refermat 2015).
Vending concepts such as Let’s Pizza, which provides fresh and hot pizza, and Farmer’s Fridge, a self-serve salad kiosk, are among the new options (Shimek 2016). Similarly, food trucks, along with street food, are among the leading culinary trends for 2016 (NRA 2015). College campuses remain the leading market for food trucks. One-quarter (26%) of noncommercial foodservice school/college operators have one or more trucks on campus (Anonymous 2015).
Showcasing more single-serve premium items such as signature specialty pastries, gourmet mini-sandwiches, or even pet treats at the front end/checkout area of the store is a smart merchandising strategy that remains untapped. Currently, beverages dominate at the front end, accounting for 43% of sales, followed by confectionery at 32% and magazines at 17% (FMI 2015c).
And finally, authentic free-standing delis, fresh bakeries, butcher shops, specialty cheese stores, and ethnic food shops focused on one region or cuisine are once again on the rise.
A. Elizabeth Sloan, PhD, a professional member of IFT and contributing editor of Food Technology, is president, Sloan Trends Inc., Escondido, Calif. ([email protected]).
References
Anonymous. 2015. “The Big Picture: Are Food Trucks the Wheel Deal?” Jan 2. foodservicedirector.com.
Anonymous. 2016. “Low Gas Prices Help Fuel Convenience Store Sales.” April 5. NACSonline.com.
BI Intelligence. 2015. How e-commerce Is Finally Disrupting the $600 Billion Dollar-A-Year Grocery Business. Jan. business intelligence.com.
Burkley, T. 2016. “What’s Next?” Presented at the Food 2.0 Summit, Los Angeles, July 7.
CSN Staff. 2016. “Guide to Foodservice.” Convenience Store News, Jan.
CSP. 2016. Category Management Handbook, Convenience Store & Fuel News 27(5): 11–60. cspnet.com.
FMI. 2015a. U.S. Grocery Shopper Trends. Food Marketing Institute, Arlington, Va. fmi.org.
FMI. 2015b. The Power of Produce.
FMI. 2015c. Front End: Get the Most from Your Shoppers’ Last Chance to Purchase.
FMI. 2016. The Power of Meat.
General Mills. 2016. Convenience & Foodservice Study 2015. General Mills Inc., Wayzata, Minn. generalmills.com.
Hartman. 2014. The Hartman Group’s Eating Occasions Compass Database 2012–2014. The Hartman Group, Bellevue, Wash. hartman-group.com.
Hartman. 2015a. Culture of Food.
Hartman. 2015b. Health & Wellness.
Hartman. 2015c. Sustainability/Transparency.
IFIC. 2015. What’s Your Health Worth? Food & Health Survey. International Food Information Council Foundation. Washington, D.C. foodinsight.com.
IFIC. 2016. Food Decision 2016: Food & Health Survey.
IDDBA. 2016. What’s in Store? International Dairy Deli Bakery Assoc., Madison, Wis. iddba.com.
IRI. 2016a. New Product Pacesetters: Harvesting the Fruits of Innovation Done Right. Information Resources Inc., Chicago. iriworldwide.com.
IRI. 2016b. “Top Trends in Fresh Webinar: Convenience,” April 28. IRI, FMI, Burris Logistics.
IRI. 2016c. “Effective Premiumization Strategies in CPG Can Achieve 10–15 Percent Topline Growth.” Times & Trends, Feb.
IRI. 2016d. “Taking Stock of CPG Past and Future: Gear Up Now for a Year of Growth.” Times & Trends, Jan.
Mandzy, A. 2016. “High on Protein: Insights into a Consumer Search for Health.” Presented at Protein Trends & Technology Seminar, Global Food Forums, Oak Brook, Ill., May 3–4.
Mintel. 2016a. “Sirtfood Diet: The Diet Plan that Includes Chocolate and Red Wine.” Press release, May 18. Mintel International, Chicago. mintel.com.
Mintel. 2016b. “Super Growth for ‘Super’ Foods: New Product Development Shoots Up 202% Globally Over the Past Five Years.” Press release, May 5.
NACS. 2015. Health & Wellness Trends and Strategies for the Convenience Store Sector. National Assoc. of Convenience Stores, Alexandria, Va. nacsonline.com.
NACS. 2016. “Nielsen Convenience Store Growth as of Dec. 31, 2015.”
NPD. 2016. “Foodservice Home Delivery, Excluding Pizza, Grows by Double Digits and Direct-to-Door Meal Kits Are Finding Niche Market.” Press Release, Feb. 9. The NPD Group, Port Washington, N.Y. npd.com.
NFM. 2015. “Market Overview Data Charts and Graphics.” May 12. Natural Foods Merchandiser. New Hope 360.
Nielsen. 2016. “The Largest Manufacturers are Not Growing. Nielsen U.S. Scantrack, Year Ending 2011 – 2015.” Nielsen, New York, N.Y. nielsen.com.
NRA. 2015. What’s Hot Chef Survey. National Restaurant Assoc., Washington, D.C. restaurant.org.
OTA. 2016. OTA Organic Industry Survey. May. Organic Trade Assoc., Washington, D.C. ota.com.
Packaged Facts. 2015a. Foodies in the U.S.: Opportunities for Restaurants and Retail. May. Packaged Facts, Rockville, Md. Packagedfacts.com.
Packaged Facts. 2015b. Coffee and Ready-to-Drink Coffee in the U.S. Retail and Foodservice. Nov.
Packaged Facts. 2015c. Ancient Grains and Sprouted Ingredients. Aug.
Packaged Facts. 2016a. Food Formulation and Ingredient Trends: Plant Proteins.
Packaged Facts. 2016b. Meal Kit Delivery Services in the U.S. May.
Phillips, B. 2016. “How to Keep Your Roller Grill Sales Rolling.” Convenience Store News, March.
Powell, J. 2016. “PM Snacking: the Hottest C-store Daypart.” Convenience Store News, Jan.
Refermat, E. 2015. “Vending Operators Punch Through Last Year’s Revenue: State-of-the-Industry Report.” Automatic Merchandiser 57(4): 24–31.
Reina, E. 2015. “SPINS: An Industry Overview: Data year ending 7/12/2015.” Presented at SPINS Natural Product Summit, San Diego, Aug. 8.
SFA. 2015. Today’s Specialty Foods Consumer. Specialty Food Assoc., New York, N.Y. specialtyfood.com.
SFA. 2016. State-of-the-Specialty Food Industry.
Shimek, J. 2016. “What’s for Dinner? Behaviors, Products, and Services Creating the New Future of Food.” Presented at Protein Trends & Technologies Seminar, Global Food Forum, Oak Brook, Ill., May 3–4.
Sprinkle, D. 2016. “Consumer Market Opportunities in Protein.” Presented at Protein Trends & Technology Seminar, Global Food Forum, Oak Brook, Ill. May 3–4.


