Favorable Foreign Exchanges
Street fare, frozen foods, on-the-go fresh snacks, and restaurant concepts are among the most exportable ideas in today’s fast-evolving global food market.
Article Content
It’s ironic that despite efforts in some Western countries to get back to basics and eat more fresh, less processed foods, lifestyle changes around the world are driving global consumers to embrace more packaged foods.
By 2021, sales in the global packaged food industry will reach $2.2 trillion. China, which is expected to contribute one-third of sales growth during this interim period, will account for 11% of global packaged food/drink sales (Euromonitor 2016a).
Canada will become the twelfth-largest food market in the world, still ahead of India. The Middle East will account for 6% of global packaged food sales (Euromonitor 2016a).
Sales of healthful packaged foods will continue to outpace the market (Hudson 2017). Two-thirds of global consumers say they’re willing to pay more for foods/beverages that don’t contain undesirable ingredients (Nielsen 2016a).
In 2016, global foodservice sales grew by 4.6%. Over the next five years, Chinese consumers are expected to spend nearly twice as much as Americans on food consumed away from home (Euromonitor 2017a). Nearly half (48%) of global consumers now eat out at restaurants or other dining venues at least once a week (Nielsen 2016a).
The number of households globally reached 2.1 billion in 2017. The global population is projected to top 8 billion by 2025 (Euromonitor 2017b).
Reset: Global Food Market Drivers
The unprecedented rate of urbanization around the globe is driving new food retail development, longer commute times, and a demand for on-the-go and grab-and-go foods. In 2017, 4.1 billion people, or 55% of the world’s population, live in urban areas (Euromonitor 2017c).
 By 2030, two-thirds of the Chinese population will be urbanites, and for Africa/the Middle East, the figure will be 41%. Three-quarters of global consumers with incomes over $100,000 a year live in cities (Euromonitor 2017b).
With more than half (52%) of global consumers saying that “they live comfortably and can buy some things just because they want them,” expect premium foods/beverages to maintain their popularity. Those in the Asia Pacific region, followed by North America, are the most likely to be “able to spend freely on food/beverages” (Nielsen 2016b).
Made with high quality ingredients is the top food attribute global consumers associate with high quality. Other attributes that are associated with high quality include “truly unique,” “from a location known for superior quality,” and “handcrafted” (Nielsen 2016b).
One-third (35%) of global consumers say they can barely make ends meet, driving an urgent need for more economy-driven and private label food products worldwide. Economy claims on new foods and beverages increased 25% globally from 2010 to 2015 (Mintel 2017a).
Greater workforce participation is driving a need for more convenient meal solutions, kid-specific foods, and fresh prepared/takeout foods. Switzerland, Sweden, the Netherlands, Norway, Denmark, and China have the highest workforce participation. Switzerland, Norway, Sweden, Denmark, Japan, China, Canada, and Germany have the highest percentage of working women (Euromonitor 2017d).
Long working hours and the loss of leisure time will continue to drive the demand for food to be an experience. Those in Egypt, Saudi Arabia, Mexico, and India work the longest hours (Euromonitor 2017d).
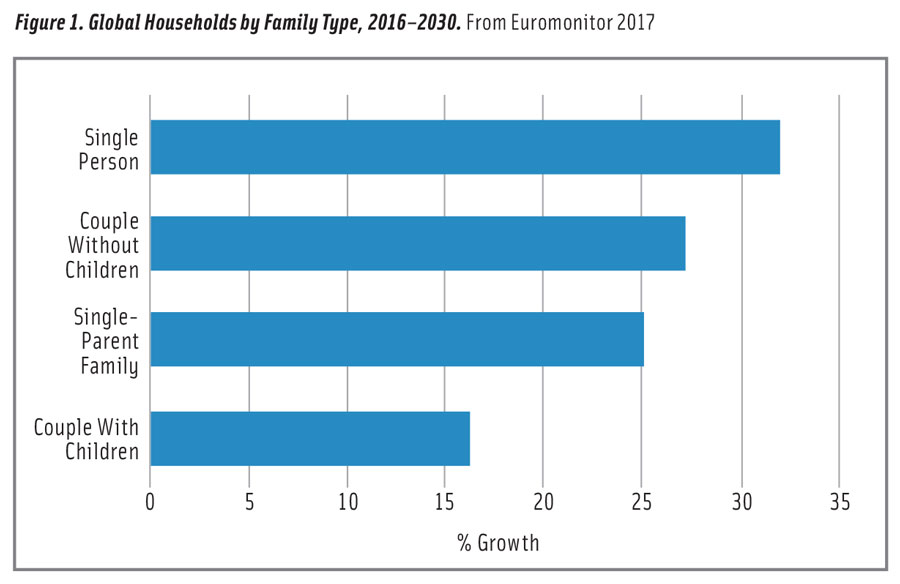
Single-person households are the fastest-growing global household unit (Figure 1). By 2030, an additional 120 million new single-person homes will drive a new worldwide trend to solo dining and increase demand for more single-serve and portionable fare (Euromonitor 2017e).
By 2030, the number of those aged 65-plus will have increased by 65%, and the number of those aged 45–64 will have climbed by 24% versus 2015 (Feldman 2017).
Although Millennials are forecast to number 1.7 billion by 2030, many still live with their parents and have yet to become free-spending consumers. In Australia, they’re dubbed “boomerang kids”; in Japan, they’re referred to as “parasite singles” (Euromonitor 2017b).
Fast Forward
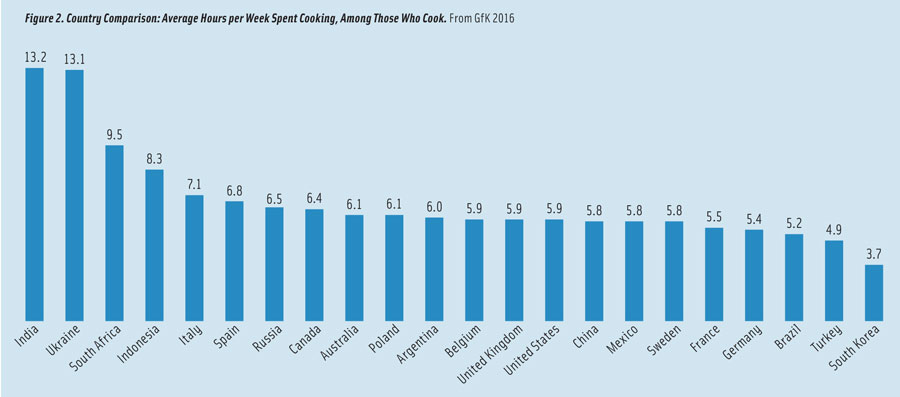
Global meal preparers spend an average of 6.4 hours a week cooking. Those in India and the Ukraine spend the most time cooking (13.2 hours/week), followed by those in South Africa, Indonesia, Italy, Spain, Russia, Canada, and Australia. Meal preparers in Turkey and South Korea spend the least (GfK 2016, Figure 2).
Time spent cooking increases with age, going from 5.8 hours a week for those aged 20–29 to 7.9 hours weekly for those aged 60-plus. Twenty-nine percent of global meal preparers claim they’re very knowledgeable/experienced cooks (GfK 2016).
Watch for more fresh, value-added products (e.g., grab-and-go salads or fresh wok noodles). Supermarket prepared foods, fresh bake-off breads/pastries, and cake mixes for classic recipes (e.g., biscotti or strudel) are also on the rise.
In November 2016, Germany-based HelloFresh announced that it was delivering 6.1 million fresh meal kits in seven countries (Euromonitor 2016b). Online retail accounted for 5.1% of packaged food distribution in the United Kingdom in 2015; in France, it was 3.8% (Euromonitor 2016b).
The global frozen food market is projected to grow 4.3% per year to top $380.3 billion by 2025. Ready meals—the largest category—account for 40% of sales; frozen pizza is the fastest-growing. Asia Pacific leads market growth (Research & Markets 2017).
The number of global food/drink launches with an on-the-go claim rose 54% over the past five years (Mintel 2017a). Similarly, daypart and on-the-go destination dining claims (e.g., breakfast, desk, gym, etc.) are also on the rise. Innova (2016) reports a 125% jump in new products featuring the word office and an increase of 24% for those that highlight the word school.
The global on-the-go breakfast market is projected to jump 46% by 2026 with new growth coming from Western Europe. In 2016, Western Europe accounted for 18% of the market, and Asia Pacific also accounted for 18% (Hyslop 2017).
Nearly half of Chinese consumers prefer a portable, easy-to-eat breakfast versus 44% of those in Brazil who prefer it, 42% in the United States, and 27% in the United Kingdom. Nearly one-third of Chinese and one-quarter of UK consumers feel there aren’t enough healthy breakfast options (Nielsen 2016c).
Kid-specific products are fast becoming a global phenomenon. Eight in 10 consumers in Latin America report that their children aged 3–11 have considerable input into food purchasing decisions; 77% in Europe say that is the case, 69% in Asia-Pacific, and 67% in North America (Kasriel 2017).
Dairy, ready meals, cereals, and snacks were the most active global new product categories for products carrying a kid-specific claim, all with double-digit growth in 2015 (Innova 2016a).
 Mealtime Trends
Lunch and dinner are the meals that global consumers most frequently eat away from home, but breakfast has high potential for increased away-from-home consumption. Hong Kong, Taiwan, Malaysia, and Thailand are the places where consumers are most likely to eat away from home more than once a day (Nielsen 2016a). Consumers in Brazil, India, and Russia spend the most time preparing lunch at home (Euromonitor 2016c).
Quick-service/express formats (e.g., Pizza Hut’s Pizza Express) were the top foodservice performers across the globe. Specialist coffee shops were the second fastest-growing format in 2016, with growth highest in Latin America and the Asia-Pacific area (Euromonitor 2017a).
Domino’s Pizza, with sales growth of 13.9% in 2016, was the fastest-growing chain in the global top 10. McDonald’s remained the world’s largest restaurant chain, followed by Starbucks (Euromonitor 2017a).
Convenience store fast food, which posted sales gains of 6.1% in 2016, will be a strong global foodservice contender (Euromonitor 2017a). Those in Malaysia (51%), Taiwan (50%), and Vietnam (48%) were the most likely to eat food from street-food vendors (Nielsen 2016a).
Chicken was the fastest-growing menu format in 2016, up 8% to $65.6 billion in global sales, led by KFC, Chick-fil-A, Buffalo Wild Wings, Popeyes Famous Fried Chicken, and Dicos (Euromonitor 2017a).
In 2016, soft drinks were the products most often purchased away from home, followed by snacks, lunch, dinner, alcohol, and breakfast (Euromonitor 2016c). Healthy menu items were most important in Asia, followed by North America and Africa/the Middle East (Nielsen 2016a).
Around the globe, snacks are becoming almost as important and common as meals, with peak snacking times occurring from 7 a.m. to 11 a.m. and 4 p.m. to 5 p.m. In France, India, and Brazil, it is common to snack before a late dinner; in Germany and China, after an early dinner (Euromonitor 2016c).
In 2016, the salty snacks category posted double-digit growth in the Netherlands (+16.7%), Belgium (+16.4%), Egypt (+15.9%), the Philippines (+12.1%), and India (+11.1%). Ice cream sales enjoyed explosive growth in Austria (+18.3%), the Philippines (+9.9%), and Poland (+ 9.5%) (Nielsen 2016a).
 Foreign Foods and Flavors
One-third (32%) of global consumers are very passionate about food and cooking; those aged 30–39 are the most likely to agree. Italians, followed by those in South Africa, Indonesia, Mexico, India, and Brazil, are the most passionate about food and cooking. Three in 10 global meal preparers cook at least once a week for fun (GfK 2016).
Earthy cuisines/flavors (e.g., Syrian, Moroccan, Israeli, Turkish, Indian, and Ethiopian) are rising in global popularity as are African/Middle Eastern spices (e.g., cardamom, curry, za’atar, garam masala). Zhug is a Middle Eastern sauce gaining traction (Datassential 2017a).
Light fruit flavors (e.g., lemon, orange, or rose water) are being used to offset heat; signature Beurre blanc sauces (e.g, chopped rosemary-orange) are fast gaining attention.
Authentic flavors (e.g., Madagascan vanilla or Mexican chipotle) appeal to 37% of French, 36% of Polish, and 35% of Spanish adults (Mintel 2017a). Thirty-eight percent of diners in the United States are interested in trying vadouvan, a French spice blend inspired by Indian curries. Baja, Cuban, and Filipino are other emerging global cuisines (Datassential 2017a).
With globally inspired street food the second-hottest overall U.S. culinary trend for 2017, expect Greek gyros, Salvadorian pupusas, Armenian kebabs wrapped in lavash, singara from Bangladesh, Bolivian salteñas, or the Republic of Georgia’s khachapuri to find a welcome market (Scott 2017).
Over the past four years, banh mi sandwiches on U.S. menus have grown 393% (Datassential 2017b, NRA 2016). Watch for Indian vada pav, Spanish bocadillo, and Mexican cemita sandwiches to grow in popularity.
Korean bibimbap will bring excitement to the bowl meal trend; shakshuka’s sizzling bowls will spice up the breakfast daypart. Tomcats (a Japanese fried pork dish), Spanish paella, and Chinese General TSO’s-style proteins are among the rising main dish stars (Datassential 2017a).
In the United States, 43% of U.S. consumers are interested in trying kimchi; 41% are interested in mostarda, a candied fruit condiment; 40%, Swiss Raclette cheese; 38%, savory teas made from vegetables/spices; 28%, sake; and 27%, nduja, a spicy, spreadable pork salami from Italy (Datassential 2017a).
Japanese ume plums, jackfruit, freekeh, finger limes, Aleppo pepper, sacha inchi from Peru, and finger limes are other foods that consumers are interested in trying (Datassential 2017a).
Watch for classic desserts (e.g., banoffee pie from the United Kingdom, ganache, Mexican chocolate, kouign amann, crème brulée, and age-old favorite flavors (e.g., butterscotch and caramel) to revitalize the dessert sector (Datassential 2017a).
 Naturally Speaking
Nearly two-thirds of global consumers say they follow a diet that limits or totally avoids some foods or ingredients, led by 84% of those in Africa/the Middle East and 72% in the Asia Pacific region. Six in 10 agree that the absence of undesirable ingredients is more important than the inclusion of beneficial ones; in Asia, that figure is 70% (Nielsen 2016a).
More than half of consumers say they’re avoiding artificial ingredients, hormones/antibiotics, genetically modified organisms (GMOs), bisphenol A (BPA), and artificial sweeteners (Nielsen 2016a).
Latin America and North America exceed the global average for avoiding sugar and sodium; North America is above average for MSG avoidance. Latin America and Africa/the Middle East are above average for avoiding carbohydrates, gluten, and saturated fats. Europeans are most likely to shun antibiotics and GMOs (Nielsen 2016a).
Global clean label food/beverage sales reached $165 billion in 2016. Sales in the United States are nearly triple that of the other top 10 clean label regions—the United Kingdom, China, Germany, Australia, Italy, France, Japan, Canada, Mexico, and the Netherlands in descending order. Nothing artificial is the top global clean label driver (Hudson 2017).
The global organic food/beverage market is projected to reach $320 billion by 2025. Organic’s dual categorization with non-GMO is expected to drive demand. Sales of organic coffee/tea are projected to grow at 15% annually through 2025; sales of meat/poultry and beer/wine are each expected to climb by 13.5% (Grand View 2017).
In 2016, 55% of global consumers said they tried to avoid GMOs. Western Europe is the only region where GMOs are among the top five ingredients avoided (Nielsen 2016a). Global sales of GMO-free foods/drinks topped $17 billion in 2015 (Euromonitor 2016d).
BPA, heavy metal contamination, non-GMO animal feed, and food waste are projected to be among the next wave of global consumer concerns (Mintel 2017a).
In the United Kingdom, 13% of consumers seek fair trade foods/beverages; 4,500 fair trade foods/beverages are marketed in 74 countries (Euromonitor 2016e).
More than one-third (36%) of global consumers self-report a food allergy or intolerance; only 45% feel their needs are being fully met by products currently available. Dairy, lactose, and shellfish allergies are the most common, each cited by 12% of global consumers (Nielsen 2016a).
For the year ended June 11, 2016, volume sales of dairy-free foods grew 21.9% in the United Kingdom; sales of gluten-free and wheat-free products grew by 30.3% and 6.1%, respectively. In Germany, volume sales of gluten-free grew by 34% (Nielsen 2016a). The gluten-free bread market, with sales of $1 billion in 2015, accounted for 31% of the global gluten-free market (Euromonitor 2016f).
Asian consumers are the most likely to follow a vegetarian diet (19% versus 14% overall) (Nielsen 2016a). New foods/drinks carrying a vegetarian claim increased 11% worldwide from 2015 to 2016; vegan claims increased by 4% (Mintel 2017a).
The global market for alternative dairy drinks is expected to reach $16.3 billion in 2018; China will enjoy annual sales growth of 18.7%. Half of nondairy launches were positioned as lactose-free, 40% as vegan, and just under a quarter as GMO-free. Meat substitute sales grew at an annual rate of 14% over the past five years (Innova 2017a).
After the United States, Germany is now the second-largest superfood/super grains market, accounting for 9% of all global super-labeled foods/beverages, followed by the United Kingdom and Australia (Mintel 2017a).
The United States and Japan lead in purchasing power for food/drinks with ethical labels that include the environment, followed by China, Brazil, the United Kingdom, Germany, Mexico, and Italy (Euromonitor 2016e).
The United Kingdom is the largest food-based animal welfare market with sales of $30.1 billion. Of note is the negligible penetration of animal welfare labels in China; the market there for such products is $132 million (Euromonitor 2017f).
Europe dominates the pasture-raised/grass-fed segment, accounting for 90% of the global $1 billion market. The Netherlands, Italy, and the United States are the largest markets (Euromonitor 2017f).
Not surprisingly, Rainforest Alliance claims have the highest appeal in Latin America. Eastern Europe, especially Poland, has the most dynamic growth for the charity/sponsorship segment (Euromonitor 2016e).
Conditionally Speaking
Sales of foods/beverages positioned as fortified/functional, naturally healthy, or organic, or positioned to address food intolerance/avoidance issues, are projected to grow at an annual rate of 5% through 2021; better-for-you foods (e.g., reduced sugar, caffeine, or fat) are expected to grow at a rate of 1% (Euromonitor 2017g).
With sales of $46 billion in 2016, infant formula remains the largest and fastest-growing category in the $437 billion global healthy packaged food sector, up 40% over the past five years. China accounts for 41% of sales. Toddler/follow-on fortified milks are the fastest-growing segment (Euromonitor 2017h).
Digestive health, brain health, DHA, immunity, vitamins/minerals, and eye health are the top claims on baby formula (Innova 2016b). Sales in the $58.6 billion baby food category are projected to grow 32% by 2020 (Euromonitor 2017h).
High-fiber breads and fortified breakfast cereals are the second- and third-largest global healthy categories; nondairy milk alternatives, probiotic yogurt, and functional flavored milk drinks are among the fastest-growing. Nuts, oats, olive oils, and functional spices (e.g., ginger or curcumin) are increasingly used as ingredients for naturally healthy foods (Euromonitor 2017h).
Just over one-third (36%) of global consumers rate foods that are high in fiber as very important; 32% rate foods that are high in protein that way; 30%, whole grain; 30%, fortified with calcium; 30%, vitamins; and 29%, minerals (Nielsen 2015).
Botanicals/bioactives, cultures, polysaccharides/oligosaccharides, protein, vitamins/minerals, acidulants, specialty fats/oils, and sweeteners are projected to be the fastest-growing natural/healthy food/beverage ingredients (Euromonitor 2016h).
Dietary supplements, vitamins, sports nutrition, supplement nutrition drinks/tonics, meal replacements, slimming formulas, probiotics/digestives, and herbal remedies are projected to be the fastest-growing global healthcare categories through 2020 (Euromonitor 2017i).
Powder formats to add nutrition to foods/drinks are also on the rise (e.g., Premelin’s Primeal Biomélin crushed flax and wheat supplement to add to yogurt or cereal) (Mintel 2017b).
Sports nutrition continues to mainstream as consumers around the globe embrace a healthy, fit lifestyle. Half of those aged 20–69 in China exercise for at least 30 minutes more than three times per week; 53% of those in the United States do so (Gallup 2016, GAS 2015).
The United Kingdom, Australia, Canada, Brazil, and Germany are the world’s largest sports nutrition markets. Mintel (2017a) reports an increase of 110% in pre-workout claims over the past five years and a 30% increase in post-workout claims. More than half of all sports nutrition bars released globally in the past year were promoted as high protein (Innova 2017b).
China, the United States, India, Mexico, and South Korea are the top protein supplement markets. Soups and ice cream are among the latest categories in Western European markets to emphasize high protein content. Sports nutrition sales are projected to grow 50% from 2016 to 2020, and sports drinks are expected to increase by 21% (Euromonitor 2017j).
The $114 billion global energy sector is projected to grow 20% by 2020; Australasia, North America, and Asia are the largest markets for energy products (Euromonitor 2017c). In Western Europe, sales of energy bars are projected to grow by 25% from 2015–2020 (Euromonitor 2017d).
Global dietary supplement sales reached $128 billion in 2017, + 6.1%; herbal/botanical product sales were $32 billion, +5.8% (NBJ 2017). Calcium, ginseng, protein, omega-3s, and probiotics are projected to be the top supplements in Asia Pacific through 2020; in Eastern Europe, it will be probiotics, calcium, sleep aids, laxatives, and omega-3s (Euromonitor 2016i).
Seven in 10 global consumers say they actively make dietary choices to help prevent health conditions (e.g., obesity, diabetes, high cholesterol, and hypertension) (Nielsen 2016a). Chronic disease is expected to account for 73% of deaths globally by 2020, up from 60% in 2001 (WHO 2016).
Maintaining mental sharpness and normal activity with age, followed by oral health, tiredness/lack of energy, back/neck pain, cancer, stress, eye health, lack of mental focus, and appearance/skin are the health concerns that Western Europeans are extremely/very concerned about (HealthFocus 2017).
With 422 million sufferers worldwide, diabetes is one of the fastest-growing global health issues. The prevalence of diabetes in Australasia is expected to jump 54% by 2030; in Eastern Europe, a 28% increase is projected, and in Western Europe, 18% (IDF 2016).
About 40% or 1.1 billion adults age 25-plus worldwide have high blood pressure, and 39% have high cholesterol levels. Africa has the highest incidence of hypertension; Western Europe is the highest for high cholesterol (WHO 2016).
More than 1.6 billion adults are overweight; 600 million are obese. Forty-one million children under age five and 228 million school-aged kids are overweight. Mexico, Chile, Venezuela, Australia, the United States, United Kingdom, Saudi Arabia, Columbia, Russia, Spain, and South Korea have the highest overweight prevalence (WHO 2016).
Russia has the highest incidence of self-reported digestive issues, with 37% affected, followed by the United States at 35%, and the five major European Union countries at 33%. China and Japan have a low incidence (16%) (Kantar 2016). Globally, probiotics, with 2016 sales of $4 billion, are projected to outpace all other supplements through 2021 (Hudson 2016).
High-fiber bread/breakfast cereals and probiotic yogurt are the top digestion-positioned packaged foods. China will drive probiotic yogurt sales, followed by Japan, Canada, and Vietnam (Hudson 2016).
Lactobacillus acidophilus is the top probiotic strain used in Europe, Latin America, and Asia Pacific; Bifidobacterium longum is used most often in the Middle East and Africa (Mintel 2016).
Canada, the United Kingdom, and the European Union have issued major reports on liver health, covering everything from nonalcoholic fatty liver disease to cirrhosis. The Eastern bloc countries have the highest alcohol consumption per capita along with Russia, France, Australia, and Ireland (WHO 2016).
Nighttime is a new time for health. In Mexico and Columbia, Kellogg’s All-Bran cereal has been repackaged with a lunar design that promotes the cereal as an evening meal to improve digestion and promote revitalization.
Forty percent of German adults and one in 10 Spaniards eat or drink yogurt after 11 p.m. Gatorade announced it is developing a nighttime yogurt snack featuring a formulation to help athletes recover while they sleep (Mintel 2017a).
A. Elizabeth Sloan, PhD, a professional member of IFT and contributing editor of Food Technology, is president, Sloan Trends Inc., Escondido, Calif. ([email protected]).


