
Top Ten Food Trends
Eating alone, home meals for millennials, a new definition of health, and a demand for true transparency are among the important consumer trends that represent new opportunities for the food industry.

Unprecedented changes in lifestyles and eating patterns, a greater demand for healthier fare and more ethical options, and consumers’ desire to know more about the foods they choose will cause dramatic changes in the way the food industry does business in the years ahead.
With 73% of consumers expecting their financial situation to deteriorate or remain unchanged in 2013, and nearly one-quarter still having difficulty affording weekly groceries (this includes 30% of millennial consumers—typically defined as those born in the 1980s and 1990s), conservative consumer food-buying behaviors will continue (IRI, 2013).
Last year, 72% of consumers cooked more at home than in 2011 (Harris, 2012). One in three meal preparers changed their cooking style last year to be more adventurous and to include more fruits/vegetables (Strailey, 2012).
Shoppers are cooking an average of five nights per week, eating out one night, and using take-out or ordering in for the other. Meat/poultry is included in 3.6 of these five home-prepared meals vs 4.1 in 2012, down for the first time in eight years; 1.4 of these meals are now meatless (FMI, 2013).
Many of last year’s best-selling foods/beverages catered to consumers’ rituals for home-based eating and entertaining as well as their on-the-go/take-from-home lifestyle (IRI, 2013). Despite teen deaths allegedly linked to energy drinks and concerns about their caffeine content, category sales were up 15.5% in units, making it the fastest-growing consumer packaged goods (CPG) food category in 2012 in food, drug, mass merchandiser, and convenience stores (FDMC), followed by weight control liquids/powders, +12.7%; and spirits/liquor, +12.6% (IRI, 2013; Figure 1.)
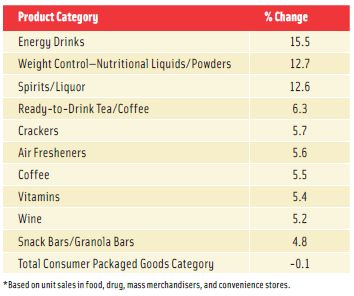 Among the top 10 largest food categories overall—which also includes energy drinks and wine—bottled water unit sales rose 4.7%, beer 4.5%, and natural cheese 2.8%; unit sales of salty snacks, carbonated beverages, fresh bread/rolls, milk, and chocolate candy were negative (IRI, 2013).
Although there were more than 61 billion restaurant visits in 2012, restaurant traffic counts have yet to recover to pre-recession levels (NPD, 2013a). Older adults continue to drive the restaurant business; those ages 55–64 are the highest per capita spenders (NRA, 2013). Over the last five years, baby boomers and seniors increased their restaurant visits by 6% while millennial visits fell by 6% (NPD, 2013b).
One in five adults (19.5%) or 44 million are “true foodies” characterized by their interest in trying new products, interest in upscale presentation, and more intensive attitudes/behaviors toward foreign, spicy, gourmet, natural/organic, and fresh foods (Packaged Facts, 2013a).
Two-thirds (66%) bought specialty foods last year, up 7% from 2011. Those ages 25–34 (73%) are the most frequent users followed by those ages 55–64 (69%); 62% of seniors bought gourmet foods, up 8% last year (NASFT, 2012a). Chocolate, oils, cheese, yogurt, and coffee were the most-purchased specialty food items; cheese and yogurt enjoyed the biggest gains in customers (NASFT, 2012b).
Snacking frequency continues to increase for all age groups. In 2012, 73% snacked in the mid-afternoon, up 5% from 2010; 39% snacked in the mid-morning, up 9% (Technomic, 2012a).
Lastly, the convenience channel outperformed other food channels by a wide margin last year. Unit sales of fresh eggs in drug stores rose 12% in 2012; natural cheese sales in drug stores were up 7% (IRI, 2013).
--- PAGE BREAK ---
1. A Repositioned Palate
The foodie movement has set new product and culinary criteria for even the most basic everyday eating experiences and has repositioned the American palate.
 Four in 10 adult eating occasions (41%) can now be described as “savoring,” a descriptor designed to convey a new upscale eating experience defined by freshness, distinctive flavors, foodie narratives, provenance, and more. Ten percent of dinner occasions, 7% of lunch occasions, 5% of breakfasts, and 5% of snacks fall into this more sophisticated culinary category (Hartman, 2011).
Rice, Chinese food, salads, eggs, beans, hamburgers, potatoes, vegetables, sweets, and meat cuts are the foods consumers would most like to see upgraded (Hartman, 2011). New foods/drinks carrying a restaurant or chef’s endorsement enjoy on average a 17% lift in year one sales. P.F. Chang’s Home Menu frozen dinners/appetizers were the topselling new product in 2011, with year one sales of $102 million (IRI, 2012a).
One in 10 shoppers trade up to higher-end cuts and leaner meats in an effort to mimic restaurant-style meals at home (FMI, 2013).
Since 2009, there has been a dramatic shift in consumer flavor preferences to more stimulating flavors. While grilled remains the most preferred flavor, cited by 90% of those polled, in 2011 73% cited fruity as their second-most-favorite flavor, up from up 45% in 2009, and putting it just ahead of sweet, cited by 72%, and spicy noted by 65%. Two-thirds of consumers now say they really enjoy tangy, 54% smoky, 52% salty, 51% herbal, 31% sour, and 11% bitter—all nearly double the figures from three years ago (Technomic, 2011a).
Adventuresome diners/restaurant foodies are significantly more likely to choose menu items with bitter, sour, and umami flavors; millennials are most likely to enjoy these flavors (Culinary Visions, 2012).
Preparation style is the No. 1 way consumers would like flavor added to their foods (Technomic, 2011a). American Culinary Federation (ACF) chefs ranked fermenting, pickling, sous vide, liquid nitrogen chilling, smoking, braising, oil-poaching, and grilling as trendy preparation techniques for 2013 (NRA, 2012).
Over the past five years, sea salt was the fastest-growing spice on menus, followed by fennel, cumin, cayenne, thyme, cilantro, black pepper, and sage (Moore, 2012). Specialty salts, flavored vinegars, agave, specialty oils (e.g., truffle), and aged meats (e.g., prosciutto) are among the hot ingredients for 2013 (NRA, 2012).
Eight in 10 meal preparers (82%) marinate meats/poultry on a regular basis; 55% use a store bought product, 38% make their own mix (FMI, 2013).
Spicy/hot flavors are the most preferred flavors/types of sauces, marinades, or seasoning for 53% of meal preparers; sweet flavors are cited by 46% of consumers, ethnic 44%, unique/new ingredient pairings 28%, salty 23%, and sour flavors 22% (Mintel, 2011a).
Authentic American regional sauces are of great interest to 49%; state, local, regional, or restaurant brands are of interest to 30%, and gourmet artisanal sauces appeal to 24% (Mintel, 2011a). Among regional cuisines, consumers are most interested in Chicago followed by Tex-Mex, New England, Southern, Mid-Atlantic, low country/Texas, cuisine from North Carolina, Kansas City barbecue, Southwestern, Creole/Cajun, Californian, Pacific Northwestern,and Hawaiian (Mintel, 2012a).
 Lastly, 36% of consumers now entertain family and friends at home instead of going out. Twenty-seven percent feel gourmet snacks are worth paying extra for; 43% buy treats for at-home consumption rather than going out (Wyatt, 2013). One-third of consumers buy gourmet foods when entertaining; 29% use take-out or prepared foods (NASFT, 2012a).
At $28 billion, consumer catering is a huge untapped opportunity. Restaurants currently represent quadruple the revenue of retailers in this sector ($19 billion vs $4 billion). One in three adults orders a party platter each month, representing $22 billion in retail sales (Technomic, 2012b).
2. Redefining Health
Consumers have taken a more holistic approach to defining healthy foods. For food marketers, creating a healthy halo now requires delivering against a combination of important elements—freshness, positive add-ins, avoidance of undesirable substances, high-quality ingredients, an aura of natural, real, or close to the farm, as well as, when appropriate, some ethical, sustainable, and humane criteria (Technomic, 2012c).
Fresh is a healthy eating strategy for 60% of consumers (FMI, 2012). Nine in 10 (87%) think fresh foods are healthier; 80% look for fresh descriptors at retail, 58% in restaurants (Technomic, 2012c).
--- PAGE BREAK ---
Three-quarters of adults (74%) believe that “home-made” or “house-made” foods/drinks are healthier; 72% associate sameday preparation with healthfulness; 61% believe foods labeled “real” are healthful, 58% believe that of products labeled “made from scratch,” and 60% think it is true for food described as “never frozen” (Technomic, 2012c).
Health also appears to be strongly related to quality. Four in 10 consumers (43%) think that products labeled “premium” are more healthful; 38% think that of products with the descriptor “artisan,” 37% “authentic,” and 33% “seasonal” (Technomic, 2012c).
Including a serving of vegetables/fruit and “100% whole wheat” or “high fiber” claims clearly conveys a health message for nine in 10 consumers; high protein conveys that to 77% of consumers (Technomic, 2012c).
Steaming, baking, grilling, and broiling and cooking methods with fiery or smoky elements (e.g., fire-roasted and wood-fired) signal healthy preparation to consumers (Technomic, 2012c). Overall, descriptors that focus on positive health connotations, such as “nutritious,” “healthy,” or “heart healthy” tend to be more appealing than “light” or “guiltless” (Technomic, 2012c).
 Among natural and organic claims, consumers rank those that emphasize a lack of additives, such as “preservative-free,” “no artificial sweeteners,” and “unprocessed,” above the umbrella term “natural” for healthfulness. At restaurants, one-quarter verify an item’s natural positioning via claims (e.g., “no artificial sweeteners,” “natural,” and “unprocessed”); twice as many consumers look for these claims at retail (Technomic, 2012c).
In 2012, 53% of consumers tried to limit salt/sodium, 51% sugar, 49% trans fats or calories, 47% saturated fats, and 44% high fructose corn syrup (IFIC, 2012).
When it comes to sustainability and social responsibility, call-outs that highlight the welfare of animals such as “farm-raised,” “grass-fed,” and “free-range” or “cage-free” are perceived as conveying healthfulness. Consumers feel these animals have been raised in a more natural environment and were fed a more natural diet (Technomic, 2012c).
Nearly half of consumers (47%) say food described as “local” is healthier; 37% think sustainably sourced products are more healthful, and one-quarter believe that of fair-trade food (Technomic, 2012c).
3. Generational Cooking
With millennials cutting back on restaurant visits for the fifth year in a row, developing home meal products that appeal to this new generation of cooks is a very big idea (NPD, 2013b).
Not surprisingly with limited cooking skills, millennials are the most likely to use no-cook meal preparations and are the most frequent consumers of pre-cooked fresh retail meals and frozen dinners (Packaged Facts, 2012a).
Although millennials have a higher tendency to use a wider variety of cooking methods (55% vs 45% overall), they are second to those age 65+ (58% vs 48% overall) for use of the microwave oven (Mintel, 2012b, Figure 2).
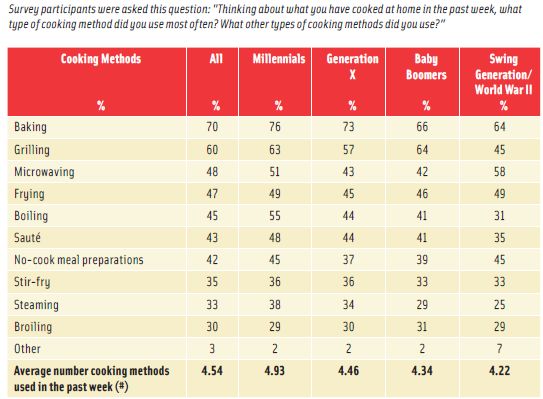 Along with Gen Xers, millennials are the most likely to bake in the oven and stir-fry; with boomers they’re the most likely to grill. Millennials are significantly more likely than their older counterparts to boil, sauté, or steam (Mintel, 2012b).
While making dinner primarily from fresh foods is very important to 44% of meal preparers, up 6% over the past two years; fresh is particularly important to younger cooks (MSI, 2011a). On average, 52% of meal preparers made last night’s dinner at home from scratch vs 47% of millennials; 22% did so with pre-packaged foods requiring preparation vs 27% of millennials; 10% made dinner at home with frozen/heat-and-serve packaged foods vs 12% of millennials; and 9% used packaged take-out vs 8% of millennials (MSI, 2011a).
Younger cooks are more inclined to prepare meals using helpers and have a lower preference for complete kits (Hartman, 2008). More than one-quarter of adults ages 18–34 use cooking/simmer sauces that they add to fresh meat, fish, or vegetables; this is a significantly higher percentage than their older counterparts (Mintel, 2011a).
--- PAGE BREAK ---
When compared to five years ago, among all cooks, under-20-minute meals are on the rise, up 11%; crock-pot/slow cooker meals are up 11%; one-pot meals, +10%; pastas/casseroles, +9%; international meals, +7%; and meal salads, +6%. Frying fell 30%; roasts, -10%; outdoor grilling, -7%. Making ethnic meals increased 15% for those ages 18–25, 20-minute meals, +18% (FMI, 2013).
Seven in 10 shoppers (72%) cook chicken one to three times per week; beef is prepared that often by 65%; pork 48%; fish 44%; turkey 24%; lamb 10%; and soy 11%. Pork and soy-based products (e.g., veggie burgers) saw slight gains this year (FMI, 2013).
One-third of shoppers changed their meat purchases in 2012, 91% for less expensive cuts. Ground beef with a higher fat content and chicken legs/thighs/dark meat are now bought more frequently (FMI, 2013).
Convenience meats are performing well; 42% of consumers use heat-and-eat meats at least once a week, up 4% vs 2012; 39% use ready-to-eat meat, +6% vs 2010 (FMI, 2013).
One in five meal preparers (19%) would eat more fish if stores offered it pre-cooked, ready-to-eat (Packaged Facts, 2011a). Shrimp, canned tuna, salmon, pollock, tilapia, pangasius, catfish, crab, cod, and clams were the most-consumed fish in 2011 (NFI, 2012).
In a typical week last year, 79% of meal preparers served potatoes, 75% meat, 71% pasta, 63% ethnic, 58% rice, 51% pasta/noodles, 51% poultry, 42 vegetable sides, 40% casseroles, 40% pizza, 33% salad, and 15% dessert at dinnertime (MSI, 2011a).
 Heat-and-eat entrees, combination dishes, warm sides, salads, side dish breads, and easy meals are projected to be among the fastest-growing food categories through 2018 (NPD, 2011).
4. Eating Alone
A dramatic increase in the number of adults eating alone—regardless of their family dynamics—and the diversity of venues from which consumers now source their meals, snacks, and drinks represent two of the largest untapped opportunities in the industry today.
In 2011, 44% of all adult eating occasions were alone. Most important, one-third of these alone eatings involved more culinarily sophisticated fare. Nearly two-thirds of solo eatings took place at home, 8% in a restaurant (Hartman, 2011).
When eating dinner alone, Hartman (2011) observed that adults were more likely to choose fresh/refrigerated meals over frozen dinners, creating an unprecedented opportunity for fresh prepared and/or chilled retail meals.
In 2011, prepared refrigerated entrees were the seventh-fastestgrowing CPG food item in FDMC (IRI, 2012b). The number of shoppers buying fresh/chilled prepared meals rose 7% in 2012 (FMI, 2013). Young adults ages 18–24 are the most likely to buy chilled meals, up 11% vs 2010 (Technomic, 2012d).
With empty nesters the largest U.S. household unit, and singles No. 2, it’s not surprising that the “family meal” is fast eroding. Nearly, three-quarters (72%) of adult family eating occasions involve only adult household members; only 28% include children (Hartman, 2011).
With children also eating alone or with their siblings more often, the timing is perfect for more convenient, healthier kid-focused meals. In 2012, one in five parents purchased a fresh/refrigerated meal for a child under age 12; one in 10 for a teenager (Technomic, 2012d).
Immediate consumption is another fast-emerging meal and snack behavior. One in 10 adult eating occasions involve food eaten within one hour of purchase; more than half of these foods were sourced from a supermarket (Hartman, 2011).
In 2012, 69% ate the snack they purchased “right away,” up from 46% in 2010 (Technomic, 2012a). Snacks, with sales volume up 23%, followed by breakfast 16%, pizza 12%, sushi 11%, dips/spreads 7%, desserts 6%, and sides 5% were the fastest-growing items in the fresh prepared deli for the year ended 3/21/12 (Major, 2012).
Today’s progressive breakfast behaviors, where consumers eat something at home, stop at a coffee shop/drive-through, and then snack mid-morning are another increasingly common consumer behavior that marketers have not adequately exploited. One in five bring breakfast from home; one in 10 children bring it to school. One in 10 adults eats breakfast in the car (MSI, 2010).
In 2012, 57% of consumers bought a prepared meal at a convenience store (Technomic, 2012d). In 2011, with sales of $26.7 billion, foodservice outpaced all other convenience-store category sales gains; prepared food sales rose 10.6% per store (CSN, 2012).
Lunch (38%) and breakfast (21%) are the largest prepared food dayparts in convenience stores; dinner accounts for 15%; each snack daypart about 7–8% (CSN, 2012).
Fresh bakery, pizza, sandwich/wraps, and hot dog/roller grill products are the top prepared items, bought by nearly half of convenience store visitors in 2012 (Packaged Facts, 2012a).
One-third of the U.S. population (31%) purchased prepared foods from a drug store last year (Technomic, 2012d). Six of the top 10 best-selling products in drug stores were foods/drinks last year; two were refrigerated (Mitchell, 2012).
--- PAGE BREAK ---
5. Seeking True Transparency
“Horse-Gate,” pink slime, gestation pork crates, and cutbacks in the number of U.S. Dept. of Agriculture (USDA) meat inspectors are all contributing factors in the current unprecedented demand for transparency in food production/marketing (Anon., 2013). Add to that list the highest Food and Drug Administration–documented food recall activity in the past two years and a fast-emerging desire to align food purchases with personal values.
More than eight in 10 adults have given some thought to food safety in the past year. While 17% have stopped buying a food/brand due to safety concerns, worries over bacteria have impacted choices for 51%, chemicals in food influenced 51%, imported food 49%, pesticides 47%, animal antibiotics 30%, and undeclared allergens 25% (IFIC, 2012).
Over one-quarter (27%) of shoppers think antibiotics/hormones in meat are a “serious health hazard” (FMI, 2011). A steroid-free or hormone-free tag would have a major impact on six in 10 shoppers’ meat purchases (FMI, 2013).
Nearly three-quarters (72%) of consumers say humane treatment is important when shopping for foods (MSI, 2011b). About one in three (35%) look for “cage-free” labels at retail, 29% seek out “grass-fed” (Technomic, 2012c).
McDonald’s, Arby’s, Wendy’s, and Burger King have advertised that they’ve dropped suppliers using sow crates. Whole Foods’ recent decision to label all genetically modified foods (GMOs) by 2018 will surely accelerate the GMO issue. In 2012, 17% of mainstream food shoppers were concerned about GMOs (FMI, 2013).
According to Sloan Trends’ TrendSense™ model, GMOs are currently far from a mainstream issue. However, the timing is perfect for marketing GMO-verified in specialty/health-food channels and among very health-conscious shoppers (Sloan, 2013a). A recent national bill requiring GMO labeling is pending in Congress; 13 states had legislative activity that relates to GMOs as of March 2013.
Concerns over GMOs will help fuel sales of certified organic foods/drinks as they may not be genetically modified, per USDA organic standards.
In 2012, 64% of shoppers looked for products labeled “no artificial sweeteners” at retail, 56% “unprocessed,” 52% “preservative-free,” and 28% “no MSG”
(Technomic, 2012c; FMI 2013). One-quarter of consumers look for fair trade descriptors at retail; 52% bought fair trade coffee/tea; 36% fair trade chocolate last year (MSI, 2011c).
With lack of trust in the food system growing, it’s not surprising that third party certification programs for everything from fair trade to the Glycemic Index to GMO-verified has become a consumer necessity.
Calorie/menu labeling is another important form of transparency. One in three consumers checks the Internet for nutrition information before they go to a restaurant (NRA, 2013). Four in 10 consumers under age 35 who visited a restaurant with posted calorie counts said the information had a great impact on their ordering decision; 22% of those ages 35+ reported a great impact on the order decision (Technomic, 2012c).
Touting grown/raised in the United States or Canada is a very big idea, important to 91% of adults. Only 63% are very/somewhat comfortable with foods sourced from Latin/South America or Western Europe; less than one-third have that comfort level with products from India, China, Southeast Asia, Africa, and the Middle East (FMI, 2011).
6. Global Look-Alikes
 Although more than one-third (37%) of consumers are even more interested in trying ethnic flavors/foods than they were two years ago, when it comes to marketing foreign foods, it’s really no longer about the cuisine (Technomic, 2011a).
More and more, success lies in the ability to identify the ethnic cuisine’s specific food items, flavors, and ingredients that will best integrate into and emulate favorite American foods and forms.
Fox example, Indian naan is well poised to become a fast food sandwich/burger carrier; Mexican griddle sandwiches/tortas and pressed Cubano sandwiches may soon upstage paninis.
Latin American aqua fresca and Thai-style iced tea are overdue to become trendy signature drinks.
Korean barbecue beef and fried chicken; Vietnamese oho and miso soup; Korean bibimbap; black, forbidden, red, and sushi rice; German/Austrian spaetzle; and Indian samosas, pakoras, and curries also have high mainstream ethnic potential.
--- PAGE BREAK ---
Cultural cheeses (e.g., queso fresco, paneer, lebneh, and halloumi) are fast gaining in popularity as are ethnic flours (e.g., fufu, teff,cassava, and yucca). Fondue is a hot culinary trend for 2013 (NRA, 2012).
In deli prepared food programs, crepes, Korean barbecue, empanadas, Vietnamese banh mi sandwiches, and pupusas are grabbing customer attention (IDDBA, 2013). Caprese was among the top gainers on sandwich menus last year (Datassential, 2013).
Sriracha, chimichurri, aioli, yuzu, queso fresco, habanero, Thai chili, bresaola, tzatziki sauce, pappardelle, manchego, churrasco, and olive tapenade are among the fastest-growing ethnic flavors on non-ethnic menus (Datassential, 2013).
Ethnic-inspired breakfast items (e.g., Asian-flavored syrups, chorizo sausage, and coconut milk pancakes) are the top culinary breakfast trends for 2013 (NRA, 2012). Flatbread, brioche French toast, chilaquiles, burritos, and huevos rancheros were among the fastest-growing restaurant breakfast items in 2012; breakfast pizzas are coming on strong. Focaccia and baguettes are among the top breads being used at breakfast (Datassential, 2013).
Panna cotta was the fastest-growing dessert on restaurant menus in 2012; custard and mousse were among the top 10 cakes (Datassential, 2013). Expect gelato, granita, French canelés, tiramisu, and Asian almond and Mexican cookies to get mainstream attention.
Lastly, as culinary sophistication rises, consumer perception of what is ethnic changes. Nearly three-quarters (73%) consider Japanese cuisine/sushi to be an everyday mainstream offering, well within consumers’ comfort zone of reduced risk (Technomic, 2012e).
Four in 10 ACF chefs (44%) cite children’s sushi as a hot trend for 2013; 35% cite sushi/sushi-style items, and 27% mention ceviche/seviche appetizers (NRA, 2012). Two-thirds (65%) say Cajun cuisine is now mainstream, 64% Greek, 63% French, 62% Thai, 59% Indian, and 55% Tex-Mex, Spanish, or German (Technomic, 2012e).
Caribbean, Creole, Cuban, Hawaiian, Korean, Mediterranean, Puerto Rican, Szechuan, and Vietnamese are among the second tier of emerging ethnic opportunities for more-adventuresome diners (Technomic, 2012e). Argentinian, Brazilian, Peruvian, Moroccan, Costa Rican, Turkish, and Columbian foods/flavors are still reserved for higher-end eateries (Technomic, 2012e). ACF chefs cite Peruvian, regional ethnic, ethnic fusion, Korean, and Southeast Asian as their top hot cuisines for 2013 (NRA, 2012).
7. Farmstead Formulations
Hyper-local sourcing (e.g., restaurant gardens), farm/estate brands, small-producer suppliers, and the mainstreaming of farmers’ markets, attest to consumers’ fascination—and growing appreciation for—all things “farm.”
Just over half of consumers looked for “local” descriptors at retail last year, 46% sought out “seasonal,” 40% farm-raised, and 28% “sustainable” (Technomic, 2012c). Locally sourced meats/seafood topped the overall list of ACF chefs’ hot culinary trends for 2013 (NRA, 2012).
The cut and the breed (e.g., Berkshire pork or Angus beef )—cited by more than two-thirds of consumers—are the top factors that define premium quality for pork/beef (Technomic, 2011b). Just over one-quarter (26%) of shoppers buy natural or organic meat, up 6% vs 2011 (FMI, 2013).
Lesser known and underutilized species are also capturing customer attention. Arctic char, branzino, barramundi, mackerel, bluefish, and redfish are among the hot entree trends for 2013 (NRA, 2012).
New cuts of meat created by savvy producers (e.g., Denver steak, pork flat iron, teres major) are other hot center-of-the-plate culinary trends for 2013 (NRA, 2012).
House-made/homemade is important to 38% of restaurant goers and 23% of consumers at retail (Technomic, 2012c). ACF chefs cited house-cured meats, house-made soft drinks/soda, lemonade, vinegars, and artisan ice cream as cutting-edge culinary ideas for 2013. Domino’s launched its Handmade Pan Pizza with “fresh never frozen” dough.
One in five consumers looks for artisan foods in restaurants, 14% do so at retail (Technomic, 2012c). Artisan/specialty bacon and cheese are among the top ingredient trends for 2013 (NRA, 2012).
Heirloom apples, beans, and tomatoes; hybrid fruits/vegetables (e.g., plumcot, grapple, broccoflower); unique varietals, (e.g.,purple, fingerling, baby Dutch yellow potatoes); micro-vegetables/ greens; and flower syrups/essences are among the hot produce trends for 2013 (NRA, 2012).
 Stokes Purple Sweet Potatoes, baby kiwi, and passion fruit are among the latest items being promoted by Frieda’s Specialty Produce. ACF cited rambutan, dragon fruit, paw paw, and guava as hot menu trends for 2013 (NRA, 2012).
Sweet potato fries, root vegetables, warm appetizer salads, vegetable chips, and vegetable ceviche are other up-and-coming culinary produce trends (NRA, 2012).
Ancient grains ranked fifth among the hot culinary ingredients for 2013; kamut, spelt, lentils, amaranth, and wild rice were also cited by ACF chefs (NRA, 2012). Bob’s Red Mill’s Grains of Discovery line includes farro, teff, millet, and chia.
Non-wheat flour including peanut, millet, barley, rice, pulse, and coconut flours are grabbing the attention of chefs and consumers (NRA, 2012). Closer-to-the-flame cooking techniques—wood-grilled, flamed, charred, fire-roasted—also resonate with the trend to rusticity and craftsmanship (Holley, 2013).
--- PAGE BREAK ---
8. Craveable Finger Foods
One in five of the best-selling new foods introduced last year was bite-sized or handheld; 45% of consumers want snacks that can be eaten on the go (IRI, 2012a; Wyatt, 2013). Most important, these mini-morsels are creating a new generation of craveable foods, and they’re as likely to be savory as sweet.
With one-third of adult snacking (33%) falling into the upscale culinary “savoring” category—and a new/unique flavor an important snack selection criteria for 40% of shoppers—the opportunity for more sophisticated handheld fare is unprecedented (Technomic, 2012a).
Refrigerated appetizers/snack rolls, up 4.9% in volume sales last year and frozen appetizer/snack rolls up 4.7% were among the fastest-growing snacks (Wyatt, 2013).
In 2012, 69% of consumers visited a fast food restaurant to buy a snack; per capita snack visits averaged 2.7 per month (Mintel, 2012c).
Sides were the most frequently ordered restaurant snack last year, chosen by 37%; appetizers were purchased by 28%; portable entrees 27%; salad 23%; bakery items 19%; dessert 18%; mini-versions of regular items or soup, each 14%; bagels/breads/fruit, each 11%; yogurt/parfaits 9%; and vegetables 5% (Mintel, 2012c). Those eating fries/onion rings as a snack away-from-home fell from 55% in 2010 to 39% in 2012; the percentage of those consuming foodservice pizza as a snack dropped from 49% to 36% (Technomic, 2012a).
McDonald’s has added Fish McBites to the menu. Pizza Hut has Pizza Sliders, Burger King offers Cini-Minis, and Wing Zone Skinny Dippers are un-breaded chicken strips.
Two-thirds (67%) of consumers find it “extremely appealing” to get their flavor through dips/condiments, up 8% vs 2009; 40% are willing to pay more for a dipping sauce they really want (Technomic, 2011a).
Garlic, sesame, Szechuan, ginger, chili, mango, and peanut sauce are high potential dipping sauces for Asian appetizers; chili con queso, pico de gallo, black bean, and refried beans for Mexican (Technomic, 2011a).
 Sliders remain the fastest-growing sandwiches in restaurants (Datassential, 2013). Bite-sized fancy, signature hors d’oeuvres are among the hot appetizer trends for 2013 (NRA, 2012).
Seven in 10 women (69%) and half of men (46%) are snacking on healthier items than they did in 2010, up 23% and 13%, respectively (Technomic, 2012a).
Frozen yogurt/tofu, hummus, light ice cream, natural string cheese, and nutritional snacks/trail mixes were the fastest-growing healthy snacks in 2012 (Wyatt, 2013). Mini cakes are the hot trend in in-store bakeries (IDDBA, 2013). Cupcakes, s’mores, donuts, and ice cream sandwiches were among the top-growing restaurant desserts in 2012 (Datassential, 2013).
Indulgent crackers, bakery snacks, and kernel popcorn are other fast-growing snacks (Wyatt, 2013). Crackers were the fifth-fastest-growing CPG category in FDMC in 2012 (IRI, 2013). Handheld items are also moving to the center-of-the-plate.
Specialty sandwiches, street-foodinspired main courses (e.g., tacos, satay, kabobs; tapas/meze, dim sum, and gourmet burgers) are among the trendy entrees attracting attention for 2013 (NRA, 2012).
Sweet/savory snack foods and sweet desserts are projected to be two of the fastest-growing food categories through 2018 (NPD, 2011).
9. Nutritional Insiders
In 2012, 78% of consumers made a strong effort to get more vitamins, 57% made a strong effort to consume more products with specialty nutritional ingredients, 45% herbs/botanicals, and 42% minerals (MSI, 2011c).
Forty-four percent of consumers are making a strong effort to get more vitamin D; for vitamin C, it is 40%; B vitamins and omega-3s 34%; antioxidants 26%; vitamin E 25%; and vitamin A 24%. Half of consumers made a strong effort to get more protein in 2012 (MSI, 2011c).
With nine in 10 Americans deficient in choline, this B vitamin–like nutrient has enormous food fortification potential, as does magnesium, which has enjoyed double-digit supplement sales growth for the past six years (Sloan, 2013b; NBJ, 2013).
Over half (55%) of consumers would like more clinical proof about the bioavailability of nutrients in fortified foods; bioavailability reached mass market status in 2007 (NMI, 2012; Sloan, 2013a).
 Prebiotics are projected to reach mass market status this year (Sloan, 2013a). In 2012, 31% of adults were aware of prebiotics; 13% made a strong effort to get more; 17% made a strong effort to get more probiotics (MSI, 2012a).
Monounsaturated fatty acids are another untapped mass market opportunity (Sloan, 2013a). Three-quarters (74%) are aware of the role of monounsaturated fatty acids in reducing the risk of heart disease (IFIC, 2012).
Anthocyanins and resveratrol have recently reached mass market status, joining polyphenols and flavonoids as the phytochemicals with the highest potential for use in fortifying mainstream foods/drinks (Sloan, 2013a).
--- PAGE BREAK ---
In 2012, 37% of shoppers said heart issues were very important in their food selections, followed by preventing cancer, which 32% considered very important; the need for more energy 29%; digestive health 29%; improving immunity 26%; building physical strength 25%; and bone density 27% (FMI, 2012).
Stroke, atherosclerosis, preventing blood plaque, and improving circulation are among the new mass market heart opportunities (Sloan, 2013b). More than one third of adults (37%) experienced a cardio issue in 2012 (MSI, 2012b).
Two-thirds of adults are very/somewhat concerned about their circulatory health (MSI, 2012c). Natural components that help increase circulation (e.g., cocoa flavanols) will be in high demand.
U.S. sales of weight management products including foods, beverages, meal replacements, and diet aids are projected to top $40 billion by 2016 (Packaged Facts, 2013b).
Muscle strength—now among the top 10 health concerns in the United States and Canada—is fast becoming an important food market (HealthFocus, 2011). Three-quarters of consumers think protein helps build muscle, 66% say it increases lean muscle mass, prevents muscle loss during aging, provides energy throughout the day, and stems hunger (DMI, 2012).
One-third of consumers would like more ingredients to help balance blood sugar (NMI, 2012). Long-term sustainable energy and weight control are the most marketable mainstream health linkages for blood sugar control, beyond diabetes (Sloan, 2013a).
Products to help people deal with diabetic risk factors (e.g., insulin resistance and metabolic syndrome) are other untapped opportunities. The Glycemic Index is perfectly positioned for marketing in the health/specialty food channel (Sloan, 2013b).
10. Mother Hens
There is no doubt that one of the most important issues of our time is the ailing health of our children. Yet in 2010, only 40% of the $10 billion U.S. kids’ food and beverage market involved better-for-you-foods (Packaged Facts, 2011b).
Moms are more likely than shoppers overall to buy nutritionally enhanced food/drinks (46% vs 39%) and to actively seek out nutritional information/guidelines (61% vs 56%). They are significantly more likely to buy products with a high fiber or calcium claim and about as likely as the overall population to buy low-/no-fat items (Packaged Facts, 2013b). Moms also are more likely to feel that food stores should do more to help their customers eat more healthily (57% vs 52%) (Packaged Facts, 2013b).
They are more likely to choose the organic version in fresh departments and the center store. This is most obvious in their choice of yogurt, meat/poultry, cheese, bread, and fresh produce. In the center aisles, they are 36% more likely to buy organic frozen foods; pasta (30% more likely); sauces and marinades (28% more likely); soups (26% more likely); chocolate (22% more likely); and breakfast cereal (17% more likely) (Packaged Facts, 2013b).
Moms are also more likely than food shoppers overall to agree that food safety/contamination is a major concern when buying fresh meat/seafood (61% vs 56%) and to oppose the use of artificial growth hormones or GMO foods (63% vs 58%) (Packaged Facts, 2013b).
And their demand for healthier kids’ foods away from home is no exception. ACF chefs and fast food operators both rank healthy kids meals asthe third-most-important trend for 2013 (NRA, 2012, 2013).
Whole-grain items in kids’ meals, fruit/vegetable children’s sides, kids’ entrée salads, and oven-baked items in kids’ meals (e.g., baked chicken fingers) and oven-baked fries are other top trends (NRA, 2012).
 McDonald’s has reduced the portion size of fries in its Happy Meals. Chick-fil-A has substituted un-breaded chicken nuggets in its kids’ meal. Darden has removed fries and soda from the children’s menus in its Olive Garden, Red Lobster, Bahama Breeze, and LongHorn Steakhouse restaurants.
Children’s portions of adult menu items, ethnic-inspired children’s dishes, gourmet kids meals, and children’s sushi are other hot culinary trends for 2013 (NRA, 2012).
The lack of healthier options at breakfast for children is one of the most significant criticisms of fast food restaurants in the early morning daypart (Technomic, 2012f).
--- PAGE BREAK ---
Lastly, it’s not all about kids. Smaller portions for a smaller price are among the hot center-of-the plate trends for restaurants in 2013 (NRA, 2012).
One in five consumers purchased foods labeled as vegetarian in 2012, up 4% vs 2010 (MSI, 2011c). Meatless/vegetarian entrees and appetizers were cited by ACF chefs as trendy for 2013; 56% of chefs mentioned vegan entrees and 35% meat alternatives (e.g., tofu, tempeh, seitan) (NRA, 2012).
 A. Elizabeth Sloan, a Professional Member of IFT and Contributing Editor of Food Technology, is President, Sloan Trends Inc., 2958 Sunset Hills, Suite 202, Escondido, CA 92025 ([email protected]).
References
Anon. 2013. Number of food, beverage recalls climbs. Food Business News. Feb. 26, p. 16.
CSN. 2012. Foodservice sales continue to climb. Convenience Store News 48(12): 94, 96, 98-101.
Culinary Visions. 2012. Channeling today’s food adventurist survey. July. Culinary Visions Panel, Chicago, Ill. www.culinaryvisions.org.
Datassential. 2013. Food and menu tends from Datassential. QSR magazine 176: Jan., 4-29.
DMI. 2012. Consumer protein survey. Dairy Management Inc., Rosemont, Ill. www.dairyinfo.com.
FMI. 2011. U.S. grocery shopper trends. Food Marketing Institute, Arlington, Va. www.fmi.org.
FMI. 2012. Shopping for health.
FMI. 2013. The power of meat.
Harris. 2012. Seven in 10 Americans cooking more instead of going out to save money. Press release, May 16. Harris Interactive, New York, N.Y. www.harrisinteractive.com.
Hartman. 2008. Reimagining convenience foods. The Hartman Group, Bellevue, Wash. www.hartman-group.com.
Hartman. 2011. How we eat. HeartbeatEXEC. Feb.
HealthFocus. 2011. U.S. consumer trends survey. HealthFocus International, St. Petersburg, Fla. www.healthfocus.com.
Holley, C. 2012. Flavor of fire. Top 10 trends. Flavor & The Menu, Jan. 28 – 36.
IDDBA. 2013. What’s in store? Dairy, Deli, Bakery Assn., Madison, Wis. www.iddba.org.
IFIC. 2012. 2012 food & health survey. International Food Information Council, Washington, D.C. www.ific.org.
IRI. 2012a. 2011 new product pacesetters. April. SymphonyIRI, Chicago, Ill. www.infores.com.
IRI. 2012b. CPG year in review. Times & Trends, Feb.
IRI. 2013. CPG year in review. Times & Trends, Feb.
Major, M. 2012. On the fast track. Progressive Grocer 91(6): 39-41.
Mintel. 2011a. Cooking sauces and marinades—U.S. April. Mintel International Group, Ltd., Chicago, Ill. www.mintel.com.
Mintel. 2012a. Dining out 2012: a look ahead—U.S. Jan.
Mintel. 2012b. Cooking Enthusiasts —U.S. Oct.
Mintel. 2012c. Trends in snacking and value menus in foodservice—U.S. June.
Mitchell, R. 2012.The 2012 perishables trends forecast. Perishables Buyer 2(1): 21-22, 24-25.
Moore. D. 2012. Restaurants’ hottest herbs and spices. Feb. 2. www.nrn.com.
MSI. 2010. The 2010 Gallup study of breakfast. Multi-sponsor Surveys, Princeton, N.J. www.multisponsor.com.
MSI. 2011a. The 2011 Gallup study of dinner.
MSI. 2011b. The 2011 Gallup study of nutrient knowledge & consumption.
MSI. 2012a. The 2012 Gallup study of probiotic & prebiotic consumers.
MSI. 2012b. The 2012 Gallup study of sports nutrition products.
MSI. 2012c. The 2012 study of circulatory health.
NASFT. 2012a. Specialty food consumers 2012. Oct. National Assn. for the Specialty Food Trade, New York, N.Y. www.nasft.org.
NASFT. 2012b. The state-of-the specialty food industry 2012. April.
NBJ. 2013. Nutritional data charts. Nutrition Business Journal. Jan. www.nutrition-business.com.
NFI. 2012. Top 10 consumer seafoods. National Fisheries Institute, McLean, Va. www.aboutseafood.com.
NMI. 2012. Health & Wellness database. Natural Marketing Institute, Harleysville, Pa. www.nmisolutions.com.
NPD. 2011. A look into the future of eating. May. NPD Group, Port Washington, N.Y. www.npd.com.
NPD. 2013a. Restaurant industry will need to focus on customer loyalty and value to grow in the new normal. Press release, Feb. 12.
NPD. 2013b. Boomers increase restaurant visits while millennials cut back. Press release, Jan. 15.
NRA. 2012. What’s hot chef’s survey. National Restaurant Assn., Washington, D.C. www.restaurant.org.
NRA. 2013. 2013 forecast.
Packaged Facts. 2011a. What’s for Dinner. March. Packaged Facts, Rockville, Md. www.packagedfacts.com.
Packaged Facts. 2011b. Kids food and beverage market in the U.S. May.
Packaged Facts. 2012a. How we eat. July.
Packaged Facts. 2012b. Moms as food shoppers.
Packaged Facts. 2013a. Experian/Packaged Facts Spring 2013 consumer survey.
Packaged Facts. 2013b. Weight management. March.
Sloan, A.E. 2013a. TrendSense™ report. Sloan Trends Inc. Escondido, Calif. www.sloantrend.com.
Sloan, A.E. 2013b. Muscle, circulation, blood sugar, choline: hot health markets for the decade ahead. Co-Presentation with Catherine Adams Hutt at Wellness 2013, Institute of Food Technologists, Rosemont, Ill., Feb. 27-28.
Strailey, J. 2012. Think different. Progressive Grocer 91(12): 33- 34.
Technomic. 2011a. The flavor consumer trend report. Technomic Inc., Chicago, Ill. www.technomic.com.
Technomic. 2011b. Center-of-the-plate: beef and pork consumer trend report.
Technomic. 2012a. The consumer trend snacking report.
Technomic. 2012b. Parties on premise report.
Technomic. 2012c. The consumer healthy eating trend report.
Technomic. 2012d. Retailer meal solutions consumer trend report.
Technomic. 2012e. The ethnic food & beverage consumer trend report.
Technomic. 2012f. The consumer breakfast trend report.
Wyatt, S. Lyons. 2013. The state of the snack industry, presented at SnaxPo, Snack Food Assn. Annual Meeting, Tampa, Fla., March 16-19.