
Electronic Tongue: A New Dimension in Sensory Analysis
Instrument complements use of the electronic nose for sensory analysis of food flavor by measuring nonvolatile flavor components
In recent years, instruments called “electronic noses” have been routinely used for odor control and aroma analysis in the food, beverage, chemical, and packaging industries. The electronic nose is an instrument designed to replicate the human olfactory system. It consists of an array of chemical sensors, each with a partial specificity to a wide range of odorant molecules, coupled with a suitable pattern recognition system (Bartlett et al., 1997; Anonymous, 2000).
Several qualitative and quantitative applications for this instrument, such as shelf-life studies, gold-standard comparisons, off-flavor detection, and acceptable variation monitoring, have been investigated (Alpha MOS, 1999, Giese, 1993, 2001; Madsen and Grypta, 2000; Arnold, 2000; Pichat et al., 2000; Strassburger, 1998; Bazzo et al., 1998; Braggins et al., 1999; Hansen et al., 1999.)
However, electronic nose instruments only measure chemical volatile components which constitute a sample’s odor. Human sensory perception encompasses more than just odor and aroma and includes taste, color, texture, mouthfeel, and even sound. As electronic noses are used more routinely, instrument suppliers have continued to provide improved solutions. Alpha MOS, Toulouse, France, last year launched an “electronic tongue” instrument for the analysis of taste and nonvolatile chemicals that are typically found in liquids. The objective of the electronic tongue is to complement the electronic nose and, more important, allow the food and beverage industry to cover a larger proportion of the sensory perception of consumers—in essence, covering both aroma/odor and taste.
For taste, the five most important sensations are sweetness, bitterness, saltiness, sourness, and savory (umami). Another sensation is trigeminal, sensed via our pain receptors; e.g., the effect of carbon dioxide in beer and carbonated soft drinks. The electronic tongue is unaffected by carbon dioxide. For orange juice and apple juice, the electronic tongue will more typically measure the nonvolatile components, including chemical molecules responsible for sweetness, bitterness, saltiness, and sourness.
Tongue vs Nose
Electronic nose and tongue instruments measure different aspects of the sensory perception of consumers. The electronic nose measures volatile components of aroma/odor in headspace, and the electronic tongue measures nonvolatile components that remain in the food or beverage.
Electronic nose sensors only detect the chemical species present in the headspace generated by the heating of the samples. The response R obtained can be formulated as follows: R = f[SG, H(P)], where SG corresponds to the gas sensor sensitivity and selectivity, and H(P) corresponds to the sample headspace generated. In these applications, sensory attributes such as floral, estery, hoppy, acetaldehyde, moldy, and many others are measured. These attributes are typically very different for each application.
Electronic tongue sensors detect all chemical species present in the liquid samples. Only some of these species can be observed with the sample headspace generated, i.e., the high-vapor-pressure species. The response R obtained with the electronic tongue can be formulated as follows: R = f(SL, P), where SL corresponds to the liquid sensor sensitivity and selectivity and P corresponds to the liquid sample. The electronic tongue seeks to measure attributes such as salty, sweet, bitter, sour, and savoriness. In general, unlike the electronic nose attribute measures, these attributes are fairly similar for each application area.
The two instruments are complementary for most applications.
--- PAGE BREAK ---
Electronic Tongue in Detail
The Alpha MOS electronic tongue, called the Astree, is composed of a 16-position autosampler, an array of liquid sensors, and an advanced chemometric software package (Alpha MOS, 2001a, b, c). The autosampler allows 15 samples to be evaluated automatically once the sample has been prepared. Preparation of samples typically involves filling the 100-mL beakers to three-fourths full. No other sample preparation is required. One beaker position is reserved for cleaning the sensor array following analysis of each individual sample. The autosampler also includes fluidic pumps for cleaning out the beaker for sensor rinsing when needed. The instrument also has an option of sample temperature control to ensure analytical reproducibility of measurements. Cooling to 2–4°C also ensures that there is limited sample change during the analysis cycle.
The detectors consist of an array of seven different liquid cross-sensitive sensors (ZZ36, BB06, CA07, BA07, AB07, HA06, CB07). These detectors are selected depending on the type of application, since sensitivity and selectivity are important for obtaining instrumental correlation. Up to 25 different sensors are commercially available. The sensors are made from silicon transistors with a organic coating that governs sensitivity and selectivity of each individual sensor. The proprietary coatings have been developed to ensure good repeatability, sensitivity, and selectivity. The measurement consists of a potentiometric difference between each individually coated sensor and the Ag/AgCl reference electrode.
The chemometric package consists of various pattern-recognition analysis modules for evaluating the data recorded from the array of liquid sensors. The modules include principal component analysis (PCA), discrimination function analysis (DFA), soft independent model class analogy (SIMCA), and partial least squares (PLS).
The different pattern-recognition modules are used to obtain instrumental correlation to sensory tests that are carried out. Depending on the objectives of the analysis, different modules are utilized. For example, PLS is used for quantitative analysis, where the objective is to quantify a particular molecule or attribute. An example is the quantification of bitterness of beer. This attribute is more widely known as BU (for bitterness units). For a qualitative application, SIMCA can be used for comparison to ensure good similarity of a new product to a gold standard. The modules for the electronic tongue are the same and/or very similar to those used for the electronic nose.
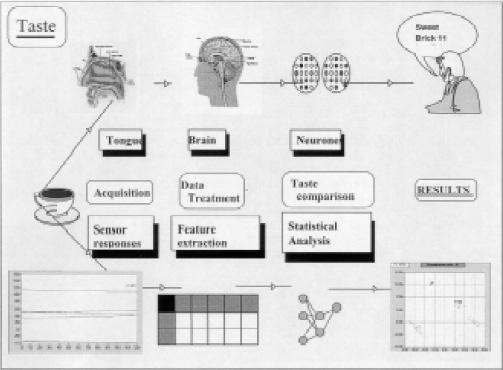
Fig. 1 shows the electronic tongue, which includes the sensors and associated interface electronics, pattern-recognition software, instrument control on a PC, and the 16-position autosampler. Fig. 2 shows how the electronic tongue, like a human being, needs to be trained with a correctly selected sample set to ensure good recognition and reproducibility. The electronic tongue procedure is exactly the same as the electronic nose procedure for training, model building, and validation (Alpha MOS, 1998, 2000; Madsen and Grypta, 2000; Bazzo et al., 1998). 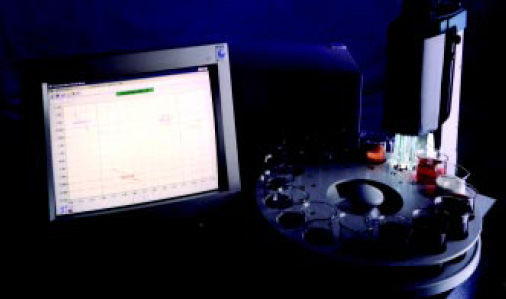
 The typical analysis time using the electronic tongue is about 3 min from when the sensors are introduced into the beaker containing the sample. This is followed by a wash cycle to ensure that there is no carryover of sample to the next analysis and also to ensure good reproducibility. Typically, up to five replicate measurements are made for each sample (beaker). Total analysis and sensor cleaning time is 5 min.
--- PAGE BREAK ---
Applications
Like the electronic nose, the electronic tongue can be used for several purposes, including sample analysis, quality control, and product matching (Madsen and Grypta, 2000).
• Taste Compounds. The fingerprint—or the raw sensor responses (at equilibrium)—of the electronic tongue is shown in Fig. 3. It shows the sensor response for five different compounds—sucrose, caffeine, salt (NaCl), sour (HCl), and umami (MSG). The concentration of the compounds was the same at around 10–2 molar. The results show the sensitivity and selectivity of two different coated sensors to the five compounds. The combination of pattern recognition and these “unique fingerprints” allow instrumental and sensory correlation to be obtained. 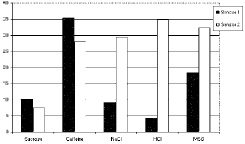
• Beer Batch Variation. The monitoring of finished products is extremely important today when quality expectations of typical consumers have resulted in more choices in the marketplace. In the brewing industry, the electronic tongue can be used to monitor batch-to-batch variation of the beers following the brewing process. First, a training step is carried out where the electronic tongue is used to analyze acceptable variations of different batches of beer. This step basically defines the acceptable range of finished beer as defined by management, consumers, and/or quality control/quality assurance production personal.
Fig. 4 shows a PCA map of five batches of two different type of beers. The x-axis separates the two types of beers, and the y-axis shows differences between the different batches. 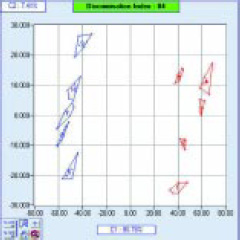
• Off-Flavor in Beer. The electronic tongue has also been used to detect off-flavor in beer, as in a pale ale lager containing too high a concentration of dimethyl sulfide (DMS). This chemical may have been formed from a malt-derived precursor during wort production or by contaminant bacteria during fermentation.
Typical concentration in beer is 0.01–0.25 mg/L. Fig. 5 shows results obtained using SIMCA on the electronic tongue when measuring beers containing a higher level of DMS. The samples outside the rectangular box have been correctly detected to have a high level of DMS. Samples within the box are considered acceptable variations of good beer containing the usual amount of DMS and other flavor and taste compounds. 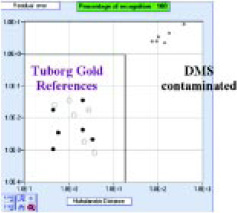
• Bitterness in Beer. An extremely important taste attribute of beer is its bitterness. Typical American-style beers have low bitterness characteristics, on the order of 6–8 BU, unlike European beers, which are typically more bitter in character and in general contain more flavors. The industry uses an internationally accepted method to measure bitterness—the BU is calculated from spectrophotometric analysis of isooctane at 275 nm. Using this reference method, the BU of different beers with modified BU were analyzed. The bitterness of the beers was varied by adding iso-α-acids from hop extract, compounds responsible for taste bitterness. A range of beers with 12–42 BU were prepared and then analyzed using the electronic tongue. Each beer was analyzed, with five replicates. Fig. 6 shows the good linearity of quantification of BU using PLS. The r2 value was better than 0.99, where there was no sample preparation and no decarbonation. 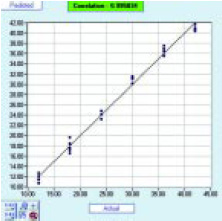
--- PAGE BREAK ---
• Quality of High-Fructose Corn Syrup. The quality of HFCS as a raw material for carbonated soft drinks is extremely important. Essentially, it should contain no flavor or taste that can modify the finished products. Some taint compounds responsible for these off-flavors have already been identified. They are sometimes due to the process and/or occasionally due to unwanted bacteria during fermentation. For example, fish taste/flavor is formed by microbiological oxidation of protein residue not removed by ion exchange in the filtration step. Other taste/odor descriptors include fruity, astringent, SO2, salty, corn-caramel, and moldy. Fig. 7 shows a SIMCA map of a gold-standard HFCS, with tainted products lying outside the rectangular box. The training step involves measurement of acceptable variations that define the area within the box.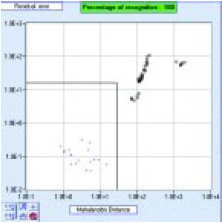
• Apple Juice Quality. Apple juice quality is easily measured by both instruments and humans. Bleibaum et al. (2001) tested a series of nine 100% apple juices, including a three-apple blend, vitamin-C fortified apple/pear juice, and an apple cider. All but one of the products were from one brand of apple juice (Tree Top). One of the samples was altered to analyze increases in sweetness (sucrose) and sourness (citric acid). The additional product was from a competitive manufacturer (Mott’s). This product array was selected to stretch the range of differences typically found among products produced within one production facility, and to determine how these products were perceived as different by the sensory panel, consumers, and the electronic nose and tongue instruments.
Fig. 8 shows an analysis where a relationship among sensory and instrumental measurements was made. The results indicate that certain electronic tongue sensors such as the ZZ36 and the CA07 are more correlated to the sweetness attribute and BA07 and AB07 are more correlated with apple flavor and fresh apple attribute. 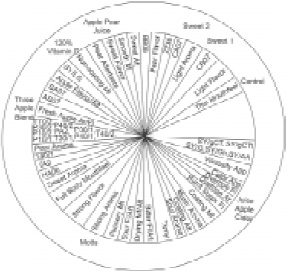
A New Dimension in QC
The electronic tongue and electronic nose can play a significant role in product development and quality assurance/quality control. The electronic tongue measurement of taste and nonvolatile components of food and beverages can be carried out easily to complement the headspace aroma/odor analyses of the electronic nose, thereby adding a new dimension to the instrumental correlation of human perception.
Based on a paper presented at the Annual Meeting of the Institute of Food Technologists, New Orleans, La., June 23–27, 2001.
The authors acknowledge Brigitte Clanchin and Emmanuelle Saint-Martin, Alpha MOS, for their contributions to the manuscript and analyses.
by Tsung Tan, Vincent Schmitt, and Sandrine Isz
The authors are Marketing Manager, Product Manager, and Project Manager, respectively, Alpha MOS, 20 Ave. Didier Daurat, 31400 Toulouse, France. Send reprint requests to author Tan.
Edited by James Giese
Internet Editor
References
Alpha MOS. 1998. Odor sensor technical note No. 1. Toulouse, France.
Alpha MOS. 2000. Fox2000/3000/4000 electronic nose advance user manual. Toulouse, France.
Alpha MOS. 2001a. Astree electronic tongue user manual. Toulouse, France.
Alpha MOS. 2001b. Astree sensor technical note. Toulouse, France.
Alpha MOS. 2001c. Special newsletter “Basell Interview.” Toulouse, France.
Alpha MOS. 1999. Customer interview of Basell GmBH, routine user of Alpha MOS System. Alpha MOS Newsletter, Oct. Toulouse, France.
Arnold, J. 2000. A nose for contamination. Food Qual., Sept./Oct., p. 46.
Bartlett, P.N., Elliott, J.M., and Gardner, J.W., 1997. Electronic noses and their application in the food industry. Food Technol. 51(12): 44-48.
Bazzo, S., Loubet, F., Tan, T.T., Hewitt-Jones, J.D., Engelen-Cornax, C.E.M., and Quadt, J.F.A 1998. Quality control of edible oil using an electronic nose. Seminars in Food Analysis (3): 15-25.
Bleibaum, R.N., Stone, H., Isz, S., Labreche, S., Saint-Martin, E., and Tan, T.T. 2001. Comparison of sensory and consumer results with electronic nose and tongue sensors for apple juices. Submitted for publication.
Braggins, T., Frost, D.A., Agnew, M..P., and Farouk, M.M. 1999. Evaluation of an electronic nose for use in the meat industry. In “Electronic Noses & Sensory Array Based Systems: Design and Applications,” ed. W.J. Hurst, pp. 51-82. Technomic Pub. Co . Inc, London.
Giese, J. 2001. Electronic tongues, noses, and much more. Food Technol. 55(5): 74-78.
Giese, J. 1993. On-line sensors for food processing. Food Technol. 47(5): 88, 90-95.
Grypta R., Madsen M., and Walter R. 2001. Correlating sensory analysis to the electronic nose on processed flavor. Presented at Pittcon 2001, New Orleans. March.
Hansen W.G., Wiedemann S.C.C., Van der Bol H., and Wortel V.A.L. 1999. Long-term odour discrimination of oleochemicals by an electronic nose. In “Electronic Noses & Sensory Array Based Systems: Design and Applications,” ed. W. J. Hurst, pp. 131-144. Technomic Pub. Co . Inc., London.
Madsen, M. and Grypta, R. 2000. Spices, flavor systems and the electronic nose. Food Technol. 54(3): 44- 46.
Pichat, L., Olivier, D., Koch, H., and Gygax, H.R. 2000, Creating sensory advantages. 7th Intl. Symp. on “Olfaction & Electronic Nose,” Brighton, England, July 20-24.
Strassburger, K.J. 1998. Electronic nose technology in the flavor industry: Moving from R&D to the production floor. Seminars in Food Analysis 3: 5-13.