
Reshaping Restaurant Strategies
From gardens and gourmet kids’ cuisine to lower-calorie and Latin fare, foodservice options continue to evolve to meet consumers’ ever-changing expectations.
Despite the less-than-perfect economic picture—rising gas prices, relatively high unemployment, spiraling commodity costs, and a drop in the number of households with incomes of more than $100,000—there is no shortage of opportunities or innovation in the $631.8 billion restaurant industry (NRA, 2012a). McDonald’s new Favorites Under 400 Calories menu, which includes 38 burgers, sandwiches, snacks, and beverages, has been quick to attract the attention of waist-watching consumers. Sonic’s nonalcoholic daily Happy Hour has been a super success, sizzling with 398,929 fountain drink and slush combinations. And Taco Bell hit pay dirt with its co-branded Doritos Locos Tacos line.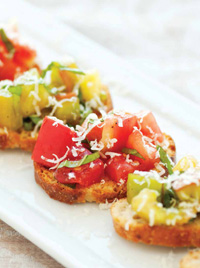
Three-quarters (76%) of U.S. adults bought food from a fast-food restaurant in January of this year, 58% made a purchase from a pizza place, 57% a casual dining establishment, 45% family dining, 38% fast casual, and 28% a fine dining restaurant. Moreover, with young adults under age 35 the most likely to have visited all forms of restaurants during that time, the future looks very good indeed for foodservice (Mintel, 2012a).
Small Signs of Recovery
Although U.S. restaurant traffic is showing modest gains—up 1% in the spring quarter ending May 2012 vs slight declines during the same period last year—NPD/CREST predicts that industry traffic will remain flat for 2012 and 2013 (NPD, 2012a).
Just over half (54%) of the 56% of Americans who describe themselves as “financially strained” have cut back on restaurant visits compared with 29% of those who consider themselves “comfortable.” While price/affordability are the top issues for the financially strained, diet/health concerns have caused cutbacks among comfortable consumers, offering yet another opportunity for growth (NPD, 2012b).
Fast-casual restaurants, famous for delivering fresh, made-to-order, higher quality, and often healthier fare, continue to lead industry growth, with traffic up 7% for the year ended June 2011 (NPD, 2012c). The top 150 casual chains grew sales 8.4% to $21.5 billion in 2011 (Technomic, 2012a).
The fast-food sector, which accounts for 78% of all industry traffic, grew 2% in the spring quarter of 2012 vs a year ago; visits to midscale/family dining restaurants fell 3%, and casual dining visits were down 2% (NPD, 2012a).
Drive-through traffic remained strong in 2011 with 12.4 billion visits, a 2% increase over 2010. Drive-through is the order method of choice at hamburger, Mexican, and chicken fast-food restaurants (NPD, 2012d).
Four in 10 consumers expected to use takeout or delivery from full-service restaurants less often this year; one in five expected to purchase less from fast-food/fast-casual eateries (Technomic, 2012a).
--- PAGE BREAK ---
The average restaurant patron’s check rose 2% in the spring quarter of 2012. Although still below the 3% inflation level for food consumed away from home, it was the strongest spending growth in more than two years (NPD, 2012a). Moreover, the restaurant industry showed its first increase in units for independents in nearly two years (NPD, 2012e).
At the same time, the competition is stiffening. Foodservice sales at convenience stores grew more than three times as fast as all in-store categories combined, reaching $25.6 billion, +7.5% in 2011. Six in 10 operators (57%) cite foodservice as their best growth potential. Those ages 18–24 and Hispanics are the heaviest convenience store foodservice users (Longo, 2012; Mintel, 2012b).
Big box stores such as Ikea, which offers organic crepes, Norwegian salmon, potato, and broccoli for $3.99, and Costco’s Snack Bar compete with more traditional foodservice establishments.
Customized, high tech vending options (e.g., Coca-Cola’s Freestyle, which offers more than 100 sparkling/still drink options and Jamba Juice’s JambaGo smoothie machines for schools) are other worrisome trends for foodservice operators (Anon., 2012).
One-third (35%) of consumers purchased prepared foods from a supermarket in November 2011 (Technomic, 2011a). Refrigerated entrees were the seventh-fastest-growing consumer packaged goods food category last year; 42% of consumers brought snacks/food from home to school/work to save money (IRI, 2011a, 2012a).
Chains and Menu Gains
McDonald’s, with U.S. sales of $34 billion in 2011, +5.5% over 2010, and international sales of $51.8 billion, +15.5%, remains America’s largest restaurant chain (Technomic, 2012b).
Rounding out the list of top 10 U.S. restaurant chains (based on 2011 sales) are Subway, with sales of $11.4 billion; Starbucks, $9.8 billion; Wendy’s, $8.5 billion; Burger King, $8.4 billion; Taco Bell, $6.8 billion; Dunkin’ Donuts, $5.9 billion; Pizza Hut, $5.4 billion; KFC, $4.5 billion; and Applebee’s, $4.4 billion. Wendy’s moved ahead of Burger King into fourth place last year (Technomic, 2012b).
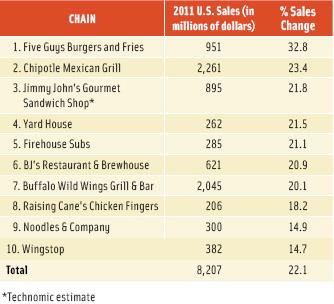 Five Guys Burgers and Fries was the fastest-growing restaurant chain in 2011, with sales up 33% (Figure 1).
--- PAGE BREAK ---
Coffee and tea, “other sandwich,” Mexican, and Asian noodle were the fastest-growing types of limited-service restaurants (LSRs) by menu category in 2011. Starbucks’ sales rose 7.5%, Subway sales also climbed by 7.5%, and Chipotle Mexican Grill sales were up an impressive 23.4%; bakery chains grew 7.1%, led by Panera Bread, with sales up 10% in 2011 (Technomic, 2012b).
Seafood and steak, with sales up 5.2% and 5.1%, respectively, were the fastest-growing full-service restaurants by menu categories. Red Lobster led sales growth in the seafood sector, up 6.2%; LongHorn Steakhouse and the Texas Roadhouse rose 13.0% and 9.2%, respectively, (Technomic, 2012b).
Food quality ousted cleanliness as the most important attribute across LSRs, casual, and family restaurants. The “crave-ability” of menu items gained in importance among consumers, with 53% of diners in LSRs and 55% of family sector diners saying it had a major influence on restaurant selection (Allen, 2012).
The need to further customize menu options is among the reasons for the decline in “combo” meal purchases, which are down by more than one billion orders (12%) over the last five years (Glazer, 2012). Carbonated soft drinks, followed by French fries, are the top items diners would like to replace.
To boost the bottom line, restaurant chains from Dunkin’ Donuts to T.G.I. Friday’s are crossing over to retail. Starbucks expects its consumer packaged goods business (e.g., Via instant coffee) to soon reach $1 billion in sales (Jennings, 2012).
P.F. Chang’s frozen meals/appetizers were the best-selling new food/beverage retail product in 2011 (IRI, 2012b). Six in 10 fine-dining operators, 54% of family restaurants, 41% of fast casual, and one-third of casual/quick-service operators offer packaged food products for sale (NRA, 2012a).
Catering, with sales projected to reach $7.9 billion in 2012, +5.6% vs 2011, is another high potential opportunity (NRA, 2012a). Food trucks/street food was the 13th-hottest restaurant trend cited by American Culinary Federation (ACF) chefs for 2012 (NRA, 2011). Foodservice operators still perceive food trucks/street food as competition. Only 6% of fast-food, 4% of fast casual, 3% of casual dining, and 1% of fine dining restaurants operate a food truck (NRA, 2012a). Sandwiches and Mexican are the top items on their menus (Moore, 2012a).
McDonald’s, KFC, Burger King, Starbucks, Tim Hortons, and Subway are the top chains in international sales. Many chains are posting double-digit growth outside of the United States; for example, Domino’s Pizza and Baskin-Robbins each jumped 21% in sales outside the United States in 2011 (Technomic, 2012a).
--- PAGE BREAK ---
Canada, China, and Japan enjoyed positive foodservice growth in the first quarter of 2012; Europe and Australia declined. France was the only European country to post traffic gains, Germany was flat, and Italy, Spain, and the UK fell (NPD, 2012f).
Hot Spots
There are four demographic targets worth catering to. First are those ages 55–64, who are the highest per capita spenders at restaurants (NRA, 2012b). This age group is projected to grow another 39% by 2018; those 65+ by 44% (U.S. Census, 2010). They are the most likely to order salads, soup, dessert, vegetables, and other check add-ons (Technomic, 2012c).
Those ages 18–24 spend the highest proportion of their income on food consumed away from home, although this is less per person compared with older adults due to their lower earning potential.
Gen X households with kids post the largest annual expenditure for food away from home. Restaurant visits that include children are now flat after several years of decline. In 2011, there were 19.5 billion family visits to restaurants; 15 billion were for fast food (NPD, 2012g).
Mini meals for adults and gourmet kids’ cuisines are among the hot trends for kids meals in 2012 (NRA, 2011). However, chicken nuggets, burgers, grilled cheese, sandwiches, pizza, mac and cheese, spaghetti, hot dogs, and quesadillas were still the top items on kids’ menus (Packaged Facts, 2012a).
Hispanics made 5.8 million visits to restaurants in the first half of 2011. Nearly half (45%) of visits by Hispanic consumers include three or more diners; 40% include children. With non-Hispanic consumers, 32% of visits include three or more individuals, and 30% of visits include children (NPD, 2011a).
The morning meal, with traffic up 3% for the first quarter of 2012 vs a year earlier, and the p.m. snack daypart, up 1%, continue to be “hot spots” for restaurants. Lunch and supper traffic is steady but flat. Quick-service restaurants (QSRs) grew at every daypart; the strongest gains were at the morning meal (NPD, 2012h).
The morning daypart accounts for 12% of restaurant industry sales, or about $42 billion. One in five consumers (18%) bought breakfast away from home more often in 2011 vs 2010 (Technomic, 2011b).
Just under half (46%) of adults buy weekday fast-food breakfasts, up 13% over the past two years. Lack of healthy menu items and boring kids’ breakfast options were the top QSR criticisms (Technomic, 2011b).
Progressive, multi-location breakfasts now account for 27% of breakfast eating occasions. This describes a scenario in which consumers eat something at home, stop at a drive-through or coffee shop, and then have a specialty coffee or snack mid-morning (FMI, 2011).
One-quarter (27%) bring breakfast from home to eat at work, 30% eat en route, and 10% of kids bring their breakfast to school (Technomic, 2011b). With 25% of McDonald’s and 14% of Burger King’s revenues now coming from breakfast, it’s not surprising that Wendy’s and Taco Bell have entered the daypart.
--- PAGE BREAK ---
Egg whites, parfaits, compotes, yogurt, buttermilk pancakes, turkey/chicken sausage, stuffed French toast, chilaquiles, and frittatas were the fastest-growing breakfast menu items in 2011 (Datassential, 2012). Ethnic-inspired breakfast items (e.g., Asian flavored syrups, chorizo scrambled eggs, coconut pancakes, and huevos rancheros) top the list of trendy breakfast menu items for 2012 (NRA, 2011).
All ages groups are snacking more frequently than two years ago. In 2012, 39% snacked midmorning, +9%; 73% snacked midafternoon, + 5%; 39% midevening, +3%; and 40% late at night, +2% (Technomic, 2012d).
Total U.S. sales of snacks at restaurants, vending machines, and mobile vendors is expected to reach $18.5 billion in 2012, up 3.7% over 2011 (Mintel, 2012c). QSRs are the top snack venue, with 69% of consumers visiting for a snack in March 2012, on average 2.7 times; 45% of consumers visited a casual restaurant an average of 1.0 times; and 35% visited a coffeehouse, an average of 1.2 times (Mintel, 2012c).
Afternoon from 3 p.m. to 6 p.m. is prime time for restaurant snacks; males and young and affluent adults are the best customers. Taste is an important selection criteria for 56%, cost for 42%, easy to eat 39%, crave-ability 28%, hearty/fills me up 26%, and healthy 24% (Mintel, 2012c).
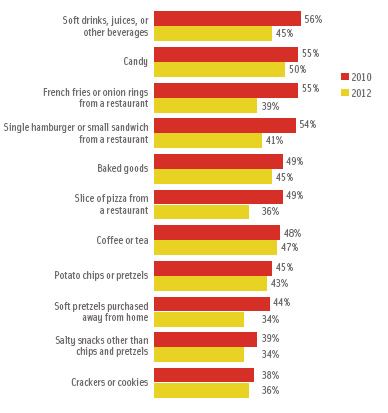 Restaurant snacks are ordered from the dollar/value menu by 43% of consumers; 33% order appetizer as snacks, 29% sides, and 28% beverages (Mintel, 2012c). Fewer diners are ordering French fries/onion rings for snacks; the total is down rather steeply from 55% in 2010 to 39% in 2012; sales of single burgers for snacks dropped from 54% to 41%, and pizza for snacks dropped from 49% to 36% (Technomic, 2012d; Figure 2). Ordering desserts for snacks falls off at age 45 (Mintel, 2012c).
Handheld ethnic foods (e.g., pupusas and empanadas), global street foods, and finger foods are fast-accelerating restaurant snack trends. Eggrolls, quesadillas, spring rolls, bruschetta, lettuce wraps, and hummus are among the most-ordered appetizers (Technomic, 2010a). Four in 10 consumers (41%) look for new/unique flavors for their away-from-home snack choices (Technomic, 2012d).
While beverages remain the most-ordered restaurant snack, they’ve taken on a critical role in differentiating restaurants and helping to create a healthy aura.
Specialty drinks and new noncarbonated beverages drove QSR visits in 2011 (NPD, 2011b). Just under half (47%) of consumers ordered a smoothie at a restaurant this spring; 26% bought their smoothie at McDonald’s (Mintel, 2012d).
Iced/frozen/slushy coffee, smoothies, cappuccino/espresso, iced tea, and frozen/slushy soft drinks are the top five beverage growth categories in restaurants (NPD, 2011b). Sales of coffee and tea at restaurant and drinking places are expected to reach $18.7 billion in 2012 (Packaged Facts, 2012b).
Half (50%) of diners plan to order healthier drinks in restaurants. One in five (22%) ordered fewer regular sodas vs last year; 67% of those who order beverages think regular soda is unhealthy; 53% of those who order beverages think that diet soda is unhealthy. Diners also are ordering fewer shakes/malts, juices, and lemonades (Mintel, 2012e).
--- PAGE BREAK ---
Nearly two-thirds (63%) of diners worry about sugary beverages and weight gain; 57% are concerned about high fructose corn syrup; 53% want more natural drinks; and 49% seek more low-calorie drinks in restaurants (Mintel, 2012e).
Lowfat milk/100% juice ranked third on fast-food operators’ hot menu trends list for 2012; energy drinks were 16th, and flavored/enhanced water 17th (NRA, 2012a).
House-made soft drinks/soda, specialty iced tea (e.g., Thai-style, gourmet lemonade, organic coffee, dairy-free milk, agua fresca, flavored/enhanced water, tap water/filtered, green tea, and energy drinks are the trendy nonalcoholic beverages for restaurants in 2012 (NRA, 2011).
Expect international favorites (e.g., Indian lassi or Latin horchata) to grab customer attention. Marrying beverage preferences to dayparts is a smart strategy. For example, black tea is a favorite at breakfast, tea with fruit flavors is popular at lunch, and herbal tea in the evening (Mintel, 2012f).
Locally produced wine/beer, micro-distilled/artisan spirits, culinary cocktails (e.g., herb-infused), food-beer pairings, onsite barrel-aged drinks, mixology, gluten-free beer, specialty beer (e.g., seasonal), organic wine, and craft beer microbrews are among the nonalcoholic drink trends for 2012 (NRA, 2011). “Skinny” (i.e., lower-calorie) cocktails and sugar-free, low-calorie mixers are other new directions.
A Flavored Future
Nine in 10 consumers consider grilled to be among their favorite flavors, followed by fruity, which is favored by 73%, sweet 72%, spicy 65%, tangy 65%, smoked 54%, salty 52%, herbal 51%, sour 31%, and bitter 11% (Technomic, 2011c).
During March 2012, 55% of those who ate out ordered Chinese at a restaurant sometime during that period, 54% Mexican, 51% Italian, 18% Japanese or Cajun/Creole, 12% Greek or Spanish, and 11% Thai. Consumers say that high quality ingredients and authentic dishes are the most important attributes when choosing an ethnic restaurant (Mintel, 2012g).
Ethnic fusion, Peruvian, regional ethnic, Cuban, Southeast Asian (e.g., Thai, Vietnamese), North African/Maghreb, Korean, Latin American/Nuevo Latino, Mediterranean, and Nordic/Scandinavian are the trendy ethnic cuisines for 2012 (NRA, 2011).
Ironically, while 75% of consumers are extremely/very likely to order ethnic food for dinner, only 52% do so at lunch, and 19% at breakfast; diners most prefer ethnic flavors in entrees (68%) and in appetizers (51%) (Technomic, 2012e).
Those ages 30–44 are the most likely to prefer eating foreign foods and to opt for foods cooked with a lot of spices; those ages 18–24 are the most likely to try and eat gourmet food whenever they can and to prefer food presented as an art form (Packaged Facts, 2012c).
--- PAGE BREAK ---
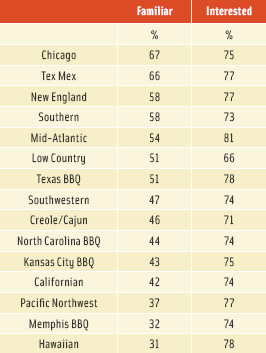 Mid-Atlantic, Hawaiian, Texas BBQ, New England, Pacific Northwest, Tex Mex, and Chicago top the list of American regional cuisines of greatest interest to consumers (Mintel, 2012a; Figure 3).
Eight in 10 diners say that preparation style is the most appealing way to add flavor to a dish (Technomic, 2011c). Pickling, fermenting, sous vide, liquid nitrogen chilled, oil poached, smoked, braised, grilled, roasted, and foam/froth/air top the list of ACF’s hot preparation techniques for 2012 (NRA, 2011).
Nearly one-third (31%) of consumers are more likely to order a dish if it is described as savory, 27% crispy, 22% rich, and 19% indulgent (Technomic, 2011c).
Sea salt, fennel, salt, cumin, cayenne, thyme, cilantro, black pepper, sage, and basil were the fastest-growing flavorings on restaurant menus over the past five years (Moore, 2012b).
Wasabi, Baja, garlic aioli, chipotle, garlic herb, chipotle mayo, tahini sauce, hummus, basil pesto, and Giardiniera were the fastest-growing sandwich sauces in 2011(Datassential, 2012).
Vegetable/vegetarian, ethnic street foods, charcuterie plates/samples, amuse-bouche/bite-size hors d’oeuvres, and warm appetizers salads are the trendy restaurant appetizers for 2012 (NRA, 2011).
Upscale Menus
With the advent of what has been described as an “everyday savoring” upscale eating experience that is defined by freshness, distinctive flavors, and food narratives, the demand for more sophisticated menu experiences will be unprecedented (Sloan, 2012).
Four of the top 10 U.S. eating occasions and one-third of all adult snacking involve savoring (Hartman, 2011). Moreover, there is a dramatic rise in the frequency of eating alone; 44% of all adult eating occasions take place alone; 35% of these “alone eating occasions” involve a savoring approach to food (Hartman, 2011).
Diners would most like to have rice, Chinese food, salads, eggs, beans, hamburgers, potatoes, vegetable, sweets, and meat cuts upgraded (Hartman, 2011). Even America’s most-ordered burgers will need to keep pace with this foodie-driven trend.
Locally sourced meats/seafood, sustainable seafood, newly fabricated cuts of meat, (e.g., pork flat iron), nontraditional fish (e.g., barramundi), grass-fed beef, and inexpensive/underutilized cuts of meat once again made the top 10 list of hot main dish trends for 2012 (NRA, 2012a).
--- PAGE BREAK ---
For the first time, ACF cited half portions/smaller portions; tapas/meze/dim sum; street food–inspired main dishes (e.g., tacos, satay, kebabs); specialty/gourmet sandwiches; lower-sodium entrees; and meatless/vegetarian items as trendy center-of-the plate meals for 2012 (NRA, 2011).
Panko-crusted tops the list of fastest-growing restaurant seafood preparations over the past two years, followed by tacos, Benedict, grits, tostada, crepes, green salad, bruschetta, lobster salad, and tuna sashimi. Over the past five years, tilapia, mahi-mahi, anchovies, ahi, and sea bass have posted the largest gains on menus for seafood (Moore, 2012c).
When it comes to sides, non-wheat noodles/pasta; black, red, brown, and wild rice; buckwheat; vegetable pickles; Asian noodles; braised/prepared vegetables; and sweet potato fries are considered trendy for 2012 (NRA, 2011).
Sliders, Caprese, pulled pork, Buffalo chicken wraps, chicken panini, brisket, hummus, Cuban, roast turkey, and chicken salad wraps were the fastest-growing sandwiches on restaurant menus in 2011(Datassential, 2012).
Maplewood smoked bacon, egg whites, tilapia, skirt steak, grilled salmon, pulled pork, mahi mahi, yellow fin, smoked salmon, and Black Forest ham were the up-and-coming sandwich proteins; for breads, brioche, flatbread, whole grain, Ciabatta, pretzel, Challah, multigrain, and marble rye were among the new menu gainers (Datassential, 2012).
In 2012, 62% of restaurant diners ordered soup at least occasionally, up from 43% in 2009. Chili (56%), French onion (50%), Asian-style (44%), Mexican-style (44%), Minestrone (43%), tortilla (39%), and gumbo (38%) are the ethnic soups diners would consider ordering (Technomic, 2012f).
Three-quarters (76%) now order salad at least occasionally in restaurants, up from 66% in 2009. More exotic salads have higher appeal. Vinaigrette, ranch, Caesar, balsamic, raspberry, Greek, and Chipotle are the salad dressings that appear most often on the menu in the top 250 chains (Technomic, 2012f).
Ethnic favorites, small bites, and artisan preparations top the hot trends in restaurant desserts (NRA, 2011). Watch for panna cotta, Mexican paletas, Granita, and ethnic cookies, led by Mexican galletas/polvorones, Parisian macaroons, and Asian tea cookies. Mini-cakes are a very hot item as are mini-puddings/sampler treats.
Red velvet, peanut, chocolate ganache, and vanilla bean top the list of the fastest-growing cakes on menus (Datassential, 2012). When catering to high-spending diners age 50+, it’s a good idea for foodservice operators to offer classic European favorites (e.g., eclairs, mousse, and strudel).
--- PAGE BREAK ---
Healthy Heats Up
One-quarter (27%) of consumers choose a restaurant for its healthy menu items often or very often, which is double the level in 2009 (Technomic, 2012c). Only 13% of restaurant goers are never interested in ordering a healthy meal (Mintel, 2012h).
Millennials (31%) are the most likely group to select a restaurant for a healthy menu; 27% have cut back on eating out for health reasons, 42% for financial reasons (Technomic, 2012c).
Healthier kids’ meals topped the list of menu trends most important to fast-food operators in 2012, followed by fruit/vegetable sides for kids’ meals, gluten-free, low-fat/nonfat milk, locally sourced, and lower-sodium items. Lower-calorie items ranked eighth, lower-fat 10th, whole-grain bread 13th, organic items 18th, and sweet potato fries 20th (NRA, 2012a).
The National Restaurant Association’s Kids LiveWell program now includes 100 restaurant brands and more than 25,000 restaurants in 50 states dedicated to providing healthier meals for kids (Anon., 2012b). McDonald’s recently announced new goals for Happy Meals longer term, including a reduction in sodium, sugar, and saturated fat.
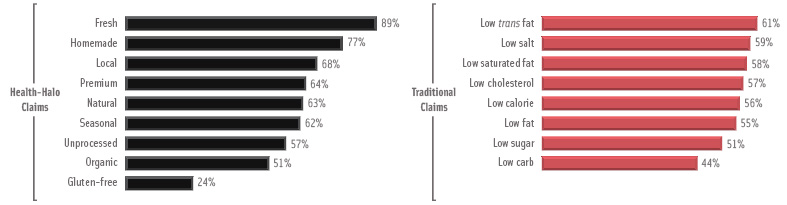 While traditional health claims are still important on menus, they are giving way to a combination of natural descriptors that are collectively perceived as not only delivering a healthy halo, but enhancing, rather than detracting from the taste and quality of the food (Technomic, 2012g; Figure 4). There are five main pillars essential to creating a healthy halo.
1) Freshness. This is the descriptor most associated with a healthy restaurant meal. Fresh ingredients are second only to taste/flavors in influencing restaurant selection. Made from scratch, real, authentic, handmade, never frozen, and slow-cooked are among the freshness terms with the highest appeal. Four in 10 diners are willing to pay more for fresh, 32% for homemade, and one in five for local, natural, premium, organic, seasonal, and unprocessed foods (Mintel, 2012h).
2) Avoidance. While claims related to fat and salt content are top of mind with consumers, few are willing to pay more for them; 15% are willing to pay more for products with lower fat, cholesterol, and calorie claims; one in 10 consumers is willing to pay more for products with lower salt, sugar, and carbs (Technomic, 2012g). After all natural and organic, fat-free, low-fat, multi-grain, whole grain, sugar-free, low-carb, free-range, and farm-raised rounded out the top 10 healthy claims on menus in 2011 (Packaged Facts, 2012a). One-third (34%) of consumers look for items made with less bread in restaurants, and 22% look for gluten-free (Technomic, 2010b). The use of the term low-calorie on menus increased 154% in 2011 vs the previous year (Technomic, 2012g).
--- PAGE BREAK ---
3) Healthy ingredients/add-ins. More fruits/vegetables than the average meal is the top food preparation criteria, cited by 34% of diners when choosing a healthy meal; 23% mention whole-grain/multi-grain (Mintel, 2012h). Locally grown and organic produce, superfruits (e.g., açai, goji berry, and mangosteen), and exotic fruits (e.g., rambutan, dragon fruit, pawpaw, and guava) are among the hot produce trends for 2012 (NRA, 2011). Heirloom apples, tomatoes, and beans; hybrid fruits/vegetables (e.g., plumcot, grapple, and broccoflower); specialty potatoes; micro-vegetables; and fresh herbs are other new directions.
4) Natural, organic, local, close to the farm. All natural tops the list of attributes consumers are willing to pay more for in restaurants, followed by natural, certified organic, unprocessed, hormone-/antibioticfree, preservative-free, and no artificial sweeteners (Technomic, 2010b). Hyper-local sourcing (e.g., restaurant gardens and farm-/estate-branded ingredients) ranked 12th among ACF chefs’ trends for 2012 (NRA, 2011).
5) Ethical, sustainable, and humane. Consumers now also link many of their ethical priorities to health; 60% believe that sustainable foods are healthier, 55% believe that of grass-fed or farm-raised products, 52% free-range, 49% cage-free, 36% local, and 32% fair trade (Technomic, 2010b). Four in 10 (41%) say humane treatment is important for restaurant foods; 52% bought fair trade coffee or tea last year, 27% purchased fish caught in the wild, 20% cage-free eggs, 19% grass-fed beef, and 19% vegetarian foods (Gallup, 2011). Chipotle Mexican Grill’s “Food with Integrity” program has embraced the plight of small farms. Delmonico’s diners can determine the origin of their steak with their cell phones. Chef Todd English has announced his first oyster farm in New England for his restaurants.
Lastly, the issues around healthy foods in restaurants will continue to mount. Allergy concerns are significant as well; an estimated 9 million U.S. adults (4% of the adult population) and 6 million children (8%) are afflicted (FAAN, 2012). Menu labeling will be another harsh reality for operators. Four in 10 say they would likely order healthier items in a restaurant if it offered nutrition information (Technomic, 2012c). One-third (36%) use the Internet to search for nutrition information on restaurants (NRA, 2012a).
A. Elizabeth Sloan, Ph.D., a Professional Member of IFT and Contributing Editor of Food Technology, is President, Sloan Trends Inc., 2958 Sunset Hills, Suite 202, Escondido, CA 92025
([email protected]).
References
Allen, A. 2012. Consumer picks. Nation’s Restaurant News 46(16): 19-21.
Anon. 2012a. Made to order. QSR magazine. 167: S2, 4.
Anon. 2012b. About the LiveWell program. National Restaurant Assn., Washington, D.C. www.restaurant.org.
Datassential. 2012. Trends to watch. QSR magazine. 163: 4-23.
FAAN. 2012. Food Allergy and Anaphylaxis Network, Fairfax, Va. www.foodallergy.org.
FMI. 2011. U.S. grocery shopper trends. Food Marketing Institute, Arlington, Va. www.fmi.org.
Gallup. 2011. Gallup study of nutrient knowledge & composition.
Glazer, F. 2012. Winning combinations. Nation’s Restaurant News 46(13): 104, 105.
Hartman. 2011. Eating by the numbers. The Hartman Group, Bellevue, Wash, www.hartman-group.com.
IRI. 2011a. The downturn shopper. Times & Trends, Oct./Nov. SymphonyIRI Group, Chicago, Ill. www.infores.com
IRI. 2012a. CPG year in review. Times & Trends, Feb.
IRI. 2012b. 2011 new product pacesetters. Times & Trends, April.
Jennings, L. 2012. License to sell. Nation’s Restaurant News 46(13): 1, 16, 17.
Longo, D. 2012. Scaling the heights. Convenience Store News 48(8): 28-30, 32, 34, 36.
Mintel. 2012a. Dining out: a 2012 look ahead—U.S. January. Mintel International, Chicago, Ill. www.mintel.com.
Mintel. 2012b. Convenience store foodservice—U.S. March.
Mintel. 2012c. Trends in snacking and value menus in foodservice—U.S. June.
Mintel. 2012d. Smoothies and shakes: made to order—U.S. July.
Mintel. 2012e. Non-alcoholic beverages at restaurants—U.S. June.
Mintel. 2012f. Tea & RTD tea—U.S. July.
Mintel. 2012g. Ethnic restaurants—U.S. March.
Mintel. 2012h. Healthy dining trends—U.S. May.
Moore, S. 2012a. What’s hot on food truck menus. April 26. www.nrn.com.
Moore, S. 2012b. Restaurants’ hottest herbs and spices. Feb. 2. www.nrn.com.
Moore, S. 2012c. Seafood menu trends highlight comfort, bold avorings. March 8. www.nrn.com
NPD. 2011a. U.S. Hispanics consider restaurant dining a family affair. Press release, Nov. 9. NPD Group, Port Washington, N.Y. www.npd.com.
NPD. 2011b. Beverages at foodservice: satisfying our taste for beverages report. Sept.
NPD. 2012a. Restaurant traffic upward momentum slows in spring. Press release, Aug. 14.
NPD. 2012b. Financially comfortable and financially strained consumers cut back on restaurant use, but for different reasons. Press release, April 4.
NPD. 2012c. Success of fast casual restaurant chains will influence entire restaurant industry in 2012 and beyond. Press release, Feb. 8.
NPD. 2012d. Drive-thru windows still put the fast in fast food restaurants. Press release, May 30.
NPD. 2012e. 2012 Re-count report. Spring.
NPD. 2012f. Global foodservice traffic has its ups and downs. Press release, Aug. 29.
NPD. 2012g. Better deals and more sophisticated palates contribute to kids’ meals decline.
NPD. 2012h. Consumer visits and spending gains buoy first positive restaurant count increase since 2009. Press release, July 25.
NRA. 2011. What’s hot survey. National Restaurant Assn., Washington, D.C. www.restaurant.org.
NRA. 2012a. The 2012 restaurant industry forecast.
NRA. 2012b. Personal communication, Annika Stenson and per capita spending U.S. restaurants chart.
Packaged Facts. 2012a. The foodservice landscape in the U.S. February. Packaged Facts, New York, N.Y. www.packaged facts.com.
Packaged Facts. 2012b. Coffee and tea foodservice trends. Feb.
Packaged Facts. 2012c. A look at eating in the U.S. July.
Sloan, A.E. 2012. What America eats. Food Technol. 66(1): 21-22, 25-26, 29-32.
Technomic. 2010a. The consumer trend appetizer report. Technomic Inc., Chicago, Ill. www.technomic.com
Technomic. 2010b. The consumer healthy eating report.
Technomic. 2011a. Am. Express Market Briefing. Dec.
Technomic. 2011b. The breakfast consumer trend report.
Technomic. 2011c. The flavor consumer trend report.
Technomic. 2012a. Fast-casual brands ahead of industry growth. Press release, May 15.
Technomic. 2012b. Top 500 chain restaurant report.
Technomic. 2012c. The generational consumer trend report.
Technomic. 2012d. The snacking occasion consumer trend report.
Technomic. 2012e. Global flavor report.
Technomic. 2012f. The left side of the menu soup & salad report.
Technomic. 2012g. The comprehensive guide to foodservice consumers: North American study. July.
U.S. Census. 2010. www.census.gov.