
Demographic Redirection
Gourmet mini-meals, specialty nutritional ingredients, and healthy fast food are among the product development opportunities available to food and beverage makers seeking to satisfy evolving generational food preferences.

Dramatic generational differences in eating patterns, flavor preferences, and personal priorities are creating new opportunities with great potential for food and beverage marketers. At the same time, other U.S. demographic sectors (e.g., lower-income consumers, empty nest households, adults living alone, and Hispanics) are reaching critical mass and bringing with them a series of new, unique, and unmet food product needs. It is the intent of this article to identify emerging demographically driven food and beverage opportunities and to analyze the younger generation’s behaviors and values in the hope of providing a road map for the years ahead.
A Demo Memo
There are four major adult generational groups. The Millennials, also known as Generation Y or the Echo Boomers because they are the children of the Baby Boomers, are the youngest cohort and will redefine the food industry longer term. Born between 1981 and 2000, they’re ages 13–32 in 2013 and total 85 million; 25% of Millennials are in the workforce (U.S. Census, 2010; BLS, 2012).
Millennials are the most ethnically diverse and most educated generation to date; 33% hold a bachelor’s degree or higher (U.S. Census, 2010). Millennials view their food choices as healthier, more expensive, more natural/organic, less processed, and better-tasting than those of their Boomer parents (Hartman, 2011).
Millennials enjoy social eating occasions and are the demographic group that is least likely to feel comfortable eating a meal at home alone (45%). They’re the most active late night eaters and have the highest preference for fast foods over home-cooked meals, +18% over the past five years (Packaged Facts, 2012a).
Generation Xers—born between 1965 and 1980 and now ages 33 to 48—are the smallest generation with 61 million adults. Gen Xers are the most likely to be living in households with at least one child and are considered the busiest and most “cash-strapped” as a result (U.S. Census, 2010; Packaged Facts, 2012a). Gen Xers feel they don’t have time to take care of themselves and find fast food to be a convenient solution to their lifestyle. Lunch is more important to Gen Xers than dinner. Ironically, they’re the most likely to try new healthy products and to buy organic foods. A longer-term concern to packaged foods marketers is that 44% of Gen Xers think that frozen dinners offer little nutritional value, +15% over the past five years (Packaged Facts, 2012a).
One-third of the U.S. population—106 million adults—are over age 50. The number of individuals ages 55–64 will increase by 39% from 2011 to 2018; the number of those ages 65–74 will increase by 44% (U.S. Census, 2010).
Baby Boomers—born between 1946 and 1964 and ages 49–67 in 2013—remain the largest adult generation with 81 million members. Although they’re approaching retirement, 83% are still active in the workforce; 73% are Caucasian (U.S. Census, 2010; BLS, 2012).
Older Boomers (ages 55–64) are now the highest per capita spenders at restaurants (NRA, 2013). Boomers are the most proactive when it comes to health, the most likely to eat alone, have the highest interest in ingredients, and view dinner as their most important meal (Packaged Facts, 2012a).
Matures, or the World War II or Silent Generation, are the 40 million adults born before 1946 who are now age 68 and older (U.S. Census, 2010). Matures are the most likely to prepare home-cooked meals, to say they already eat healthfully, and to regularly eat breakfast (Packaged Facts, 2012a).
The incidence of snacking falls markedly after age 50. Boomers and Matures try to eat more healthfully by balancing meals based on the basic four food groups—milk/dairy, meat/fish/protein, fruits/vegetables, and cereals/grains/bread—and they’re sending sales of side dishes, side breads, and salads soaring (NPD, 2011).
But while older adults are to be catered to, America’s 73.8 million kids under age 18 and the 32 million moms with children under age 18 at home also represent an enormous opportunity for food and beverage marketers (Packaged Facts, 2012b).
In 2010, 308 million Americans lived in 116.7 million households, with an average of 2.58 persons per household. Two-person, married-couple households with no children at home remain the largest U.S. household unit (57 million); there are 31 million persons living alone, and 24 million households comprised of a married couple with kids under the age of 18 (U.S. Census, 2010).
Since 2006, the recession has resulted in a steady decline in the number of U.S. births. The number of births has fallen from a peak of 4.3 million in 2009 to under 4 million in 2011, a decline of 8.4% (U.S. Census, 2010).
Low-income grocery shoppers are projected to bring in $115 billion in incremental consumer packaged goods spending between 2010 and 2020 (IRI, 2010). By 2015, lower-income households (with income less than $35,000) will account for 45% of U.S. households; by 2020, it will be 51%. The number of affluent households is projected to fall 9.2% by 2020 (U.S. Census, 2010).
Low-income households are dominant players in the cold cereal, yogurt, frozen dinner/entrée, frozen pizza, fresh bread/rolls, natural cheese, soup, luncheon meat, salty snack, crackers, cookies, ice cream, and chocolate candy categories (IRI, 2010).
--- PAGE BREAK ---
Generational Cooking
The generational divide that once existed for scratch cooking is closing, opening up new opportunities for fresh convenience products and more upscale basic ingredients that appeal to younger cooks. In 2012, 47% of Millennials made the prior night’s dinner from scratch vs 52% overall (MSI, 2011a).
And the future looks fresh. While making dinner primarily from fresh foods is very important to 44% of meal preparers, it is the most important food attribute for Millennial cooks (MSI, 2011a).
Millennials and Gen Xers have cut back on restaurant visits for the fifth year in a row, especially at dinner, which suggests that easy-to-use, chef-inspired products have a very bright future (NPD, 2013).
With half of Millennials describing their cooking skills as “less than competent,” it’s not surprising that they’re the most likely to use no-cook meal preparations (MSI, 2011a). Millennials are the most frequent users of fresh chilled retail meals and frozen dinners; Gen Xers purchase supermarket fresh prepared meals most frequently (Technomic, 2012a; Packaged Facts, 2012a).
Although Millennials have the highest tendency to use a wide variety of cooking methods, they’re second to Matures for use of the microwave oven; in a given week, 58% of Matures and 51% of Millennials used the microwave for their meal preparation (Mintel, 2012a; Table 1).
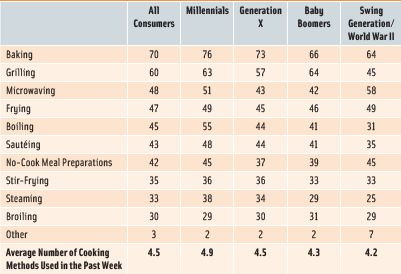
Along with Gen Xers, Millennials are the most likely to bake in the oven and to stir-fry; along with Boomers, they’re the most likely to grill. Millennials are significantly more likely than their older counterparts to boil, sauté, or steam (Mintel, 2012a).
Younger cooks are more inclined to prepare meals using helpers and have a lower preference for complete kits (Hartman, 2008). Over one-quarter of meal preparers under the age of 45 use cooking/simmer sauces that they add to fresh meat, fish, or vegetables; this is significantly more than their older counterparts (Mintel, 2011a).
While meals that can be prepared in under 20 minutes are on the rise, up 11% over the past five years, the increase is greater than average among Millennials—up 18%. One-pot meals are the least popular with Millennials but are most popular in households with kids (FMI, 2013).
Boomers and Gen Xers were the most likely to prepare chicken at home for dinner in 2012; Matures were most likely to prepare seafood/fish, steak/beef, roast, or soup (MSI, 2011a; Table 2). Gen Xers are the most likely to buy natural/organic meats and poultry (FMI, 2013).
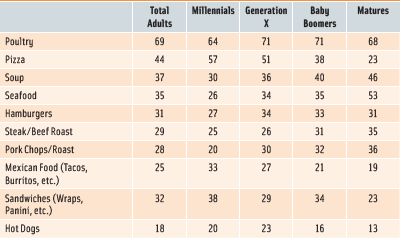
While Millennials are most likely to serve pizza or hot dogs for dinner; they’re the least likely to prepare burgers at home (MSI, 2011a). Millennials are the most likely to serve dessert with dinner; cookies and ice cream top the list (MSI, 2011a).
Foodies and Flavors
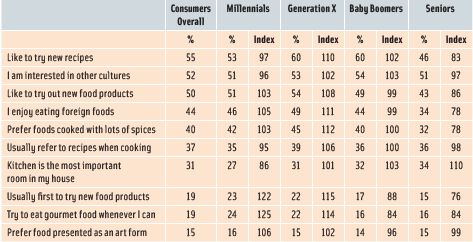
Gen Xers (60%) are the most likely to enjoy trying new recipes, up 11% over the past five years. They have the highest preference for foreign foods and for foods cooked with lots of spices (Packaged Facts, 2012a; Table 3).
Millennials are the most likely to try to eat gourmet food whenever they can. Focused on being trendy, they take pride in usually being first to try a new food product and prefer to have their foods presented as an art form (Packaged Facts, 2012a). They’re the most interested and adventuresome in terms of trying new flavors/cuisines (Technomic, 2012b).
Older Millennials ages 25–34 (73%) are the most frequent purchasers of specialty foods, followed by older Boomers ages 55–64 (69%); 62% of Matures bought gourmet foods, up 8% last year. Matures are the No. 1 buyers of specialty coffee and cheese (NASFT, 2012).
Young Millennials, however, spend the largest proportion of their food income on gourmet foods and will secure a strong future for more upscale culinary fare. In 2012, they were the No. 1 purchasers of gourmet chocolate, nonalcoholic specialty beverages (e.g., water, tea, soda), bread/baked goods, salty snacks, cookies/snack bars, pasta/sauce, salad dressing, frozen lunches/dinners, baking mixes, nut butters, cooking sauces, cakes/pies, and candy (NASFT, 2012).
Those under age 35 are the most likely to prepare ethnic foods at home and are most likely to cook Mexican, Italian, Chinese, and Hispanic (other than Mexican) cuisine or to make Spanish tapas (Mintel, 2012b). Preparing ethnic meals increased 15% among Millennials over the past five years (FMI, 2013).
After Chinese, Italian, and Mexican, Millennials are most interested in ordering Japanese, Spanish, Thai, Greek, and French foods in restaurants; Gen Xers are most interested in Spanish, Japanese, Thai, Greek, and Mediterranean (Technomic, 2012b).
International/ethnic flavored (e.g. Thai curry, Indian Masala), followed by spicy/hot, sweet, and authentic U.S./regional U.S. flavors are the preferred options in cooking sauces and marinades for those under age 35 (Mintel, 2011).
--- PAGE BREAK ---
 Older Boomers (35%) are the most likely to purchase American regional foods (NASFT, 2012). They are most interested in mid-Atlantic regional foods followed by Hawaiian, Texas BBQ, New England, Pacific Northwest, Tex Mex, and Chicago-style (Mintel, 2012c).
Food Preferences and Patterns
While salty/savory snacks, easy meals, sweet snacks/desserts, center-of-the-plate proteins, and heat-and-eat breakfast items are projected to be the fastest-growing at-home food categories through 2018, they will explode in popularity among Millennials, with growth in the number of eatings of 44%, 42%, 34%, 22%, and 4%, respectively (NPD, 2011).
Snacking more frequently and eating smaller meals throughout the day are increasingly common behaviors among the younger generations; 38% of Gen Xers and 39% of Millennials ate several small meals throughout the day last year, up 16% and 6%, respectively, over the past five years (Packaged Facts, 2012a).
Salted snacks remain a favorite of Millennial consumers, up 15% over the past five years (Packaged Facts, 2012a). Millennials are most willing to pay more for dipping sauces with their snacks (Technomic, 2011).
Millennials are most likely to eat certain foods associated with snacks—frozen pizza, granola bars, fruit snacks, and frozen snacks. They’re significantly less likely to use canned soup, hot cereal, frozen vegetables, and salad dressing (Hartman, 2011).
Millennials are also driving the trend to use beverages as snacks; one-third used drinks as snacks more frequently in 2012 vs 2010 (Technomic, 2012c).
Those under age 35 are most likely to visit a fast food restaurant for snacks and to order them from the dollar, appetizer, and side dish menus. Ordering snacks from the dessert menu falls off at age 45 (Mintel, 2012d).
Millennials are the most likely to eat breakfast away-from-home; they do so more than twice as often as other groups (Technomic, 2012d). Older Millennials are most willing to spend more on natural/organic breakfast options; Gen X shoppers are most willing to spend extra for cage-free eggs (Technomic, 2012d).
Millennials and Gen Xers are the most likely to eat yogurt, sandwiches/wraps, smoothies, and baked goods at breakfast; Gen Xers are most likely to opt for Greek vs regular yogurt (Technomic, 2012d).
Millennials drink a much wider range of beverages than other generations. Juice, sports drinks, energy drinks, hot cocoa, flavored milk, powdered drinks, ready-to-drink coffee, and sparkling drinks top the list; they are least likely to drink fresh brewed coffee, alcohol, and hot tea (Hartman, 2011). Millennials are the most likely to use soy milk/alternative beverages (MSI, 2010).
Millennials and Gen Xers are the most frequent home entertainers; 56% and 58%, respectively, entertain friends/family at least once a month. Snacks top the list of foods served to their guests (Wyatt, 2013).
Gen Xers are most likely to order takeout; 41% of Gen Xers’ restaurant orders were for takeout in 2012. Millennials are the most likely to use delivery; Boomers are most likely to dine in at restaurants (Technomic, 2012b).
 Get Xers are the most likely to buy foods from drug stores; 41% bought more food items from drug stores than one year ago; 19% of Millennials would buy more foods from vending machines if given the option (Technomic, 2012a; Mintel, 2012e).
Health and Wellness
Although healthy eating increases with age, healthy eating practices are rising fast among young adults. In 2012, 55% of those ages 18–24 and 62% of those ages 25–44 said it was very important to eat healthy/pay attention to nutrition; four in 10 ate more foods for specific nutritional benefits than they did the prior year (Technomic, 2012e).
Millennials are the most likely (31%) to very often/often choose a restaurant for the healthfulness of its menu. Over half (55%) of Millennials want restaurants to offer better-for-you options and alternatives to indulgent foods (Technomic, 2012e).
Younger consumers are the most likely to have made healthy dietary changes in the past year including eating more fruits/vegetables, cutting calories by drinking water, or using low-/no-calorie beverages, avoiding products with added sugar, and opting for smaller portion sizes (IFIC, 2013).
--- PAGE BREAK ---
About two-thirds of Millennials and Gen Xers read nutrition labels (IFIC, 2013). Younger adults are more likely to look for calories (59%), vitamins/minerals (29%), serving size (26%), and protein (23%) than their older counterparts (Hartman, 2011).
Older consumers are more likely to look for sodium, fiber, sugars, trans fat, saturated fat, fats/oils, low-calorie sweeteners, MSG, and mono/polyunsaturated fats (IFIC, 2013). Those under age 50 are much more likely to want to get their nutrients from foods/beverages than from supplements (MSI, 2010).
Use of functional foods and beverages is highest among the youngest consumers and decreases with age (Mintel, 2009, 2010). Millennials are the most likely to believe that functional foods/beverages can be used in place of some medicines (NMI, 2012).
Retaining mental sharpness with aging, cardiovascular disease, bone health/strength, cancer, the ability to continue normal activity with aging, eye health, and arthritis/joint health are the top health concerns of those ages 50+ (HealthFocus, 2012). Millennial consumers have some similar concerns. Cancer, appearance/skin, tiredness, retaining mental sharpness as they age, bone health/strength, and eye health top the list of health concerns for Millennials (HealthFocus, 2012).
Younger shoppers are most likely to buy foods/beverages that address allergies, aging, appearance, digestive health, women’s health, immunity, and mental clarity (Packaged Facts, 2012c).
Boomers are the heaviest users of condition-specific foods/drinks for men’s health, while Matures buy foods for cancer, cholesterol, eye health, and joint/bone health at an above-average rate. Those ages 45+ disproportionately cite blood pressure, diabetes, and heart/circulatory health as driving their functional food purchases (Packaged Facts, 2012c).
Millennials, especially young Hispanic and black males, remain the primary driver of the $12.5 billion energy drink/shot segment (Packaged Facts, 2013a).
Concern over heart disease risk factors is growing quickly among younger adults; 48% of Gen Xers and 40% of Millennials are concerned about high blood pressure vs 66% of Boomers. Fifty-four percent of Gen Xers and 40% of Millennials are concerned about cholesterol vs 58% of Boomers (Hartman, 2010).
Boomers ages 55–64 are the most likely to be trying to lose weight, with those 45–54 a close second; Matures are most likely to be trying to maintain weight (Packaged Facts, 2013b).
Boomers are most likely to be diagnosed with diabetes; 68% of all diabetics were diagnosed between ages 40 and 64. Currently, 10.9 million Matures suffer from diabetes (ADA, 2013).
Three-quarters of Boomers vs 58% of Millennials were aware of probiotics in 2012; 18% made a strong effort to consume more probiotics last year—the same level across all generations (MSI, 2012a).
Nearly half (45%) of Millennials and Gen Xers searched the Internet for nutrition information about restaurant foods before their visit in 2012—a significantly higher percentage than among older cohorts. Millennials were much more likely to be negatively influenced by calorie counts on menus; 41% of Millennials vs 22% of older cohorts changed their order as a result of calorie information (Technomic, 2012e).
Kidding Around
With better-for-you foods accounting for only 40% of the $10 billion U.S. kids-directed food and beverage market in 2011, there is a tremendous opportunity for new foods/drinks that help ensure children’s health (Packaged Facts, 2011).
Moms are more likely than shoppers overall—46% vs 39%—to buy nutritionally enhanced food/drinks and to actively seek out nutritional information/guidelines (Packaged Facts, 2012b). In 2012 one-third of moms of kids ages 4–12 made a strong effort to increase vitamins/minerals, fresh/unprocessed foods, whole grains, calcium, and protein in their child’s diet; three in 10 made an effort to increase vitamin D, vitamin C, and dietary fiber; one-quarter worked hard to increase fish oil/omega-3s; and one in five was very focused on probiotics/prebiotics. Three in 10 moms believe probiotics are essential to a child’s health; 41% say they’re very effective for digestion and 38% for immune health (MSI, 2012b).
Half (49%) of moms of preteens made a strong effort to limit caffeine; one-third made that effort with artificial sweeteners and high fructose corn syrup; three in 10 had that level of concern about trans fats, low-/no-calorie sweeteners, sugar, and artificial flavors; and one-quarter were concerned about artificial colors and saturated fat last year (MSI, 2012b).
Fruit topped the list of foods eaten at least once a week by kids ages 4–12 in 2012, followed by hot/cold cereal, salads/vegetables, cheese, bread/toast, yogurt, pasta dishes/salads, and peanut butter (MSI, 2012b).
--- PAGE BREAK ---
Forty percent of preteens ate frozen entrees/dinners at least once a week, 44% French fries, 26% lunch kits, and 25% pizzeria pizza last year (MSI, 2012b). One in 10 kids brought breakfast to school (Technomic, 2012d).
Fruit juice (100% juice, not orange), whole/2% milk, bottled water, and fruit drinks/punches were the top drinks consumed by kids ages 4–12 in 2012; regular soft drinks were twice as popular as diet (28% vs 12%); tap/bottled water was over three times as popular as vitamin water (MSI, 2012b).
Kids ages 10–12 were most likely to drink sports beverages. Only 7% of preteens drank energy/protein drinks; 17% used nutritional drink mixes (MSI, 2012b).
From 2007 to 2012, the number of moms looking for natural/organic foods while shopping jumped 31% to 9.2 million. As children age, moms are increasingly less likely to buy organic foods; 39% of those with kids under the age of 2 use organic foods, 33% of those with kids ages 3–5 do so, 29% of those with kids ages 6–11, and 25% of those with children ages 12–17 (Packaged Facts, 2012b).
When it comes to fresh items, moms are more likely to choose organic yogurt, meat/poultry, cheese, bread, and fresh produce. In-store, they’re 36% more likely than the general population to buy organic frozen food, 30% more likely to buy organic pasta, 28% more likely to purchase organic sauces/marinades, 22% more likely to buy organic chocolate, and 17% more likely to opt for organic breakfast cereal (Packaged Facts, 2012b).
Households with kids, but not necessarily kids themselves, over index for the use of trail mixes, smoothies, energy beverages, yogurt, meal replacement/protein drinks, and nutrition bars (Mintel, 2013a; Packaged Facts, 2012c).
Healthy kids’ meals are No. 3 on the list of hot restaurant trends for 2013 (NRA, 2013). Whole-grain items in kids’ meals, fruit/vegetable sides, entrée salads, oven-baked items (e.g., baked chicken fingers), and oven-baked fries are among the new directions in kids’ meals (NRA, 2012).
Health-Minded Hispanics
Hispanics are currently the largest minority group in the United States, topping 51 million in 2010, up 43% vs 2000. In contrast, there were 40 million blacks and 15 million Asian Americans (U.S. Census, 2010).
Latinas spend more on packaged goods and foods than non-Hispanics, driven mainly by household size and cooking habits. Hispanic shoppers are 50% more likely to be child-influenced than non-Hispanics (ConAgra, 2013). The U.S. Hispanic food market is projected to grow from $8.2 billion in 2012 to $10.7 billion by 2017 (Packaged Facts, 2012d).
Among ethnic groups, Hispanics are the group that is most likely to be ordering more ethnic foods and flavors in restaurants than they were a year ago (Technomic, 2012f).
Although Hispanics are younger (mean age of 28 vs 37 for the U.S. population overall), those 50+ are driving growth, opening up a new opportunity for condition-specific functional foods for Hispanics (MSI, 2011b). Hispanics are 36% more likely than the general population to be the first to try a new health food and 56% more likely to try a nutritional product (Packaged Facts, 2012d).
Four in 10 Hispanics adults (42%) make a strong effort to consume more nutrients; vitamins C, D, and A, calcium, and potassium top the list (MSI, 2011b).
Three-quarters of Hispanics are limiting the number of processed foods they consume; 74% of Hispanics are trying to maintain a low-fat diet (Mintel, 2013b).
Hispanics are also the most likely sector to buy nutritional products for their children. By 2015, there will be 17 million U.S. Hispanic children under age 14; they’ll also dominate growth in the teenage market (Packaged Facts, 2012d).
Hispanics index significantly higher for use of foods that help lower cholesterol, second only to Matures. Half (48%) of Mexican-American men and women have high cholesterol. Just under one-third have high blood pressure (AHA, 2013).
Hispanics are twice as likely as non-Hispanics to be diagnosed with diabetes; they are 30% more likely to buy foods/supplements for arthritis/joint pain (Packaged Facts 2012c). They’re the least likely group to be trying to lose/maintain weight (Packaged Facts, 2013b).
Ethical Issues
Expect environmental and ethical pressures on food manufacturers to continue longer term. Just over half (54%) of Millennials feel strongly that stores should sell more environmentally friendly products (Mintel, 2012f).
Boomers top the list of Fair Trade food and grass-fed beef purchasers; Matures index highest for buying local foods (MSI, 2010). Six percent of Millennials are “faithful vegetarians.” Vegetarian practices have increased 29% among Gen Xers and 19% among Millennials over the past five years (Packaged Facts, 2012a).
Moms are most likely to oppose the use of artificial growth hormones and GMO foods (Packaged Facts, 2012b). Glutenfree foods are of most interest to Gen Xers, likely due to the presence of kids (MSI, 2010).
Lastly, the likelihood of thinking about the safety of foods increases with age and with the presence of children. Older consumers are most likely to be concerned about foodborne illnesses from bacteria, the safety of imported foods, and animal antibiotics (IFIC, 2013). Food safety/contamination is a major worry for 61% of moms when buying fresh meat/seafood (Packaged Facts, 2012b).
 A. Elizabeth Sloan, Ph.D.,
a Professional Member of IFT and Contributing Editor of Food Technology,
is President, Sloan Trends Inc., 2958 Sunset Hills, Suite 202, Escondido, CA 92025
([email protected]).
References
ADA. 2013. American Diabetes Assn. Arlington, Va. www.diabetes.org.
AHA. 2013. Heart disease and stroke statistics. American Heart Assn., Dallas, Texas. www.americanheart.org.
BLS. 2011. Total labor force participation by generation. Bureau of Labor Statistics. www.bls.gov.
ConAgra Foods. 2013. The Hispanic food shopper study. Supplement to Progressive Grocer, May. www.progressivegrocer.com.
FMI. 2013. The power of meat. Food Marketing Institute, Arlington, Va. www.fmi.org.
Hartman. 2008. Reimagining convenience foods. The Hartman Group, Bellevue, Wash. www.hartman-group.com.
Hartman. 2010. Reinventing health & nutrition.
Hartman. 2011. Culture of millennials.
HealthFocus. 2012. U.S. trend study. HealthFocus Intl., St. Petersburg, Fla. www.healthfocus.com.
IFIC. 2013. Food & health survey. The International Food Information Council Foundation, Washington, D.C. www.foodinsights.com.
IRI. 2010. Lower-income report. Information Resources Inc., Chicago, Ill. www.infores.com.
Mintel. 2009. Functional foods—U.S. Aug. Mintel International, Chicago, Ill. www.mintel.com.
Mintel. 2010. Functional beverages. May.
Mintel. 2011. Cooking sauces and marinades—U.S. April.
Mintel. 2012a. Cooking enthusiasts—U.S. Oct.
Mintel. 2012b. Ethnic foods—U.S. Jan.
Mintel. 2012c. Dining out: a 2012 look ahead—U.S. Jan.
Mintel. 2012d. Trends in snacking and value menus in food-service—U.S. June.
Mintel. 2012e. Marketing to millennials—U.S. Aug.
Mintel. 2013a. Nutritional food and drink—U.S. Jan.
Mintel. 2013b. Hispanic diet and wellness—U.S. March.
MSI. 2010. The 2010 Gallup study of nutrient knowledge and consumption. Multi-sponsor Surveys, Princeton, N.J. www.multisponsor.com.
MSI. 2011a. The 2011 Gallup study of dinner.
MSI. 2011b. The 2011 Gallup study of Hispanic nutrition and supplement use.
MSI. 2012a. The 2012 Gallup study of probiotic & prebiotic consumers.
MSI. 2012b. The 2012 Gallup study of children’s nutrition & eating habits.
NASFT. 2012. Specialty food consumers. Oct. National Assn. for the Specialty Food Trade, New York, N.Y. www.nasft.org.
NMI. 2012. Health and wellness database. The Natural Marketing Institute, Harleysville, Pa. www.nmi.com.
NPD. 2011. A look into the future of eating. The NPD Group Inc., Port Washington, N.Y. www.npdfoodworld.com.
NPD. 2013. Boomers increase restaurant visits while millennials cut back. Press release, Jan. 15.
NRA. 2012. What’s hot 2012 survey. National Restaurant Assn., Washington, D.C. www.restaurants.org.
NRA. 2013. Restaurant forecast.
Packaged Facts. 2011. Kids food and beverage market. July. Packaged Facts, Rockville, Md. www.packagedfacts.com.
Packaged Facts. 2012a. How we eat: retail and foodservice opportunities. July.
Packaged Facts. 2012b. Moms as food shoppers. Nov.
Packaged Facts. 2012c. Targeted health & wellness foods and beverages. Feb.
Packaged Facts. 2012d. Hispanic foods and beverages in the U.S. Nov.
Packaged Facts. 2013a. Energy drinks and shots in the U.S. Jan.
Packaged Facts. 2013b. Weight management trends in the U.S. March.
Technomic. 2011. The flavor consumer trend report. Technomic Inc., Chicago, Ill. www.technomic.com.
Technomic. 2012a. The retailer meal solutions consumer trend report.
Technomic. 2012b. The generational consumer trend report.
Technomic. 2012c. The consumer trend snacking report.
Technomic. 2012d. The consumer breakfast trend report.
Technomic. 2012e. The healthy consumer trend report.
Technomic. 2012f. Ethnic global flavor trends.
U.S. Census. 2010. U.S. Census Bureau, Washington, D.C. www.uscensus.gov.
Wyatt, Lyons, S. 2013. The state of the snack food industry. Presented at SNAXPO, Snack Food Assn. Annual Meeting, Tampa, Fla., March 16-19.