
Touring a World of New Product Innovation
A widespread avoidance of food additives, a rapidly growing middle class aspiring to Western ways, and just about anything ethnic are among the trends driving new product innovation around the globe.

Although there are differing local food preferences, when it comes to trends and new product innovation in the $5.3 trillion global food and beverage industry, the world has become a much smaller place (IDDBA 2015). More than ever before, the consumer drivers of food selection, culinary cues, nutritional priorities, and lifestyle-driven packaging needs are following a similar path.
After taste, the top global new food product purchase drivers include affordability, convenience, brand recognition, and novelty; affordability, health/wellness, convenience, and environmental compatibility are the most important new product needs/desires (Nielsen 2015a).
More than half (57%) of global consumers purchased a new food or beverage during their last grocery shopping trip. Those in developing markets are most inclined to try new products (Nielsen 2015a). In 2014, bakery, followed by snacks, dairy, processed fish, meat and egg products, prepared meals, and desserts were the most active new product categories, according to Mintel (IDDBA 2015).
With the global middle class growing by 70 million people each year, food marketers will enjoy an unprecedented period of aspirationally driven buying behavior as consumers crave more Western-style, culinary-centric, and convenience-driven foods (Nielsen 2013, 2015a).
Although half (54%) of global consumers still believed their country was in a recession in the third quarter of 2014, global economic consumer confidence has risen steadily over the past two-and-a-half years. Countries with the highest levels of consumer confidence include, in descending order, India, Indonesia, the Philippines, Thailand, the United Arab Republic, China, and the United States (Nielsen 2014a).
Fifty-seven percent of global consumers rated their personal finances as good/excellent in 2015; only 13% claimed “little spare cash on hand” (Nielsen 2014a). After the economy and job security, health, and work/life balance were the top global consumer concerns in 2014, followed by war/terrorism. In the Asia-Pacific region, health concerns have replaced the economy as consumers’ biggest worry (Nielsen 2014a).
Demographically, a dramatic increase in the number of single adults living alone, smaller family households (average size of 3.6 persons in 2015), greater urbanization, more working women, and an aging population will continue to demand innovative food product approaches (Boumphrey 2015).
China, India, Japan, Western Europe, Australia, Canada, and the United States top the list of countries with the largest number or highest percentage of older consumers (Nielsen 2014b). Global life expectancy is now 71.3 years; 138 million babies were born in 2014 (Boumphrey 2015).
About one-third of the population in South America, Asia, and the Middle East/Africa are Millennials; in Western Europe, Australia, and North America, one-quarter are Millennials (Innova 2015a).
One-third of global consumers planned to spend more on away-from-home meals in 2015 (Nielsen 2014a). McDonald’s, with sales of $52.3 billion, remains the world’s largest restaurant chain, followed by KFC, $19.3 billion; Burger King, $8.4 billion; Starbucks, $8.3 billion; Subway, $7.8 billion; Pizza Hut, $6.1 billion; and Tim Hortons, $6.0 billion (Technomic 2015).
After the United States, Russia, Italy, South Korea, China, France, and Thailand are the largest convenience store markets (Dimakakos 2014). European-style food halls that offer fresh-prepared, gourmet products already are enjoying a warm welcome in North America (Datassential 2015a).
--- PAGE BREAK ---
What’s Cooking?
Global demand for quicker/easier food preparation, ready meals/take-away meals, restaurant-style recipes, and heartier mini-meal options continues to skyrocket. In 2014, 27% of global consumers bought a new food or drink because it was more convenient; in Latin America, 38% did so (Nielsen 2015a).
More than half (55%) of global consumers still regularly cook a meal from scratch; 38% do so using preprepared items. Eight in 10 typically spend at least 30 minutes making dinner; globally, 60% of moms with kids at home spend more time making dinner (Euromonitor 2014a).
Around the globe, Chinese consumers (71%) are most likely to regularly cook their evening meal from scratch using fresh/raw ingredients. Brazilians are the most likely to order home delivery or take-away meals from supermarkets/restaurants to eat at home for dinner (25% versus 16% of global consumers overall). Fewer than one-third of global consumers prepare a meal to be carried to work or school (Euromonitor 2014a).
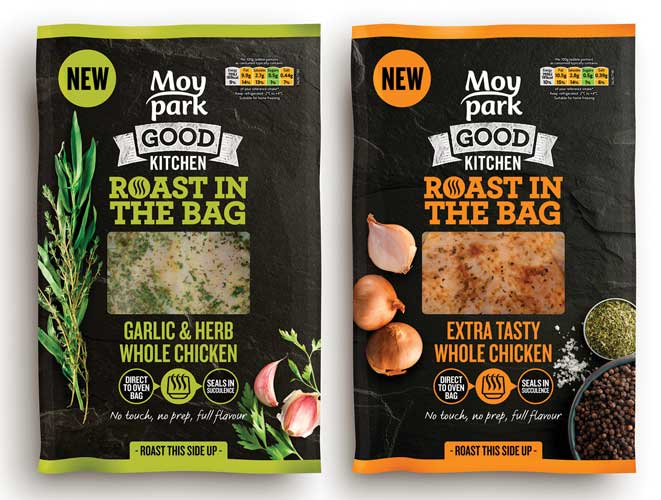 In the Netherlands, Nestlé’s Maggi Tender & Spicy uses seasoning-infused papyrus paper to ensure perfectly prepared chicken in a pan. In the United Kingdom, the Moy Park Good Kitchen line of seasoned fresh chicken roasts self-baste and cook in the bag.
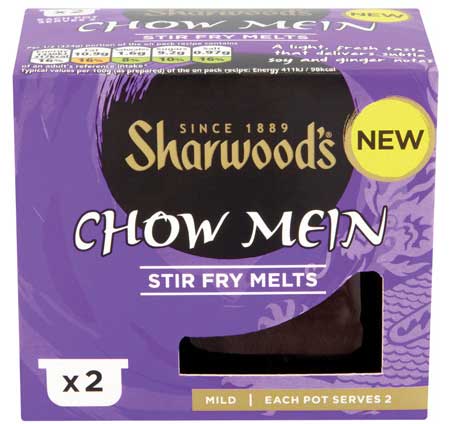 Asian-flavored Sharwood’s Stir Fry Melts make seasoning stir-fry dishes easier; Darégal Gourmet Ltd.’s OneDoze spice/herb sachets are designed specifically for steamed vegetables. Holy Lama Naturals’ Spice Drops are concentrated natural spice liquid extracts.
At the United Kingdom’s 2015 Natural Food Show, Larchwood Foods’ Mr. Hugh’s brand introduced orange- and vanilla-flavored rapeseed baking oils; the Anglesey Sea Salt Co. offered Oat Smoked Water to add a touch of smokiness to stocks, pastry, and bread. In Italy, the Polenghi Group launched a 100% natural lemon juice spray.
Mushroom marmalades, vegetable pestos, and umami butter (e.g., Something Fishy Irish Shellfish Culinary Butter) are other new cutting-edge trends.
With one-third of global consumers purchasing ready meals and the global frozen food market projected to reach $156.4 billion by 2020, restaurant-quality fresh chilled and frozen meals will be in high demand (Euromonitor 2014a; Persistence 2015).
Fresh and frozen kebab kits (e.g., Samia Kit Pour Kebab in France), fresh Asian meal kits, and vegetable terrine, tangine, and casserole kits are among the hot make-at-home meal trends. In Germany, Mars Foods’ Mirácoli Specialty Lasagna Kit contains all the ingredients except the meat.
In Australia, tuna forms the basis of Safcol’s line of ethnic ready-to-eat portable pouch meals/snacks. In Germany, Unilever’s Rűgenwalder Műhle vegetarian “ham and spicy” meatballs come in a grab-and-go microwaveable cup. The United Kingdom’s House of Dorchester’s BBQ Fondue Mixed Melting Chocolates is a dessert fondue prepared in its foil pack on a cooling grill.
In the Czech Republic, Hügli offers a cupcake that is microwaved in the cup; Aveve’s Cake in a Cup contains a porcelain cup and powder and requires only the addition of water to prepare.
From spiralized fresh vegetable ribbon pasta (e.g., carrot spaghetti) in the United Kingdom to crispy coconut curl snacks (sliced from real coconut) in Thailand, swirls and curls are another new direction. Substituting vegetables for carbs (e.g., cauliflower couscous) is a new idea taking root in the United Kingdom (Innova 2015b).
The global market for breakfast on the go was estimated at $48.2 billion in 2013; China, the United States, Mexico, Brazil, and Russia are the largest markets. Three-quarters of global consumers prepared their breakfast in 15 minutes or less last year (Euromonitor 2014b).
In the United Kingdom, Yowk portable fresh soft-boiled egg is packaged with an egg cup, salt/pepper, breadsticks, and a spoon with teeth for cracking/eating. Japan’s Ultramix Pancake Bitter Choco delivers the ultimate chocolate pancakes.
In the Middle East and Africa, 62% of adults ate a snack as a morning meal replacement in 2014, 58% did so in Latin America, 55% in Asia-Pacific, 48% in North America, and 44% in Europe (Nielsen 2014a). Breakfast biscuits, meal replacement beverages, nutrition bars, yogurt, and cereal in a cup are enjoying brisk sales for early morning consumption. Global breakfast cereal sales will top $43 billion by 2019 (Transparency 2014).
Globally inspired breakfast items (e.g., Asian-flavored syrups, coconut milk pancakes) and traditional ethnic breakfast foods, (e.g., huevos rancheros, shakshuka, ashta) are among the hot U.S. culinary trends for 2015 (NRA 2014).
--- PAGE BREAK ---
Munching Madness
Global snack sales reached $374 billion for the year ended March 2014, up a mere 2%. While Europe and North America accounted for the majority of the market, sales grew fastest in Latin America, where they were up 9%; Africa/Middle East, +5%; and Asia-Pacific, +4% (Nielsen 2014c).
Confections are the largest snack category in Europe ($46.5 billion) and the Middle East/Africa ($1.9 billion). Salty snacks top the list in North America ($27.7 billion), refrigerated snacks in Asia-Pacific ($13.7 billion), and cookies/cakes in Latin America ($8.6 billion) (Nielsen 2014c; Figure 1).
Chocolate and fresh fruit are the world’s favorite snacks, consumed by 60% of consumers every month. One-half of adults snack on vegetables, cookies/biscuits, bread/sandwiches, or yogurt; 40% snack on cheese, potato chips/tortilla chips/crisps, or nuts/seeds. One-third chew gum and/or eat ice cream/gelato. One-quarter regularly snack on popcorn, crackers/crisp breads, or cereal (Nielsen 2014c).
Dumplings and instant noodles are among mini-meal snacks with high sales potential longer term; they were consumed by one-quarter of global consumers in 2014 (Nielsen 2014c). The global snack bar sector topped $13.2 billion in 2014 (Bizzozero 2015).
Sales of refrigerated snacks (e.g., yogurt, cheese snacks, pudding) jumped 6.4% in Asia-Pacific last year; sales of dips and spreads, including salsa and hummus, were up 6.8% (Nielsen 2014c). Savory items (e.g., crackers, rice cakes, and pita chips) were among the fastest-growing snacks last year, up 21% in Latin America; meat snacks grew 25% in the Middle East/Africa (Nielsen 2014c).
In Australia, Poptopia from Green’s General Foods is a cheese-flavored, crispy-coated baked popcorn. Popcorn seasonings, baked/fried real fruit, vegetable chips (e.g., plum chips in Indonesia), and more-natural flavor descriptors (e.g., Meridian Foods’ Dry Roasted Peanut Butter in the United Kingdom) are other new snack directions.
In 2014, 64% of global consumers ate snacks to improve their mood, 61% for an energy boost, 44% to reduce stress, and 38% to manage weight (Nielsen 2014c).
Flavored Forecast
One in three Americans tried a new ethnic cuisine last year. Half of adults have eaten Mediterranean, Japanese, Spanish, Belgian, German, French, Greek, and/or Caribbean fare; just under half have had sushi/sashimi, Middle Eastern, Southeast Asian, or Thai cuisine (NRA 2015). Ethnic fusion, authentic ethnic, regional ethnic, Peruvian, Southeast Asian, and Korean are the current hot ethnic culinary trends in the United States (NRA 2014).
Panzanella; breaded/fried risotto balls (arancini); dry-cured speck (a cold-smoked ham); spreadable salamis; grilled fettunta bread; and gnocchi, pappardelle, and corzetti pastas are among the fast-emerging Italian food trends (Datassential 2013).
Pizza varieties popular in Australia, such as tandoori pizza, triple- and double-decker versions, bacon-and-egg pizza, dessert pizza, and French Alsatian pizza, are likely to grab the attention of U.S. food marketers (Datassential 2015b). In the Netherlands, Dr. Oetker offers hybrid mini pizza-quiches.
Global street foods, (e.g., kebabs, dim sum, empanadas) are among the hot U.S. appetizer and center-of-the-plate trends for 2015 (NRA 2014). Seafood frites (e.g., Belgian moules-frites), croquettes, charcuterie plates, poutine, gnocchi, cheese toasts, tempura, ethnic meatballs, tostones (fried plantains), and Asian lettuce wraps are among the appetizers from around the world that show high sales potential in a variety of markets (Datassential 2015c).
Harissa, aji, gochujang, yuzu, togarashi, peri peri, nut butters, savory jams, stouts, and za’atar are the new global flavors set to rival sriracha in United States this year (Datassential 2015a). Ethnic sandwiches (e.g., banh mi, tortas, cemitas, Cuban) are among the hot U.S. sandwich trends for 2015; such ethnic sandwiches are of interest to 41% of consumers along with new ethnic sandwich carriers (e.g., naan, bao buns, arepas, paratha, challah, and piadina) (Datassential 2015a).
Breads that deliver a full serving of vegetables per slice, such as George Weston Foods’ Country Harvest Veggie Breads in Canada, and ethnic rolls are other new bakery trends. Four in 10 U.S. adults buy Italian breads; 36%, European loaves (e.g., pumpernickel); 35%, Middle Eastern; 29%, ethnic egg-based (e.g., challah, brioche); and 27%, Indian (Mintel 2014).
--- PAGE BREAK ---
Ethnic flours (e.g., fufu, teff, cassava) are among the hot U.S. culinary trends for 2015 (NRA 2014). In Latin America, sales of high-fiber breads are projected to increase by 55% between 2013 and 2019 (IDDBA 2015). Taleggio, burrata, pecorino Romano, Hispanic Cotija, and queso fresco were among the fastest-growing cheeses in U.S. restaurants last year (IDDBA 2015).
Passion fruit, cherimoya, dragon fruit, horned melon, durian, starfruit, and mango-steen are among the fruits from around the world that are getting attention in the United States (Frieda’s 2015).
Gelato, churros, sweet empanadas, panna cotta, Peruvian picarones, Mexican chocolate, and budino (a thick Italian pudding) are among the desserts moving into the spotlight; 43% of U.S. diners are interested in trying gelato (Datassential 2015d).
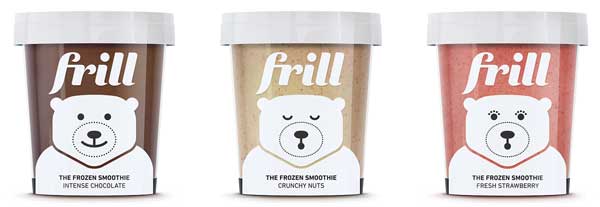 In France, Unilever offers Charles & Alice intensely flavored fruit mousses. In Italy, Zendegii’s Frill is a frozen smoothie packed in an ice cream container.
Indian lassi, agua fresca, aranciata, limonata, Mexican hot chocolate, hot broth/bouillon, and sour beverages (e.g., drinking vinegar) are ethnic drinks that appear to be gaining sales momentum (Datamonitor 2015e). Euromonitor projects that sour milk drinks will have the highest compound annual growth rate (7.4%) within the global dairy category through 2018, followed by spoonable yogurt at 7.2%; flavored milk drinks, 6.6%; drinking yogurt, 5.1%; and nondairy alternative milks, 4.7% (IDDBA 2015).
Icelandic skyr strained yogurt and goat milk yogurts are among the new yogurt tastes and textures. Spices (e.g., cardamom, cinnamon), savory additives (e.g., olives, cilantro), and vegetable flavors (e.g., tomato, beet) are other yogurt trends from around the globe (IDDBA 2015).
Fortified and high-protein milks are becoming a global phenomenon. Arla Foods’ Big Milk is the first fresh milk enriched with nutrients in the United Kingdom. In the Philippines, Nestlé’s Nido FortiGrow is fortified to “help your child be mind and body ready for school.”
Pickwick IceTea in the Netherlands is a refreshing tea soda. Also in the Netherlands, Unilever introduced new flavors inspired by high tea (e.g., blueberry muffin, strawberry shortcake). Nestlé markets Barista-Style coffee in Australia. The number of U.S. foodservice outlets that featured Cuban coffee jumped 39% in 2014 (Datassential 2015e).
Portugal, Greece, and Eastern Europe are among the up-and-coming global wine regions. Lesser-known global spirits (e.g., Japanese shochu, Brazilian cachaça, and French calvados) are also grabbing consumer attention (Datassential 2015f).
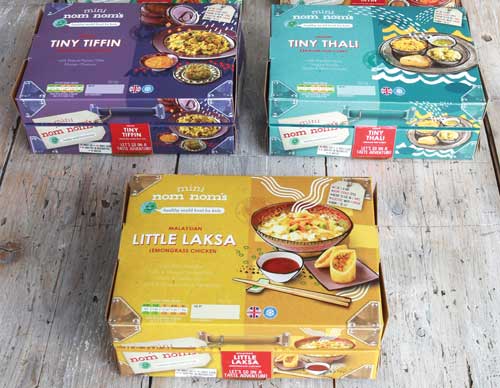 Cadbury introduced Dairy Milk Marvellous Creations Jelly Popping Candy Ice Cream for kids in Ireland. In the United Kingdom, Mini nom nom’s offers healthy, ethnic-inspired ready meals for kids. In Australia, Annabel Karmel Group’s Chicken & Apple Bites are aimed at little eaters aged 1–4.
Clean and Clear
Among global consumers, fresh, natural, and minimally processed are the most desirable food attributes. Nearly six in 10 (57%) say they’re eating more natural fresh foods; 40% are consuming fewer processed foods (Nielsen 2015b).
Asia, the Middle East/Africa, and Europe top the regions where consumers are making an effort to eat more fresh foods. After North Americans, Asian, Latin American, and European consumers are the most likely to be making an effort to cut back on processed foods (Nielsen 2015b).
--- PAGE BREAK ---
All-natural ingredients and those without genetically modified organisms (GMOs) top the list of 27 health attributes that global consumers consider very important in their food and drink purchase decisions, with 43% of consumers ranking them that way. No artificial colors or flavors, made from vegetables/fruits, and made with natural flavors are other prominent clean label demands (Nielsen 2015b; Figure 2).
The use of artificial ingredients, including colors, flavorings, and non-nutritive sweeteners, has been declining in all parts of the world over the past five years (Mattucci 2015). Monk fruit is a natural sweetener that is getting attention internationally (Innova 2015a).
Concern about GMOs is highest among Chinese consumers, with 71% expressing concern. They are followed by Russians, 61%; Brazilians, 55%; Germans, 49%; and UK consumers, 28% (HealthFocus 2014). GMO-free is much less important in Latin America, ranking 14th among 27 food attributes considered; there is also less concern about artificial colors and flavors (Nielsen 2015b).
Having easily recognizable/familiar ingredients on the label is important to more than two-thirds of consumers in France, the United Kingdom, China, and Australia, and to more than half in Germany and Brazil (Innova 2015c). In Australia, Kraft Natural Crunchy Peanut Butter’s ingredient list reads simply “100% nuts.”
Global natural and organic food sales are projected to reach $140 billion by the end of 2015 (NBJ 2014). Natural and organic global food/drink sales increased 24% and 28%, respectively, over the past two years (Nielsen 2015b).
The United States accounted for 53% of global natural/organic sales; Western Europe, 30%; Asia, 5%; Latin America, 4%; Canada and Australia/New Zealand, each 3%; the Middle East and Eastern Europe/Russia, each 1% (NBJ 2014).
Twenty-one percent of global consumers say it is very important for a food to be gluten-free. North and South America and Australasia continue to dominate this free-from segment; 9.4% of all new global food and beverage claims tracked by Innova Market Insights in 2014 had a gluten-free claim (Innova 2015d).
A growing number of products are making no hormones/no antibiotics claims; 4.8% of all yogurt launches globally and 6.0% of poultry introductions featured a hormone- and/or antibiotics-free claim in 2014 (Innova 2015d).
Health concerns and social movements for the humane treatment of animals are encouraging consumers worldwide to pursue a flexitarian eating approach and to reduce their consumption of meat. Not surprisingly, a new premium fresh meat/poultry category that is said to be ethically sourced and raised is emerging. In Australia, it is described as “happy” meat (Euromonitor 2015).
Beyond local foods, claims that confirm a food is made or grown in one’s own country are resonating with global consumers. MasterFoods in Australia touts claims such as “100% Australian grown;” in the United Kingdom, Hodmedod’s launched the first ever, ready-to-eat British-grown red haricot beans.
In 2014, 9.3% of new global product launches featured vegetarian claims, and 2.4% had vegan claims. The number of new meat alternative food product launches is increasing at an average rate of 18% per year around the globe (Innova 2015d).
In the United Kingdom, Goodlife Foods offers Nut Burgers. Alternative milks (e.g., macadamia nut, flaxseed) are among the hot alternative beverage trends.
One-third of global consumers say that sustainability/fair trade is very important in their food/beverage purchasing decisions. Demand is highest in Asia-Pacific and Latin America; Gen Z and Millennial consumers are most likely to be influenced by sustainable fare (Nielsen 2015b).
Healthy Does It
Global sales of healthy foods and beverages outpaced indulgent food sales in 2014. Growth of better-for-you products is strongest in developing regions. From 2012 to 2014, sales grew 20% in Africa/the Middle East, 16% in Latin America, and 15% in Asia-Pacific (Nielsen 2015b).
Fortified/functional foods—with sales up more than 9% in 2014—and naturally/inherently nutritious foods, up more than 8%, lead global growth in the health/wellness food category. Organic foods grew 6% and better-for-you foods, 4% (Euromonitor 2014c).
Fiber tops the list of nutrients consumers say are very important, sought by 36% of consumers globally, followed by high in protein (32%), whole grain (30%), fortified with calcium (30%), vitamins (30%), and minerals (29%) (Nielsen 2015b).
Fortification is in very high demand in Latin America and Africa/the Middle East; Latin America exceeds the global average for the importance of high fiber by 23%, calcium by 21%, vitamin-fortified by 21%,protein by 18%, and whole grains by 17%. In Africa/the Middle East, high calcium exceeds overall global importance by 14%; fiber, protein, and vitamin-fortified foods, by 13% (Nielsen 2015b).
Innova noted 24% growth in new global high-protein product launches using plant-based proteins in 2014 versus 2013. Although soy protein is the leading protein used, alternative plant proteins are demonstrating significant potential (Innova 2015a).
--- PAGE BREAK ---
More than one-third (38%) of global consumers say it’s very important that foods are low in cholesterol; low in salt is cited by 33%; low sugar, 32%; low fat, 30%; no high fructose corn syrup, 26%; caffeine-free, 23% (Nielsen 2015b). Avoidance behavior is particularly important in Latin America. Demand for products that are low/no cholesterol is 25% above the global average, and the percentages are similar for products that are low/no fat and low salt/sodium (Nielsen 2015b).
Functional food sales reached $118 billion globally in 2013. The United States accounted for 49% of sales, followed by Western Europe at 33%; Asia, 6%; Canada, 4%; Eastern Europe/Russia, 2%. Beverages remain the largest functional category by far, followed by breads/grains, snacks, and packaged foods (NBJ 2014).
Nearly 80% of global consumers say they are actively using foods to forestall health issues and medical conditions such as obesity, diabetes, high cholesterol, and hypertension (Nielsen 2015b). General well-being, weight management, digestive health, energy boosting, and endurance have been the leading functional food/beverage product health positionings over the past five years (Euromonitor 2014c).
Globally, sports nutrition is projected to be the fastest-growing health category through 2018. Chinese, Indian, and Brazilian consumers are most likely to exercise at a gym (Euromonitor 2014d). Sales of sports drinks increased 8% globally in 2014, rising in all regions except Europe, where they fell by 6%. Over the past two years, sports drinks sales increased 51% in Asia-Pacific, 25% in Africa/the Middle East, and 10% in Latin America (Nielsen 2015b).
Half (49%) of global consumers believe they are overweight; half (50%) are trying to lose weight (Nielsen 2015b). Among those who are changing their diet to lose weight, 25% are using a low-carb diet; 19% use a nonspecified diet plan; and 11% opt for commercial slimming programs. The use of commercial slimming programs in Asia-Pacific and Africa/the Middle East exceeds the global average (Nielsen 2015b).
When it comes to healthy specialty food and beverage ingredients, botanicals/bioactives, cultures, polysaccharides/oligosaccharides, protein, and vitamins/minerals are projected to enjoy the highest growth through 2018 (Euromonitor 2014c).
The global food and beverage retail market for products containing probiotics is expected to reach $35 billion in sales by 2018, up from $25 billion in 2013 (Datamonitor 2014), indicating growing awareness of their potential to deliver health benefits.
The author thanks Innova Market Insights (innovadatabase.com) for access to its Innova Food & Beverage Database and newsletters.
A. Elizabeth Sloan, PhD, a professional member of IFT and contributing editor of Food Technology, is president, Sloan Trends Inc., Escondido, Calif. ([email protected]).
References
Bizzozero, J. 2015. “Clean Label: Raising the Bar.” Food Product Design, May 26. http://www.foodproductdesign.com/blogs/trending-foods/2015/05/clean-label-is-here-to-stay.aspx.
Boumphrey, S. 2014. “The World in 2015: Analytical Insight from Euromonitor International. Economic and Consumer Insight,” Dec. 15. euromonitor.com.
Datamonitor. 2014. Probiotic Consumer Trend Report. Feb. datamonitor.com.
Datassential. 2013a. “Viva Italia! World Bites.” Datassential MenuTrends. Aug. datassential.com.
Datassential. 2015a. “Trends to Watch.” QSR 190(1): 4-19.
Dataessential. 2015b. “World Bites.” Aug.
Datassential. 2015c. “The Keynote Report: Appetizers.” March.
Datassential. 2015d. “The Keynote Report: Desserts.” Jan.
Datassential. 2015e. “Food Bytes: Nonalcoholic Beverages.” May.
Datassential. 2015f. “Global Spirits A World of Brand New Flavors.” March.
Dimakakos, D. 2015. Challenges and Opportunities for Food Manufacturers.” Presented at Tuttofood Milano World Food Exhibition, Milan, Italy, May 11–15.
Euromonitor. 2014a. “Cultural Shifts Favor Shortcuts in Meal Preparation.” May 19. www.euromonitor.com.
Euromonitor. 2014b. “Breakfast On-the-Go.” Aug.
Euromonitor. 2014c. “Health and Wellness Performance Overview.” March.
Euromonitor. 2014d. “Consolidation Pushes Ahead in Sports Nutrition.” July 10.
Euromonitor. 2015. “The New Premium Fresh Meat in Australia.” Sept. 5.
Frieda’s. 2015. “Eat One Fruit a Day that Scares You.” Los Alamitos, Calif. frieda’s.com
HealthFocus. 2014. International Consumer Trend Survey. HealthFocus International, St. Petersburg, Fla. healthfocus.com.
IDDBA. 2015. “What’s in Store.” International Dairy-Deli-Bakery Assoc. Madison, Wis. iddba.org.
Innova. 2015a. “Top 10 Trends.” Presented at IFT16, Institute of Food Technologists, Chicago, Ill., July 11–14.
Innova. 2015b. “Spiralizing: The Latest Fad or Trend.” Innova Market Insights newsletter. June. innova-food.com.
Innova. 2015c. “Clean Label and the Consumer.”
Innova. 2015d. “The Rise of “Free From.”
Mintel. 2014. “Bread and Bread Products—U.S.” Sept. Mintel Group Ltd., Chicago, Ill. mintel.com.
Mattucci, S. 2015. The Demise of Artificial: Trends in Colors, Sweeteners, and Flavors.” Mintel Group Ltd.
NBJ. 2014. “The Lowest Common Denominator.” Nutrition Business Journal XVIII: (11/12): 4–19.
Nielsen. 2013. “The Middle Class: State of Mind or Share of Wallet?” Oct. Nielsen, Schaumburg, Ill. nielsen.com.
Nielsen. 2014a. “Consumer Confidence Concerns and Spending Intentions around the World.” Quarter 3.
Nielsen. 2014b. “The Age Gap: As the Global Population Skews Older, Its Needs Are Not Being Met.” Feb.
Nielsen. 2014c. “Snack Attack: What Consumers Are Reaching for Around the World.” Sept.
Nielsen. 2015a. Looking to Achieve New Product Success? New Product Innovation Survey. June.
Nielsen. 2015b. “We are What We Eat: Healthy Eating Trends around the World.” Jan.
NRA. 2014. What’s Hot Chef Survey. National Restaurant Assoc., Washington, D.C. restaurant.org.
NRA. 2015. “Global Palates: Ethnic Cuisines and Flavors in America.”
Persistence. 2015. “Global Frozen Food Market Value to Reach US $156.4 billion by 2020.” Persistence Market Research. Press release, Feb. 13. foodingredients.com.
Technomic. 2015. “2015 Technomic Top 500 Chain Report.” Technomic. Chicago, Ill. technomic.com.
Transparency. 2014. “Global Breakfast Cereal Market to Reach $43.2 Billion by 2019.” Press release, Feb. 14. Transparency Market Research, Albany, N.Y. transparencymarketresearch.com.