

Prioritizing Premium
Healthy indulgence, more specific health claims, and pure pleasure are driving astronomical growth in the specialty food and beverage sector, where discriminating consumers are willing to spend extra to purchase products that are important to them.
Article Content
Today’s food and beverage consumers will spare no expense and scour a wide variety of channels to get the sophisticated culinary experiences, added convenience, or personalized health benefits they are seeking. They are even trading down on staples to be able to afford the premium products that are most important to them (IDDBA 2018). Forty percent of natural food channel shoppers were on a food budget last year (Packaged Facts 2017a).
Even consumers in less affluent households, with annual incomes of from $25,000 to $74,900, regularly buy an average of 6.5 gourmet specialty categories, which include cheese; ice cream; chocolate; coffee/tea; oils/vinegars; cookies, cakes, brownies, and pies; pasta/sauce; and meat, poultry, and seafood (SFA 2016).
At the same time, a shift from brand-driven product purchase decisions to attribute-driven food choices is bringing a new form of fusion to the food/beverage industry, simultaneously providing consumers with solutions to everyday needs as well as indulgent and/or exciting experiences (IRI 2017, 2018a).
Globally, premium meats and seafood top the list of items—just ahead of electronics and clothing—that consumers are willing to trade up; premium meats and seafood rank in the top five in Southeast Asia, Latin America, and Africa/Middle East. Thirty percent of global consumers say they are willing to pay more for premium dairy products (Nielsen 2017a).

Paying the Price
The Hartman Group defines premium products as foods and beverages that deliver experiences built on uncommon product attributes that reshape the definition of quality (e.g., pasture-raised or fair trade) (Watrous 2017). Moreover, Hartman projects U.S. premium foods and beverages will enjoy growth of 10% per year over the next decade. Culinary pleasure; performance; more precise customized health/wellness claims; and natural, organic, and nutrient-dense will be among the top premium market drivers (Watrous 2017).
One-third (35%) of those in households earning over $100,000 are expected to buy more premium foods and drinks in 2018 versus 26% of those with incomes ranging from $35,000 to $99,000 and 17% of those with incomes of less than $35,000. Seniors/retirees, followed by Baby Boomers and older Millennials, will be the most likely to do so (IRI 2018b).
Eighty-five percent of the top 20 best-selling new foods/beverages in 2017 carried a premium price (IRI 2018a). (See the top 10 new product best sellers in Figure 1.)
Healthier-for-you indulgences were prominent among 2017’s best-selling foods and drinks; 53% of best sellers offered indulgent experiences. Protein also continued to be a driving force for new products last year; 36% of the top 76 best sellers touted protein (IRI 2018a).

Figure 2. IRI 2018a
Figure 2. IRI 2018a
Balancing healthfulness and indulgence is a growing megatrend. Just over one-third of consumers (36%) say they try to eat healthfully half the time and eat whatever they want the rest of the time. Another 36% report that they are committed to healthful eating 80% of the time (IRI 2018a). (See Figure 2 for more details about how consumers approach eating, including a comparison of Millennial behaviors with those of the general population.)
Emerging brands and small companies (sales < $1 billion) accounted for one-quarter of best-selling new food and beverage product sales in 2017, up from 12% in 2014. Since 2012, $15 billion in sales of best-selling new foods and drinks have shifted from larger companies to smaller players (IRI 2018a).
Forty percent of the top-performing foods and drinks in 2017 were new brands. Just five years ago, nine out of 10 best sellers were line extensions versus 60% in 2017. The dessert category, followed by breakfast and dinner solutions, had the highest number of best-selling new products (IRI 2018a).
Gourmet/specialty foods continue to outpace their traditional counterparts in all 61 categories monitored by the industry, reaching sales of $127 billion in 2016, up 15% versus 2014 (SFA 2017). Mintel predicts the specialty food market will grow 8% per year through 2021, at which point it will represent 18% of all food/beverage sales (Watrous 2018).
In 2017, 115 million U.S. adults were classified as cooking enthusiasts by Mintel (2017). Nearly half of adults (48%) describe themselves as a foodie, 29% consider themselves “seriously involved,” and 17% classify themselves as “gourmets” (Packaged Facts 2018a).
Two-thirds of consumers really enjoy trying new international foods; 55% enjoy eating gourmet, artisan, or “foodie” foods; and 47% prefer foods with a lot of spices (Packaged Facts 2018a).
Free from artificial ingredients, high in healthy components, and minimally processed have the most influence on foodies’ food choices (IFIC 2017). Interest in celebrity chefs, iconic brand crossovers, and restaurant-branded foods and drinks continues to run high. Jamie Oliver, Wolfgang Puck, Rachael Ray, Gordon Ramsey, and Mario Batali were the most successful U.S. chefs in 2017, based on estimated net worth (Hom 2018).
Explosive growth in home entertaining continues to fuel the specialty food market. The number of meals eaten at another person’s home jumped 19% in 2016 (NPD 2017). One-third of adults buy gourmet items for special occasions; one in five buys them to have on hand for unexpected guests (SFA 2016). Over one-quarter are interested in complete upscale meal solutions/kits for holidays and special dinner parties (FMI 2017a).
Nearly half (46%) of consumers say they would make their deli their go-to catering source if a chef was creating the meals (Culinary Visions Panel 2017). Gourmet frozen snacks/appetizers accounted for 10% of sales in the frozen appetizer category (SFA 2017). Lundberg Farms offers a line of Grainspirations frozen appetizers in varieties like Arancini Black Rice.
Not surprisingly, consumers are driving demand for specialty products across nontraditional and/or less expensive channels. One-third already buy specialty foods at Walmart and one in 10 at convenience stores (SFA 2017).
At the same time, specialty stores are reorganizing their assortments to better meet contemporary marketplace needs. Six in 10 gourmet food stores offer a deli/prepared food department, 48% have a fresh meat/seafood department, 41% have a fresh produce department, and 28% feature an on-premise café. Among the 10 fastest-growing specialty food categories, seven of them are refrigerated or frozen (SFA 2016).
Specialty Superstars
Six in 10 consumers are regular specialty food buyers. Millennials are most likely to regularly purchase specialty fare. Men buy slightly more gourmet items than women (SFA 2017).
With parents spending 48% of their food dollars on specialty foods, more sophisticated kid-friendly fare is a missed opportunity (SFA 2016). Healthful kids’ meals rank sixth among the overall hot culinary trends for 2018, ethnic-inspired kids’ foods are 16th, and gourmet items in kids’ meals are 18th. Whole grain and grilled items are other important kids’ meal trends (NRA 2017).
Cheese/cheese alternatives is the largest specialty food category, with sales of $4.4 billion in 2016, followed by meat, poultry, and seafood, $3.7 billion; chips, pretzels, and snacks, $3.6 billion; coffee/cocoa (not ready-to-drink), $3.2 billion; bread/baked goods, $2.8 billion; chocolate/confectionery, $2.2 billion; yogurt/kefir, $2 billion; frozen lunch/dinner entrées, $2 billion; refrigerated lunch/dinner entrées, $1.9 billion; and gourmet condiments, dressings, and marinades, $1.9 billion (SFA 2017).
Waters, refrigerated and frozen lunch/dinner entrées, frozen desserts, eggs, ready-to-drink (RTD) coffee/tea, jerky/meat snacks, and wellness bars are among the fastest-growing specialty food categories. Jerky/meat snacks grew 85% in unit sales; refrigerated juices and functional beverages each grew by 35% (Watrous 2018).
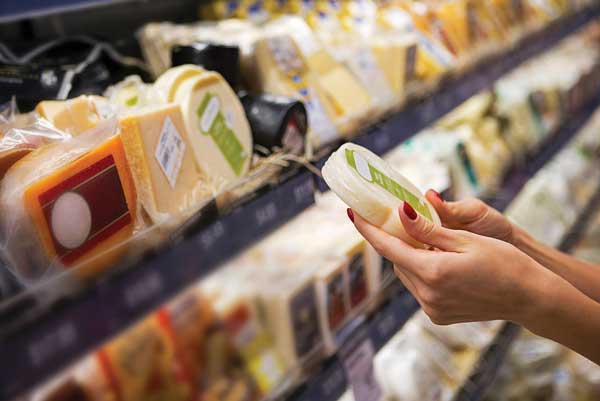 Specialty cheese sales grew five times faster than the cheese category overall in 2017. Oaxaca, manchego, Cotija, fontina, Gournay, butterkase, queso de papa, Jarlsberg, and panela are the fastest-growing specialty cheeses (IDDBA 2018).
French full-fat yogurts/puddings, farmers/mixed milk cheeses, and flavored/grass-fed butters are other emerging specialty segments.
Meat with special production claims, such as organic, grass-fed, or antibiotic-free, had dollar sales gains of 26% and volume growth of 38% in 2017, per IRI (FMI 2018a). IRI reports sales of meat labeled “no antibiotics ever” reached $2.9 billion in 2017; antibiotic-free represents 12% of all poultry sales (Lyons Wyatt 2018a).
Two-thirds of shoppers say humanely raised and/or antibiotic-/hormone-free claims make them most likely to purchase specialty meat/poultry. Other influential descriptors include all natural, vegetarian fed, grass fed, free range, and organic (FMI 2018a).
 New cuts of meat (e.g., oyster steak, Vegas strip steak, and merlot cut) are the top culinary trend for 2018 (NRA 2017). Fresh value-added meats (e.g., pinwheels), Hispanic cuts of meat, heritage meats, Australian grass-fed lamb, and specific breeds (e.g., Berkshire pork) remain hot specialty trends. Frozen Bravado Burgers by Jensen Meat Co. are made with chuck and brisket.
About four in 10 consumers occasionally buy meat and poultry at a butcher shop, 33% buy at a farmers market or farm-direct, 20% shop for meat at a dollar store, and 20% make meat purchases at a convenience store (FMI 2018a).
Sales of salami are growing faster than those of any other presliced deli meat, up 12.6% for the year ended July 1, 2017. Sales of Italian specialty meats, such as mortadella, pancetta, and capicola, rose 4.5%. Expect to see greater interest in charcuterie, including seafood, Iberico/serrano ham, and exotic sausages (e.g., truffle-stuffed) (IDDBA 2018).
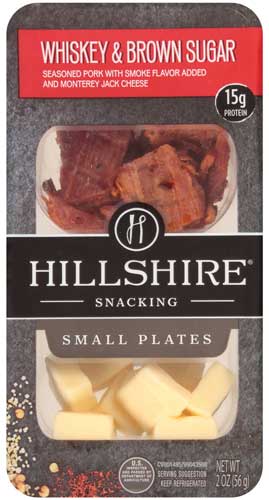
Sales of fresh snack kits like those in the Hillshire Small Plates line (varieties include Apple Chardonnay and Whiskey & Brown Sugar, among others) jumped 45% in 2017, according to IRI (Lyons Wyatt 2018b). Eggland’s Best introduced a snack kit that includes olives, feta cheese, and a hard-cooked egg.
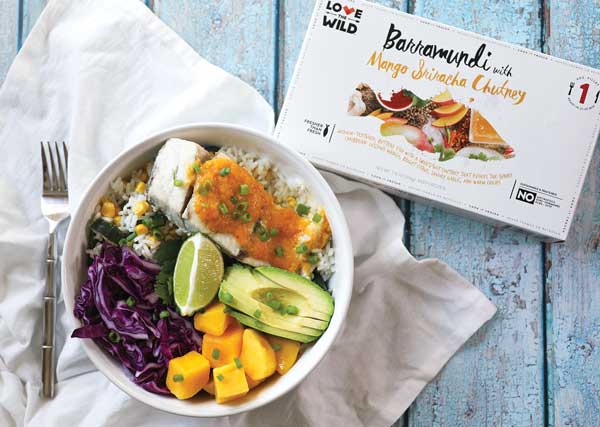 Sushi’s share of deli dollar sales increased 20% for the year ended July 1, 2017 (IDDBA 2018). More exotic and lesser known species of fish (e.g., branzino, barramundi) are trending. Other exciting trends in the specialty seafood category include smoked fish; artisan seafood salads, such as Artisan Deli Seafood Salads from Don’s Food Products; and in-store fish cooking kits, such as the frozen kits complete with sauces in varieties like Salmon With Coconut Red Curry from Love the Wild.
Millennials’ interest in Japanese/sushi, Thai, Vietnamese, Indian, Middle Eastern, Mediterranean, and Korean cuisines has now reached significant levels and represents an enormous opportunity for specialty fresh prepared/frozen meals and ingredients (FMI 2018b). American Culinary Federation chefs surveyed by the National Restaurant Association cited Peruvian, African, Filipino, and ethnic fusion among the trendy global flavors for 2018 (NRA 2017).
Globally inspired street foods, the second most important overall culinary trend for 2018, continue to excite specialty food consumers, providing seemingly endless ideas for appetizers and handheld fare (NRA 2017). The word “street” has increased nearly 40% on restaurant menus over the past four years, while tortas and tacos grew 19% and 16%, respectively (Datassential 2018).
McCormick’s 2018 Flavor Forecast identifies Chinese egg crepes, gyros, arepas, tzatziki sauce, dessert bao buns, and Asian hot pot parties as hot new global food trends. Berbere spice blends, Tanzanian BBQ, miso sake yakitori glaze, and Japanese furikake seasoning are other emerging global influences that McCormick makes note of (McCormick 2018).
Sriracha, gochujang, sambal, harissa, peri-peri, curry, and shichimi remain strong hot/spicy flavor contenders in the deli (IDDBA 2018). Fruit-flavored oils represent another emerging trend; mandarin orange olive oil from Lucero is one example.
Serious Foodie’s gourmet sauces now include Peruvian Blood Orange & Aji Panca cooking sauce and Romesco finishing sauce. Pearl and Johnny’s new dips and spread mixes come in varieties like Beetroot and Garlic and Maple and Onion.
Asian frozen entrées have outperformed other frozen meals for more than four years. Korean flavors/dishes are fast becoming a specialty favorite (Leathers 2018).
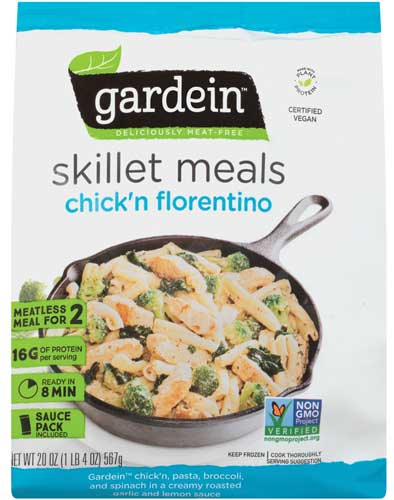 Gardein launched plant-based, dairy-free skillet meals for two. Spicy Korean Style Noodles are a new addition to the Tai Pei line of frozen entrées in cups.
Overall, 9% of consumers, or 10.5 million households, purchased a meal kit for the six months ending March 5, 2018; one-quarter, or 30 million households, say they plan to do so in the next six months. In-store meal kit sales reached $155 million, posting growth of 26% in 2017 (Nielsen 2018a).
Sizzle in the Center Store
Shelf-stable grocery products accounted for 61% of specialty food sales in 2016; strong sales performers included water, wellness bars, and nut/seed butters. Specialty candies, cereal, pasta, pasta sauces, condiments, dressings, and antipasti (e.g., pickles, peppers, olives) enjoyed the greatest increase in use among products in the center specialty aisles (SFA 2017).
Over one-third of consumers buy specialty snacks for everyday use (SFA 2017). Gourmet snacks account for one-quarter of the specialty food market. Of the 13 snack categories, about half experienced growth of more than 20% between 2014 and 2016, led by jerky/meat snacks (SFA 2017).
Sales of “other snacks” led by alternatives (e.g., plant-based snacks) were among the biggest gainers in 2017, per IRI, up 19%; sales of bean- and chickpea-based munchies are projected to grow 25% and 30%, respectively, over the next few years. Sales of “all other” more exotic snack/granola bars jumped 23% (Lyons Wyatt 2018b).
Indulgent snack sales grew by 1.9% and healthy indulgent snack sales grew by 2.5% in 2017, while wellness snacks slipped by 0.4% (Lyons Wyatt 2018b). Albeit from a small base, vegan snack sales soared, up 36%. Packaged Facts (2017b) expects alternative snack sales to reach $1.7 billion by 2019. Vegan Rob’s Cauliflower Puffs contain probiotics; Seasnax are made from seafood.
Niche specialty products, which account for 31% of ice cream segment sales, outpaced sales of their traditional counterparts by 19% in 2017. Niche accounts for 15% of the cookie category, outpacing traditional product sales by 8%; 11% of meat snacks are niche products, outpacing mainstream product sales by 8%; and 11% of chocolate candy sales are niche, outpacing traditional candy sales by 4.4% (Lyons Wyatt 2018b).
Tonic Scene dark chocolate bars come in varieties like wild cherry sweetened with coconut nectar. Artisan chocolatier Vivra Chocolate offers chocolate bar options ranging from Cape Cod Cranberry to Thai Satay, which the company bills as “a chocolate visit to Thailand with a bit of tropical heat.”
Sales of refrigerated dips topped $1.9 billion in 2017, per Nielsen (Hale 2018). Robert Rothschild Farm’s all-natural dips, which come in exotic varieties like Roasted Pineapple & Habanero, are high pressure processed to eliminate the need for preservatives and thermal processing.
Specialty desserts increased their share of fresh bakery category dollars by 27% for the year ended July 1, 2017. “All other” was the largest specialty dessert subcategory, with sales up 64%, per Nielsen. In descending order, tarts, eclairs, cobblers/crisps, cannoli, cream puffs, and baklava hold the largest shares (IDDBA 2018).
 Watch for classic French single-serve patisserie items and Italian mini classics to make a strong showing in the bakery case (e.g., opera cake, mille-feuille, macaroons, St. Honoré cake, crostoli, rum cakes, ricotta limoncello tarts, rainbow cake, and amaretti cookies. CakeBites offers classic rainbow cake in single-serve portions.
Breads made from specialty and sprouted flours/grains (e.g., purple wheat, coconut, and tapioca flours) or heirloom starter cultures/yeast strains and breads that deliver a serving of vegetables or that toy with dessert flavors are grabbing customers’ attention (IDDBA 2018). Ethnic bread, such as challah, chapati, Slovakian nut breads, roti, and bammy, remain untapped opportunities for bread marketers.
Breads suitable for the Paleo, keto, and Whole 30 diets are another premium bread trend. Weston Bakeries’ Country Harvest Canadian Wild Blueberry With Flax and Rolled Oats is said to be suitable for Paleo diet followers, for example.
 Niche Beverages Drive Business
Exceptionally fast growth by niche specialty drinks and dollar sales increases in two mega drink categories—bottled water and carbonated soft drinks—drove U.S. retail beverage dollar sales up 3% in 2017 to exceed $180 billion (BMC 2018).
Volume sales of RTD coffee grew 12.3%; value-added water sales were up 11.7%; bottled water, +7.0%; energy drinks, +3.7%; and RTD tea, +1.1%. Sales of fruit beverages fell by 3.9%; sports drinks, -2.1%; and carbonated soft drinks, -1.3% (BMC 2018).
Dollar sales of specialty milks jumped 11.9%; yogurt drinks, +13.2%; lactose-free milks, +11.5%; milkshakes, +7.4%; flavored milks, +4.2%; and alternative milks, +2.7% for the year ended Oct. 8, 2017, per IRI. Smoothies and kids’ yogurt/yogurt drinks are posting strong gains (Del Buono 2017).
Tea bags/packages have the highest U.S. household beverage usage rate followed by bottled water, orange juice, coffee, fruit juices, and colas (Packaged Facts 2018b). Purple Tea (Camellia sinensis) from Kenya, high-caffeine RTD teas, and sparkling nonalcoholic champagne look-alikes are among the latest specialty drink trends.
Alternative milks and RTD dairy-based coffee/tea drinks are the top beverages increasingly used for snacks (Lyons Wyatt 2018b). Sales of shelf-stable pineapple juice grew 19% for the year ended Oct. 28, 2017; tropical fruit drink sales were up 7.5%, per IRI; coconut and plant waters reached sales of $998 million (Harfmann 2018a).
Ginger, cinnamon, hibiscus, and lavender are increasingly being added to beverages. Combination juice flavors, such as carrot ginger juice from Natalie’s Orchid Island Juice Co., are on the rise.
Tropicana offers Simply Light juices/lemonade with 25 calories per serving. The Cold Pressure Council, formed in 2017, now offers a certification seal for premium high pressure processed products.
Sales of beverages formulated with probiotics are projected to rise 7.4% per year through 2020; kombucha sales are expected to grow by 25% annually (Harfmann 2018b). Karma Wellness Water features a push cap that adds probiotics and vitamin A, E, and B complex to the water with the touch of a button. Living Essentials added peach-flavored 5-Hour Tea Shots to its lineup.
Natural/Organic Specialty Stores
Thirty percent of adults buy mainly natural/organic when food shopping. Millennials under age 35 are the most likely to do so. Seven in 10 consumers buy at least one natural food or drink per month; 60% buy at least one organic product monthly (Packaged Facts 2018a).
Purchasers of natural/organic products are 79% more likely than adults overall to be quick to try a new nutritional product. Three-quarters (75%) prefer food presented as an art form, 66% try and eat gourmet whenever they can, 34% enjoy eating foreign foods, and 25% prefer foods cooked with a lot of spices (Packaged Facts 2018a).
They’re also much more likely to prepare a meal from scratch, cook at home, buy value-added foods, order delivery, and use a fresh meal kit. Natural/organic consumers are more likely to eat several small meals during the day, to say that breakfast is the most important meal of the day, and to try to lose weight using popular diets (Packaged Facts 2018a).
Eight in 10 natural/organic consumers look for products marked seasonal; 81% are motivated to purchase by humane treatment claims. Seventy-two percent of natural channel shoppers seek out non-GMO foods versus 46% of consumers overall (Packaged Facts 2018a).
More than half of Hispanics are natural/organic consumers; 60% are buying more natural/organic foods than ever (Packaged Facts 2018a).

Figure 3. Packaged Facts 2018a
Figure 3. Packaged Facts 2018a
One-third (33%) of all adults shopped in a natural food store in 2017; among those who say they mainly buy natural and organic products, more than half (55%) shopped in a natural food store (Packaged Facts 2018a). Among those who shopped in the natural foods channel, more than half (52%) shopped at Whole Foods, and 47% shopped at Trader Joe’s (Packaged Facts 2018a, Figure 3).
Sales of foods and beverages in the natural retailer channel reached $31.9 billion, up 4.1% in 2016. Fruit and vegetables remained the largest category with sales of $7 billion, + 4.1%. Next are beverages, $6.4 billion, +3.4%; packaged foods, $4 billion, +4.5; dairy, $3.9 billion, +7%; breads/grains, $3.9 billion, +3.2%; snack foods, $3.2 billion, +4.2%; meat, fish, and poultry, $2.1 billion, +4.5%; and condiments, $1.4 billion, +5.4%. Organic food/drink sales in natural retailer stores rose 4.8% to $15.7 billion in 2016 (Marshall 2017).
Organic food and drink sales reached an all-time high of $45.2 billion, up 6.4% in 2017, accounting for 5.5% of retail food sales (OTA 2018). Fruits and vegetables are the largest organic category with sales of $16.5 billion, up 5.3% in 2017, followed by organic dairy/eggs, up 0.9% to $6.5 billion. Beverages moved up to the third spot with sales of $5.9 billion, up 10.5%. Organic fresh juice jumped 25% to $1.2 billion (OTA 2017).
Overall household penetration for organic products is 34%. Penetration is highest for fruit and vegetables at 31%; eggs, 28%; milk, 14%; meat/poultry, 11%; yogurt, 10%; juices, 7.1%; bread, 6.5%; and breakfast cereal, 5.9% (Packaged Facts 2018a).
Organic foods rank third among the top foods consumers are more likely to eat when watching their diets, right after low-fat and high-fiber products (Packaged Facts 2018a). Four in 10 say that organic is important for baby foods (Nielsen 2017b).
Half of specialty food retailers believe that local claims will grow the most in terms of specialty customer interest over the next few years, followed by non-GMO, sustainable, organic, and all natural (SFA 2017).
Consumers continue to look for seals/third-party certifications to verify claims and the authenticity of foods/beverages (Hartman 2017). In 2017, 64% of consumers were familiar with the USDA organic certification logo; 53%, certified kosher; 53%, fair trade; and 44%, certified vegan. Although less familiar, impact on purchasing was higher for animal welfare approved at 77% and certified pesticide free at 75% than for non-GMO Project Verified at 68% and USDA Organic at 66% (Hartman 2017).
Sustainability has become an indicator of higher-quality products; products that are promoted as sustainably produced may command a premium price. Six in 10 consumers say it’s important that their food is produced in a sustainable way; 21% say it’s very important. Reducing pesticide use and ensuring an affordable food supply are the issues driving increased interest (IFIC 2018).
Although consumers’ definition of sustainability still embodies the personal, social, economic, and environmental principles of good stewardship, sustainable issues are now more likely to reflect a responsibility to protect future generations and farm- or land-oriented concerns. Moreover, Americans’ sustainability efforts have become more personalized; consumers are prioritizing issues that impact themselves and their families versus global environmental and social concerns (Hartman 2017).
Climate change; food waste; and water quality, scarcity, and rights are among the top sustainability issues on the horizon, according to the Hartman Group (Hartman 2017). Regenerative agriculture, hydroponics, and vertical farming are among the next hot sustainable agricultural techniques. BPA, heavy metal contamination, and non-GMO animal feed are among the emerging concerns.
Shopping Around
Nearly half of Millennials (49%) and 38% of all consumers visit three or more retailers weekly to shop for groceries (Acosta 2017).
U.S. sales by online grocery retailers (e.g., Amazon) are projected by IRI to reach $34.7 billion by 2022 (IRI 2018b). In 2017, 10% of shoppers used online only stores to order groceries frequently—up from 7% who did so in 2016. One-quarter (25%) ordered online groceries at least occasionally, and 43% of Millennials did so (FMI 2017a).
Of those ordering any groceries online last year, just over one-third ordered salty snacks, sweets, condiments, or packaged/canned goods, and about one-quarter ordered baking/cooking items or pet food and treats. Online ordering of perishables is still limited (FMI 2017a). Packaged coffee is the specialty product that is ordered most frequently online, followed by packaged tea, chocolate, oils/vinegar, pasta/sauce, and cookies, cakes, and pies (SFA 2017).
Click and collect, which describes the ability to order groceries or prepared foods online and pick them up at the store, is an important feature for four out of 10 consumers, and for 51% of older Millennials (FMI 2018b). Natural/organic shoppers aged 25 to 34 and those with kids at home are at least 40% more likely to shop online for groceries than consumers overall (Packaged Facts 2018a).
Convenience stores are another untapped market for specialty foods. Half (47%) of convenience store shoppers enjoy eating foreign foods and foods with a lot of spices; one in five try to eat gourmet whenever they can. Six in 10 see nothing wrong with indulging at times (Packaged Facts 2018a).
Sixty percent of convenience store shoppers are trying to get more fiber, 40% prefer foods without additives, and 27% usually snack on health foods (Packaged Facts 2018a).
In 2017, 98% of those who shopped at a convenience store bought a beverage; 66%, a snack; 27%, prepared fast food for immediate consumption; and 22%, food for consumption later or at home (Hanson 2017).
One-quarter of adults shop at farmers markets; 35% of Millennials do so versus 19% of Boomers (Lyons Wyatt, 2018a). In 2017, 36% of natural/organic consumers shopped for food/groceries at a farmers market, 33% in a convenience store, and 29% in a drug store (Packaged Facts 2018a).
A. Elizabeth Sloan, PhD, a member of IFT and contributing editor of Food Technology, is president, Sloan Trends Inc., Escondido, Calif. ([email protected]).


