
What Consumers Want—and Don’t Want—on Food and Beverage Labels
From Certified Organic and USDA Inspected to Kosher/Halal, No Trans Fat, and GMO Free, labels speak volumes about a product to the consumer. With more than 13,000 new food products introduced last year, maximizing the appeal of a product’s label is critical to success.
Aside from the package itself, about the most important decision a marketer has to make is what to put on the label of a food product, such as the graphics, the claims, the call-outs, the names. Amazingly, nearly three-quarters of consumers say they can’t think of any information “not currently included on food labels” that they would like to see added (IFIC, 2003a). As consumers become more convenience directed and health/safety concerned, product information and customer service must keep pace.
Getting Consumers to Try a New Product
No wonder consumers think food shopping is a chore: last year, the average shopper made 2.2 visits per week to a supermarket, where he or she was confronted with 13,452 new foods and beverages—a drop in the bucket compared to the average supermarket’s 40,000 SKUs (MIS, 2003), and with one in five food shoppers referring to a discount store or supercenter as their “primary grocery store,” competition for their attention just got tougher (FMI, 2003a).
McKinsey (2003) reports that the number of visits to supermarkets fell 12% between 1999 and 2002, while visits to surpercenters jumped 40%. In 2003, 30% regularly shopped at stores, supercenters, dollar stores, and drug stores for groceries, while 20% regularly shopped at warehouse clubs, convenience stores, natural/organic markets, or ethnic food stores. Amazingly, an average family gets 80–85% of its needs from only 150 SKUs!
Sure to put a damper on new product trial, the average price per item in supermarkets this year was the highest it’s been in a decade. Continuing their economizing trend, shoppers limited weekly spending on household groceries to $91 per week, the same level as in 2001 (FMI, 2003b). In the past two years, there has been a heightened concern about saving money. Interest in low food prices climbed 7 points to 84% from 2001 to 2002, and is relatively unchanged in 2003. The importance of private-label or store brands has grown 4 points in one year. At the same time, consumers do not appear to be as willing to pay for health as they were a few years ago—only 28% said they would pay more for fat-free or low-fat foods, and 15% for organic foods (IRI, 2003a).
Not surprisingly, when it comes to the factors that are extremely/very important to shoppers when trying a new brand, taste tops the list, up 9% as a brand influence in the past two years. According to IRI’s annual “Pacesetter” reports (IRI, 2003b) which identify and analyze the year’s most successful new food products, in recent years around 90% of the “big sellers” claimed a taste, flavor, texture, or recipe benefit.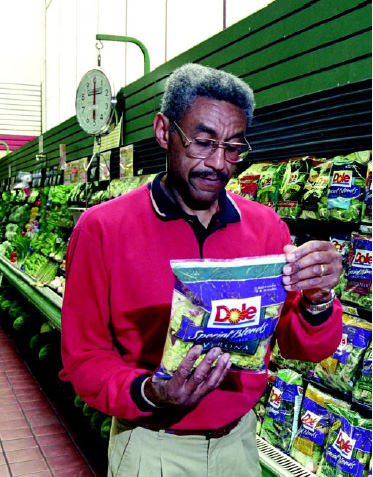
When deciding whether to buy a food product for the first time, 89% of shoppers say they always/almost always look at the price, 80% the brand name, 66% health claims, 68% the type of preservatives or additives, and 38% organic claims (FMI, 2003b). The Natural Marketing Institute’s 2003 Health and Wellness Trends Database (NMI, 2003) reveals that two-thirds of consumers say they read labels on foods and beverages (Fig. 1), 34% select foods based on their nutritional content, and 27% base their selection on the Food Guide Pyramid.
Fresh
Next to “free,” “fresh” remains the most desirable food label claim. About two-thirds (68%) of grocery shoppers say that a fresh claim is extremely/very important on food labels (HealthFocus, 2003; Table 1). “Sell-by” and “Use-by” dates remain the most-desired and best-read pieces of information on food labels—more than nine out of ten shoppers say they always/usually read them. Eight out of ten shoppers (82%) say that the degree to which a store’s products are labeled with sell-by and/or use-by dates and the policing of those dates by the retailer are one of the main reasons (ranking No. 4) that they elect to shop at one supermarket over another (FMI, 2003b).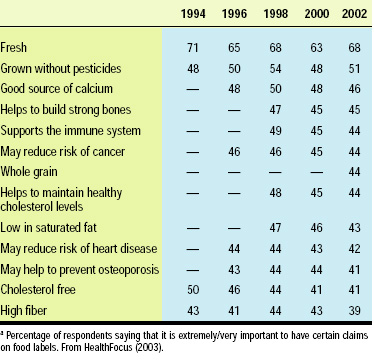
--- PAGE BREAK ---
Since the early 1990s, shoppers rank a clean, neat store and high-quality fruits and vegetables as the top two reasons for where they shop; low prices remain in third place. The importance of high-quality meat has declined since last year, falling from 84% to 81%. More important, shoppers report that retailer performance has dropped over the past three years in two areas: high-quality meats and the monitoring and coding of “use-before/sell-by dates.” Poor quality is the No. 1 reason produce buyers fail to make a purchase they intended: 66% report inferior quality due to damaging/bruising; 43% poor visual appearance, 41% too old/wilted, and 38% too ripe (The Packer, 2003). When shoppers are unable to buy an item they planned, 54% don’t purchase a substitute.
Quality is a critical impulse purchase motivator. Looking appetizing tops the list of reasons shoppers purchase unplanned items, followed by low price, realization that it could be used in something, and an attractive display.
Label terms, graphics, and packaging that make a product appear fresh are quickly gaining share. “Fresh or hand-picked,” “flash frozen in the field,” “fresh frozen for fish and seafood,” and even “hand cooked” (used by Kettle Foods’ Jalapeño with Tequila & Lime Kettle Chips) are popular claims for processed foods. Campbell’s Simply Home soups and Del Monte’s Sunfresh line of cut fruit (Fig. 2) have found success in the fresh appearance given by glass packaging. And artistic, “fresh”-looking graphics, such as used by Small Planet Foods’ Muir Glen organic tomatoes, are giving cans a fresh appearance and super taste appeal.
Ironically, while major processors of juice, salad dressing, edible oils, sodas, mustards, and baby foods moved toward packaging in PET or HDPE bottles, boutique processors have adopted glass as their container of premium choice. The Sebastiani winery, for example, offers gourmet, premium condiments, grapeseed, walnut, and almond oils, marinades, and chocolate sauces, all packaged in glass.
Easy and Convenient
With home cooking at the highest level it’s been at for decades and cooking literacy at an all-time low, packaging and label flags that communicate cooking convenience, “guaranteed” great taste, and super-fast preparation will catch nearly every shopper’s eye. With food marketers making home cooking easier than ever, it’s not surprising that the trend to preparing more meals at home continues. FMI’s 2003 study reports that 85% of shoppers made a home-cooked meal at least three or more times a week in 2003, up from 74% in 2001. At the same time, take-out, take-home, and on-premise sales for restaurants remain slow (FMI, 2003b).
Recent studies show that the brands that stay top-of-mind with consumers as they shop are those that help them “manufacture time” or “reduce the hassle factor” (George, 2003). “Ready-to-eat,” “fully cooked,” and “heat-and-eat” are among today’s most powerful food label buzzwords. In the past few years, the “tolerated” meal preparation time has fallen from 30 minutes to 15 minutes. No wonder products with quick-cook claims are popular, especially those ready in 5 minutes or less, such as Hormel’s Beef Roast Au Jus (Fig. 3), which “heats in 4 minutes” and carries the USDA mark of beef quality, and Kraft’s Stove Top stuffing mix which “cooks in 5 minutes with real chicken broth.” Portionable claims, such as the stuffing mix’s “make a little, make a lot!” are also gaining in popularity.
--- PAGE BREAK ---
Also, 61% of shoppers say speed and ease of preparation is a critical denominator attribute at dinner, 60% at lunch, and 74% at breakfast—well above price at 41%, 33%, and 31%, respectively (IRI, 2003a). Ready-to-eat claims have become critically important for desserts, which accompanied only 7% of evening meals this year. RTE desserts, like Sara Lee’s Mrs. Smith’s Flip It cakes and Cobbler Anytime thaw-and-go desserts, account for half of in-home desserts (NPD, 2003a).
Microwave claims also remain strong. In 2002, microwave ovens were used to prepare a dish for 20% of all evening meals; only 23% of all suppers used more than one cooking appliance (NPD, 2003b).
Dramatic changes in the American kitchen will spur a new generation of preparation and convenience claims. According to NPD’s Kitchen Audit (NPD, 2003c), we could be looking at a kitchen where the chicken is packaged in disposable cookware, so that you can buy it, cook it, and not have to clean up the cookware. America is getting rid of its pots and pans. Bundt cake pans (now found in only 15% of kitchens), double boilers (27%), broiler pans (29%), casserole dishes (54%), and frying pans (92%) are not being used as frequently. Today’s kitchen contains fewer traditional appliances and cookware and more ready-to-use foods, like marinades and pre-made burgers. Heinz North America’s EZmarinader, which comes in a flexible-film bag, eliminating the need for a separate bowl or pan to clean up, has moved up to No. 3 in a very competitive category. Kitchen shears are more common, while carrot/potato peelers are beginning to disappear. When they do cook, consumers love to cut or chop. No wonder boneless chicken and pork are gaining in popularity. And 30% of all dinners now include something frozen, while eating and cooking are becoming more utensil free. Consumers will also look for more ingredients to be packaged with the kits they purchase and look for the kits to be sold in less-conventional, heavily trafficked outlets, including drug stores, c-stores, and gas stations.
And with cooking literacy at an all-time low, very clear cooking instructions (preferably with pictures), recipes, serving tips, and safe handling instructions are a must for today’s novice cooks. Just under half of households use a recipe from a cookbook at least once a month; one-quarter from a food package; slightly fewer from a magazine devoted to cooking; and only 15% from a newspaper food section (NPD, 2003d). Good housekeeping’s Illustrated Cookbook—a pioneer in step-by-step pictured cooking—has remained on the top of the best-seller list since its inception.
Healthy
Both macronutrient avoidance and nutritional enhancement continue to play an important role in the food selection process. Just over two-thirds of consumers have added foods to their diet to eat healthier, up from 5% a year ago, while 66% have avoided some foods, up 1% (NMI, 2003). And—good news for label makers—although 28% of adults are overwhelmed by the nutritional characteristics of the foods and beverages they eat, fewer are confused than last year, down from 36%!
Consumers continue to look for positive health benefits and claims. According to NMI (2003), 63% of consumers used fortified foods in 2003, up from 50% in 2000, and 58% used functional foods, up from 31%. Nearly half (47%) of consumers believe that fortified foods and beverages can be used to get their daily vitamin requirement. Despite the plethora of fortified foods, NMI reports that consumers still feel that their diets are deficient in calcium (37%); omega-3 fatty acids (31%); antioxidants (27%), vitamin C (23%), lutein (19%), and folic acid (15%). In 2003, three-quarters of adults used a high-fiber product, and 31% thought their diets were deficient in dietary fiber. And with two-thirds of consumers saying it’s important for their store to carry foods and beverages naturally high in vitamins and minerals, “contain” claims could bring big rewards.
--- PAGE BREAK ---
Supermarket sales of “lite,” “lean” and “less of ” related brands are rebounding, according to an IRI (2003c) analysis of more than 1,000 leading prepared meal solution products—including Healthy Choice, SnackWell’s, Weight Watchers, Stouffer’s Lean Cuisine, and others. Their sales totaled just under $5 billion in 2002, and weight-loss/dieting was the major consumer driver of current growth. “Light” or “lean” brands have grown on average by 7% over the past four years, but “reduced fat content” or even “fat free” brands declined 8.8% simultaneously. With nearly two-thirds of shoppers taking some action/dieting to lose weight during the past year and one-third admitting that they are overweight, weight-directed messages will command renewed attention. With today’s dieters using a variety of weight-loss strategies simultaneously, a variety of claims will maintain their importance: low-calorie claims are very/extremely important for 35% of shoppers, lower in sugar 35%, sugar free 32%, high protein 30%, and low carb 26% (HealthFocus, 2003).
Between 37 and 42 million Americans are estimated to be following some sort of high-protein, low-carb regimen; 24 million are on the Atkins’ plan. When Gallup (MSI, 2003a) asked about Americans’ most recent diet strategies, 21% cited high-protein, low-carb behaviors (up 6% since last year) and 31% low-fat behaviors (down 12%). More than two-thirds of consumers have used high-protein foods this year (up10% over 2002), 66% low-carb foods (up 7.5%), and one-quarter soy-based foods (NMI, 2003).
The Food and Drug Administration does not have a definition for “low-carb” foods. Some marketers are using label terms such as “net carbs,” “net-impact carbs,” and “net-effective carbs.” Two-thirds of consumers say a low-carb attribute would probably/likely get them to try a new food product; 59% high protein (IRI, 2002). Just over four out of ten shoppers usually check the food package label for forms of sugar before they purchase (NMI, 2003a).
With the Food and Nutrition Board recommending a drastic reduction in trans fatty acids and saturated fats in the diet and FDA imposing trans fat labeling as of January 1, 2006, consumers will be looking for low and no-trans fat claims. A January 2003 survey found that only 20% of grocery shoppers were aware of trans fats on the Nutrition Facts label, compared to 89% for calories and 52% for fiber. Just over half (58%) said they consider calories when purchasing any type of pre-packaged food, 56% total fat, 45% sodium, 45% saturated fat, 42% sugar, 39% cholesterol, 34% carbohydrates, 22% protein, 22% fiber, and 12% trans fat (IFIC, 2003b).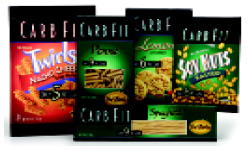
But with 71% of food shoppers trying to reduce the risk of developing a health condition and 68% trying to treat some problem, health claims will continue to grab consumer attention. And marketers in the United States are right on target. Coca-Cola Co. has released Minute Maid Premium Heart Wise, the first national juice product containing plant sterols for lowering blood cholesterol. Carbolite’s At Last! candy is aimed at diabetics and the 30–80 million Americans estimated to be suffering from insulin resistance. The Hain Celestial Group launched Carb Fit (Fig. 4), a new low-carb food brand with snacks that hit all the bases: “all natural,” kosher, and free of trans fat, hydrogenated oils, and “chemicals to achieve taste and stability.”
Health claims are worldwide, too. For example, Australia and New Zealand permit a symbol for low-glycemic foods, while Sweden’s first health claim allows yogurt marketers to say their product “helps control blood sugar.”
Nothing Artificial
Next to brand, use-by/sell-by dates, and, more than likely, price, the most-often-read information on food labels is country of origin/origin of production (71%) and the ingredient listing (67%), including food additives (FMI, 2003b).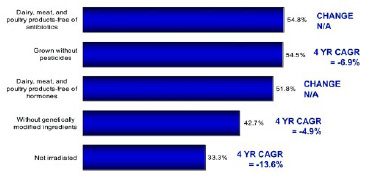
--- PAGE BREAK ---
With 68% of shoppers reporting that they always/almost always check the food label for additives and preservatives, avoiding additives and preservatives is fast approaching the all-time high of 72% experienced in the 1970s and early ’80s due to the food dye controversy. Just 45% of consumers feel that it is important for their store to carry foods and beverages free from artificial colors, flavors, and preservatives; an almost equal number want foods free from artificial sweeteners (NMI, 2003a). Just about half of mothers with children age 6–12 years are making a strong effort to limit artificial sweeteners, and 63% caffeine (MSI, 2002). Just over half of shoppers say it is also important for their store to carry dairy, meat, and poultry products free of antibiotics or hormones (NMI, 2003; Fig. 5).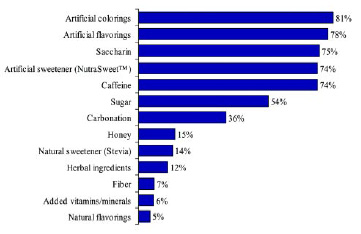
The desire to avoid artificial ingredients is even stronger if the product has a health positioning or health claim. The Hartman Group (2003) found all natural to be the leading product attribute influencing the purchase of a healthy beverage (66%), followed by thirst (59%), nutritional content (49%), added vitamins/minerals (40%), number of calories (25%), habit (25%), organic (24%), quick pick-up/energy (24%), weight loss (19%), and others. Artificial colorings topped the list of ingredients consumers don’t want in their healthy beverages, closely followed by artificial flavorings, saccharin, artificial sweeteners, and caffeine (Fig. 6).
Interestingly, an analysis of 150 new energy beverages by Innova’s WIN database indicates that caffeine, taurine, guarana, and inositol are driving new beverage innovation (Innova, 2003).
Concern about biotechnology and genetically modified foods appears to be slowing. Although awareness of biotechnology increased from 45% to 56% between 2001 and 2002 and of GMOs from 40% to 44%, the number of food shoppers who consider food produced by biotechnology a serious health risk fell three points last year, back to 30% (NMI, 2003; FMI, 2003b). IFIC (2003b) found that a growing majority of Americans support the benefits of food biotechnology as well as the Food and Drug Administration’s labeling policy. IFIC reported that 62% of Americans believe that biotechnology will benefit them or their families in the next five years; 43% looked forward to benefits, including improved quality and taste; 40% to improved health and nutrition; 19% to less chemical use on plants 19%, 10% to reduced cost of foods; and 9% to better crop yields. Nearly 70% would purchase produce that had been “modified” to be protected from insect damage or to limit pesticides. Only 2% named anything related to “genetically engineered” as an item to be added to the food label. And that’s good, because IFIC (2003a) reports that U.S. farmers intend to increase biotech plantings in 2003—corn by 4% to 38% and soy by 5% to 80%.
Irradiation is another critical food technology that appears to be gaining support. The number of shoppers who consider food irradiation a serious health hazard fell 3 points last year to 30% (FMI, 2002b). At the same time, awareness of food irradiation increased from 40% of the general population to 51% (NMI, 2003). More important, the number of food shoppers very likely/likely to purchase products, including strawberries, pork, poultry, or beef, irradiated to “kill germs” and keep the product “safe” jumped from 38% in 2000 to 57% in 2003. The renewed interest in irradiated food is consistent with the high level of concern regarding bacteria as a health risk.
Despite indications of more favorable attitudes toward irradiated foods, shoppers report only limited availability or usage of irradiated beef. Only 5% of shoppers reported that their primary grocer offers irradiated beef, and only 2% have ever purchased it. Nonetheless, FMI (2003b) data confirms that irradiated beef is becoming more prevalent in supermarkets.
--- PAGE BREAK ---
Safe and Secure
Unfortunately, for the first time in several years, shopper confidence in the safety of the foods they buy declined last year. Those who felt that their foods were completely or mostly safe fell 3 points to 79%. There’s also been a major loss in confidence among those age 40–49, with the number of shoppers feeling that they were completely or mostly safe dropping from 82% to 69%. Confidence also fell among shoppers living in the Midwest and East, those living in small towns, and those in single-person households. Men are also less inclined to feel completely confident about the safety of their food, down to 15% from 26% (FMI, 2003).
Not surprisingly, the increased seriousness of food safety issues is causing consumers to finally relinquish more responsibility to the government for overseeing that the food products they buy are safe. For the past few years, shoppers believed that they themselves were primarily responsible for the safety of the food they ate, but their willingness to take control is waning, dropping 7 points in one year.
While shoppers have long thought that food processor/manufacturing plants were the point in the distribution chain where food safety problems were most likely to occur, recent world events have made them aware that problems can occur at all points in the distribution chain. While about one-third of shoppers think food safety problems are most likely to occur in food processing operations, only 15% think restaurants and only 10% think at home (FMI, 2003b).
While about half of consumers say they had thought at least some about the security of our food supply prior to the 9/11 attack, 91% were somewhat or very concerned after the attack. The vast majority (85%) agree that of the possible ways terrorists might attack, the U.S. food supply is a major concern; only 7% disagree (Wimberley, 2003).
The attention span—or “worry time”—after a food scare or outbreak continues to shorten. For example, in June, NPD’s Food Safety Monitor (NPD, 2003e) confirmed that Americans still had a ”healthy appetite” for beef and trust the U.S. food supply, despite the Canadian outbreak of “mad cow disease,” bovine spongiform encephalopathy. While consumers’ concern about mad cow disease jumped to 61% from 47% the week Canada announced its findings, their intentions to eat steak and hamburger did not change—56% said they intended to eat the same amount of burgers, and 16% more burgers; only 11% said they’d stop eating burgers at all. Similar results were found for steak, and both were on par with consumers’ intentions for meat consumption a year ago.
Despite a series of scares, NPD (2003e) reported that the percentage of consumers aware of and concerned about mad cow disease dropped from 61% in the summer of 2001, to 56% in 2002 and 53% between April 30 and May 7, 2003, the time of the Canadian incident. In contrast, the percentage of Americans aware of and concerned about Escherichia coli remained relatively constant during the same period—80% in 2001, 78% in 2002, and 77% in 2003. Salmonella awareness and concern was equally high—80%, 79%, and 76%, respectively. 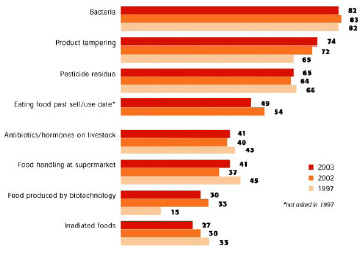
Bacteria is by far the most frequently mentioned factor regarded as a serious health risk, cited by eight in ten food shoppers (Fig. 7, FMI, 2003b). With terrorism “top of mind,” it’s not surprising that the seriousness of the risk of product tampering is rising among consumers. Three-quarters of shoppers consider it a serious health risk, placing it second only to bacteria. Some companies, such as Frulatté Food Co., are using attractive tamper-evident packaging in response to this concern (Fig. 8).
--- PAGE BREAK ---
Similarly, concerns related to food handling in supermarkets had declined from 1997 to 2002, but now appear to be increasing. Not surprisingly, the items that were most frequently examined for sell-by/use-by dates are those which are most perishable and/or prone to dangerous bacterial growth—milk and dairy products and uncooked meats. According to FMI (2002), one out of five shoppers decided not to purchase a product as a result of their safety concerns. In 2002, ground beef led the list of foods consumers were avoiding; 62% of the shoppers rated ground meat a serious or somewhat serious health risk. Other meat, poultry, and seafood products were also considered a health risk by about half of all shoppers. In contrast, fresh fruit is regarded as much less of a health risk, cited by only 32% of shoppers.
But when it comes to safety, consumers have a lot to say about produce. Nine in ten consumers feel that fresh produce items, packages, or displays should be labeled with chemicals used in production (91%), organically grown (86%), country of origin (86%), use of waxes and/or coatings (85%), biotechnology (78%), and irradiation (78%)—all more important than nutritional value (77%)! Surprisingly, only 12% of shoppers feel that branded fresh produce is much more likely to be safer; 20% somewhat more likely (The Packer, 2002).
The majority of shoppers indicate that they have seen labels on food packaging concerning the safe handling of foods, especially fresh, meat, seafood, and eggs (FMI, 2003b).
The most frequently taken actions to keep food safe that at least eight in ten consumers do every time they handle/prepare food include washing vegetables, washing hands/food prep surfaces, cleaning food thoroughly, keeping the area pest/insect free, refrigerating food promptly, and looking at expiration dates or making sure the food is fresh. The last four of these behaviors have increased significantly since last year (FMI, 2003).
Driven by a realm of uncertainties overseas, it’s not surprising that country-of-origin concerns are one of the fastest growing food safety issues. Nearly eight in ten produce buyers feel that country-of-origin labeling should be mandatory, and fresh meat buyers aren’t far behind. When asked if the U.S. should buy its food from other countries if it was sold cheaper than it can be produced here, three-quarters of Americans said “no!” (Wimberley et al., 2003). Confidence in U.S. grown meat was high (92%), while only 21% said “yes” to eating South American meat, 14% meat from the United Kingdom, and 10% from other European nations. Just over half (57%) worry about health problems due to farming methods in the U.S; 80% worry about them in other countries.
Given these findings, it should not be surprising that 78% rated “grown in the U.S.” and 76% “processed in the U.S.” to be of some or great importance for the foods they buy. Fully two-thirds said they would be willing be willing to pay more for food grown in the U.S.; only 13% would not. Four out of five consumers feel food grown in the U.S. is fresh and safer (80 and 79%, respectively, than imported food. Only 1–2% favor the freshness and safety of imported foods; it makes no difference to the rest. About half of consumers believe food grown in the U.S. is more nutritious and tastes better than important foods; 51% perceive that they cost less (Wimberley et al., 2003).
--- PAGE BREAK ---
Pure and Simple
One year after America’s organic standards were put into place, 54% of consumers say they have tried organic foods, with 29% claiming to eat more organic foods and beverages than one year ago (Whole Foods, 2003). Sales of 100% certified organic products are growing at 21% annually (SPINS, 2003). One year after the USDA-mandated National Organic Standards went into effect, one out of three Americans believe the new logo and/or clearer labeling has had an impact on their decision to buy organic foods. Nearly half of those claiming to consume more organics than they did one year ago said that clear, credible organic labeling makes them more inclined to purchase organic foods. Nearly seven out of ten who don’t eat organic foods claim that price is the major factor.
The U.S. natural/organic food market combined is estimated to be worth $14 billion and is projected to have an average growth rate of 8–10% through 2008 (NBJ, 2003).
Certified organic is extremely/very important to 30% of consumers, compared to natural at 37% (HealthFocus, 2003). Perhaps because of poor handling and policing of the quality of products, HealthFocus reports that the number of shoppers who believe that organic foods are more nutritious fell 14% since 1990, of better quality 7%, fresher 7%, and better tasting 7%.
Regional and local foods, state names, and farms—which offer a big dose of comfort and excitement, too—are among the latest generation of descriptive labeling terms. Even restaurant menus are more frequently citing the farm, state, body of water, or region of origin to build trust, while some credit the chef, farmer, or customer who inspired the dish. There’s no doubt that Americans prefer locally grown food—70% express willingness to spend more for locally produced products (Wimberley et al., 2003). Local farmers were named among the most trusted sources for information about food quality, trusted by 70% of consumers, followed by university professors (57%), government officials (20%), celebrities (12%), and business executives (11%). Not surprisingly, quality-conscious food marketers are beginning to label products with the names of local farms or dairies, or regions of the country such as Sonoma or Napa counties.
Since the 1950s and even before, environmental concerns—including air quality, the water used for plants and animals, and the soil that yields our foods—have continued to rank high in public attention. Ninety-four percent of Americans agree that land owners have “responsibilities to protect soil resources for future generations;” 71% say they would be willing to pay more for food if it means it could be produced in ways to protect the environment; 81% say they would be willing to pay a premium for food grown on farms using good environmental practices; and 60% say they care about sustainable agriculture (Waverley, 2003). Still only one in five feel that farming is a major source of pollution in our nation today, while two-thirds think that most farmers take good care of the soil and half agree that most farmers safely use pesticides. According to HealthFocus (2003), grown without pesticides is becoming a stronger brand influence for shoppers—43% say a grown without pesticides claim is an extremely/very important brand influence, compared to 32% for contains only natural ingredients, and 23% for contain organic ingredients. Products, such as Small Planet Foods’ Muir Glen line of premium tomato products (Fig. 9), that not only bear a certified organic symbol but also are grown in the most natural and environmentally friendly manner will continue to command a premium position.
And we can’t talk about pure, without talking about the explosive kosher foods market, which is fast approaching $35 billion in sales. Leading food marketers like Campbell Soup Co. are learning the power of a kosher certified symbol on the label. To appeal to a broader base of consumers, the company recently launched its first kosher soup, Campbell’s Condensed Vegetarian Vegetable Soup, certified kosher by the Orthodox Union (OU). According to Jeremy J. Fingerman, president of Campbell’s U.S. soup division, “The coveted OU symbol is one of the best-known trademarks in the world. It is a sign of quality as well as kosher certification.” Kosher symbols are skyrocketing onto products. One tell-tale sign is that the only hot dog brand that enjoyed significant sales growth in 2002 was Con Agra’s Hebrew National.
Other endorsements of quality that are growing in popularity include the U.S. Dept. of Agriculture’s “certified” and graded meat seals, “Certified Angus” and other meat products, and even the Good Housekeeping Seal.
--- PAGE BREAK ---
Demographic Drivers
Last, but perhaps most important, a number of demographic factors are going to be having a dramatic impact on label design, graphics, and content.
From bigger print size to larger labels and a myriad of health-directed claims, catering to 70 million Boomers—who will represent 24% of the population by 2014—ravaged by the minor physical and visual annoyances of aging will be essential. Boomers spent an average of $84 a week on groceries in 2002, compared to $77 spent by consumers overall. Multiplying that figure by 45.2 million boomer households reveals an astonishing $197.4 billion in potential annual revenues for food retailers. According to FMI (2003c), the top five services used at least once a week by Boomers in 2002, were frequent shopper programs or savings clubs (67%), private label or store brands (59%), fresh food deli or delicatessen (41%), in-store bakery (33%), and ethnic foods (21%).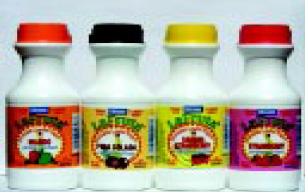
With ethnic minorities composing 40% of the population by 2025, the question of how to label to attract various segments is one that must be better understood. By 2025, ethnic minorities will constitute nearly 40% of the total U.S. population. The U.S. Hispanic population alone, which grew explosively between 1990 and 2000, is projected to almost double, from 37 million today to more than 68 million, or 19% of the population. The Asian population in the U.S. will also double, reaching 24 million, or 7% of the total population. Ethnic shoppers represent an incredible growth opportunity for food marketers (Fig. 10). Already, African American and Hispanic consumers spend more on groceries each week than the average shopper (FMI, 2003). Hispanics also make twice as many trips for groceries than all shoppers, averaging 18 trips per month. In 2002, these groups accounted for nearly 20% of the nation’s total buying power. By 2007, African Americans and Asians will account for 13.1% of buying power, and Hispanics alone will account for 9.4% (Census, 2000). Earlier this year, the Procter & Gamble Co. made news with its dual-language labels and advertising. Ethnic wellness products represent another major untapped opportunity.
The availability of private-label/store brands and fresh-food delis also has remained constant at about 90% over the past two years. Nearly nine out of ten consumers use private-label products, about the same as last year, and just over half use them every week (FMI, 2003b). Private-label milk, eggs, and bread, already well developed, today constitute 25% of store-brand sales. Milk, bread, canned vegetables, carbonated beverages, cheese, eggs, water, and pet food are the largest private-label food and beverage categories. Private-label holds a 31% or higher share in close to one-fourth of all food and beverage categories. Ice, wine, fresh meat, pudding/desserts, and gum showed the largest percentage gains last year. Candy, convenience, diet chocolates and yogurt were also among the fastest-growing categories (Lembert, 2003).
One of the most important pieces of product information on the label is the company contact information, a customer service telephone number, ideally an 800 toll-free number. Statistics show that for every customer who complains, 26 remain silent. The wronged customer will tell 8–16 people; some may tell 20 or more. And 91% of unhappy customers will never purchase the goods or services again; but 82–95% will if an effort is made to remedy complaints. And it costs five times as much to attract a new customer as to retain an old one! The consumer service group also serves as an early warning system for up-and-coming problems (Stier, 2003).
Labels Will Become Even More Important
As thousands of new foods and beverages continue to roll out and consumers opt to buy them at less-traditional outlets, food labels and the information they contain will become more important than ever before. Dual-language labeling, more dominant graphics and colors, better customer service, and guarantee symbols are all signs of things to come. Whether Internet-ordered or home-delivered, labels will remain the cornerstone for communicating with customers about the product inside the package.
by A. Elizabeth Sloan, Contributing Editor
The author is President, Sloan Trends & Solutions, Inc., P.O. Box 461149, Escondido, CA 92046. E-mail: [email protected].
References
Census. 2000. Population statistics in the United States. U.S. Census Bureau, Washington, D.C.
FMI. 2002. Trends in the United States: Consumer attitudes and the supermarket. Food Mktg. Inst., Washington, D.C., www.fmi.org.
FMI. 2003a. Food marketing industry speaks 2003—The state of the food retail industry. Food Mktg. Inst., Washington, D.C., www.fmi.org.
FMI. 2003b. Trends in the United States: Consumer attitudes and the supermarket. Food Mktg. Inst., Washington, D.C., www.fmi.org.
FMI. 2003c. Generations in the Marketplace: An FMI whitepaper. Food Mktg. Inst., Washington, D.C., www.fmi.org.
George, J. 2003.Create product niches—Focus on convenience at the point of use. Brand Packaging 7(7): 13-15. www.brandpackaging.com.
Hartman Group. 2003. Wellness interactive survey: Healthy beverages. The Hartman Group, Bellevue, Wash., April 2003. www.haratman-group.com.
HealthFocus. 2003. 2003 trend survey, HealthFocus, Atlanta, Ga. www.healthfocus.net.
IFIC. 2003a. Americans’ acceptance of food biotechnology matches growers’ increased adoption of biotech crops. Press release, May 7, 2003. Intl. Food Info. Council, Washington, D.C. www.ific.org.
IFIC. 2003b. Impact of trans fat labeling on the consumer food. July 2003. Intl. Food Info. Council, Washington, D.C. www.ific.org.
Innova. 2003. Functional innovation in beverages. Innova Food and Beverage Innovation J., Feb./March, pp. 40-41. WIN Nutraceutical Database, Duiven, The Netherlands. www.win-food.com.
IRI. 2003a. Meals demise, snacks arise: Consumer redefines the American meal. Presented by Kim Feil, Div. President, Worldwide Innovation, Feb. 2003. Information Resources, Inc. Chicago, Ill., www.infores.com.
IRI. 2003b. New products pacemakers’ reports. Information Resources, Inc., Chicago, Ill., www.infores.com.
IRI. 2003c. IRI’s supermarket review database, excluding Wal-Mart; Dollar Sales; Average annual growth. 52 weekend ending 5/113/03. Information Resources, Inc. Chicago, Ill., www.infores.com.
Lempert, P. 2003. Private label differences by department. Facts, Figures & Departments, October 13. [email protected].
McKinsey. 2003. Competing in a value-driven world. McKinsey & Co., New York, N.Y.
MIS. 2003. Number of packaged goods introductions. ProductScan Online, Marketing Intelligence Service, Naples, N.Y.
MSI. 2002. Gallup study on pre-teen children’s nutrition & eating habits”, Multi-sponsor Surveys, Inc. Princeton, NJ. [email protected].
MSI. 2003. Gallup Study of Dieting & the Market for Diet Products & Services, Multisponsor surveys, Inc., Princeton, NJ. [email protected].
NBJ. 2003. NBJ’s Annual Industry Overview VIII. Vol. VIII, No. 5/6, May/June 2002 page 1, 3 - 9. www.nutritionbusiness,com.
NMI. 2003. The NMI Health & Wellness trends database. Natural Marketing Inst., Harleysville, Pa. www.nmisolutions.com.
NPD. 2003a. Homemade dessert disappearing at the dinner table. Press release 9/16/03, The NPD Group, Port Washington, NY. NPDFoodWorld.com.
NPD. 2003b. The NPD Groups’ 18th National Eating Trends Service, Port Washington, NY. NPDFoodWorld.com.
NPD. 2003c. NPD finds cooking without cookware is becoming the American way. Press release: May 9, 2003, The NPD Group, Port Washington, NY. NPDFoodWorld.com.
NPD. 2003d. 2002 complete kitchen audit. The NPD Group, Port Washington, NY. NPDFoodWorld.com.
NPD. 2003e. The NPD Group finds Americans still want their beef, despite mad cow in Canada. NPD Food Safety Monitor, the NPD Group, Port Washington, NY. www.NPDFoodWorld.com.
The Packer. 2002. Fresh trends: 2002 profile of the fresh produce consumer. Vance Publishing, Lenexa, Kans., www.packer.com.
The Packer. 2003. Fresh trends. Vance Publishing, Lenexa, Kans., www.packer.com.
SPINS. 2003. Sales of organic products 52 weeks ending 10/17/03. SPINS/AC Nielsen, San Francisco, Calif.
Stier, R. 2003. Customer services: Are they diligent and responsive?. Richard H. Stier Consulting, Sonoma, Calif., [email protected].
Wimberly, R.C., et al. 2003. Food from our changing world. The globalization of food and how Americans feel about it. Southern Perspectives by the Southern Rural Development Center, http://srdc.msstate.edu/cred/.
Whole Foods. 2003. Organic Trend Tracker annual survey. Whole Foods Markets, Dallas, Tex.