
Revising the Food Guide Pyramid
Why the Food Guide Pyramid is being reworked, and what the food industry’s role should be.
The Food Guide Pyramid was initially introduced in 1992 to help Americans use the Dietary Guidelines for Americans (USDA, 1992) as a basis to choose foods for a healthy diet. In addition to its uses by nutrition educators, teachers, and the media, it is commonly used by the food industry on food packaging, marketing materials, and advertising to show the contribution of specific food products to an overall healthy diet. The advance of nutrition research, evidence for the benefits of individualized diets, and the development of Dietary Reference Intakes (DRIs) for nutrients have all made it necessary to revise and update the pyramid.
This article will outline the history of food guides; explain the philosophy behind the revision of the pyramid; present data on food consumption patterns, consumer knowledge, and dietary behaviors; and help the food industry prepare for the new food guidance system when it is unveiled this year.
History of Food Guides
The goal of a national food guide is to improve the health and well-being of Americans by developing and promoting an easy-to-use dietary guidance system linking scientific research to individual nutritional needs. A food guide helps to translate and implement the Dietary Guidelines for Americans, which form federal nutrition policy, provide guidelines for food assistance programs, direct nutrition education programs, provide dietary advice to consumers, serve as a vehicle to speak with one voice, set research agendas, and frame public debate.
Federal dietary guidance began in the 20th century, when early messages focused on avoiding dietary deficiency diseases such as pellagra, scurvy, iron-deficiency anemia, and rickets. The U.S. Dept. of Agriculture has traditionally been responsible for guiding consumer food choices.
Federal food guides have evolved over the years. Many nutrition and food industry professionals will recall the “Basic Four”—a guide composed of milk and milk products; meat, fish, poultry, eggs, dry beans, and nuts; fruits and vegetables; and grains—that was published in 1956 (Page and Phipard, 1956). It was developed as a guide to a foundation diet, intended to meet only a portion of an individual’s calorie needs and Recommended Dietary Allowances (RDAs) for nutrients. It was assumed that individuals would eat more than the guide recommended to fulfill the remainder of their calorie and nutrient needs. The Basic Four remained a focal point for nutrition education for more than two decades.
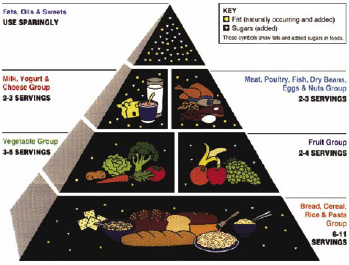 To better represent the total diet—rather than the foundation diet—as well as to ensure nutrient adequacy, address current nutritional concerns about excess intakes, and improve consumer communication, the Basic Four was replaced by the Food Guide Pyramid in 1992. The Food Guide Pyramid emphasizes foods from five major food groups—bread, cereal, rice and pasta; fruits; vegetables; milk, cheese, and yogurt; and meats, poultry, fish, dry beans, eggs, and nuts (Fig. 1). Each of the groups provides some of the nutrients needed on a daily basis. The Food Guide Pyramid recommends the number of servings from each group to be consumed on a daily basis to provide sufficient nutrients. The shape of the pyramid indicates that one should eat more of the foods from the bottom and less from the top. In addition to this proportionality concept, the pyramid portrays the Dietary Guidelines’ messages of consuming a variety of foods and choosing a diet moderate in sugars, fats, and salt.
--- PAGE BREAK ---
Other Pyramids
In part due to the popularity of the Food Guide Pyramid among consumers, a number of variations of the pyramid have been introduced in recent years. The Food Guide Pyramid for Young Children, designed to simplify educational messages and focus on children’s food preferences and nutritional requirements, was released in 1999 (CNPP, 2004).
Ethnic- and preference-specific pyramids have also evolved, including Asian, Native American, and Vegetarian pyramids.
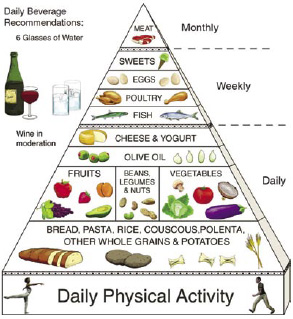 The Mediterranean Pyramid (Fig. 2) in particular has enjoyed tremendous popularity, as health professionals and consumers recognized that the rates of chronic diseases in Mediterranean countries were among the lowest in the world—and adult life expectancy among the highest—in spite of limited medical services. This pyramid was developed jointly by the Harvard School of Public Health, a United Nations World Health Organization/ Food and Agriculture Organization (WHO/FAO) Collaborating Center, and Oldways Preservation & Exchange Trust.
The foundation for this pyramid is daily physical activity. An abundance of food from plant sources, including fruits and vegetables, potatoes, breads and grains, beans, nuts, and seeds, forms the nutritional basis for this diet. Emphasis is on a variety of minimally processed and seasonally fresh and locally grown foods—thought to maximize the health-promoting micronutrient and antioxidant content of these foods. Noticeably, olive oil has a prominent position in the pyramid and is promoted as the principal fat, replacing other fats and oils. Other substantial differences between the Mediterranean Pyramid and the Food Guide Pyramid are the former’s recommendations of consumption of red meat only a few times per month and for a moderate consumption of wine (1–2 glasses/day for men and 1 glass/day for women).
The Food Guide Pyramid, while popular, well-recognized, and based on the soundest nutritional research at the time, also has its detractors. The Healthy Eating Pyramid (Willett, 2001) is based on the premise that the traditional pyramid is inherently flawed as a result of its bias toward supporting U.S. agriculture. This pyramid has daily exercise and weight control at its base, followed by whole grains, plant oils, and vegetables. Fish, poultry, and eggs are encouraged over red meat.
The Revision Process
To ensure that federal food guidance reflects the latest nutrition science and to develop new educational materials that assist consumers in making healthier choices, USDA’s Center for Nutrition Policy and Promotion initiated a broad-based reassessment and updating of the Food Guide Pyramid in 2000 (CNPP, 2004).
The revision of the Food Guide Pyramid includes a technical update and a consumer education update. The goal for the technical update is to reflect new nutrition standards such as the DRIs and the 2005 Dietary Guidelines for Americans. It includes the development of updated food intake patterns—the amounts to eat from each Food Guide Pyramid food group and subgroup. The consumer education update will involve a new “system” approach that will include development of a new graphic presentation to represent the food guidance system and a variety of new educational materials for professionals and consumers. The guiding principles for the revision are to develop tools that reflect up-to-date research and provide an overall health and total diet approach, as well as being evolutionary, flexible, practical, useful, realistic, and individualized.
--- PAGE BREAK ---
A Federal Register notice in September 2003 (USDA, 2003) described the proposed revisions for the food intake patterns. A July 2004 notice (USDA, 2004) announced the proposed Food Guidance System, describing the plan for the food guide’s graphic presentation and education materials. The proposed food intake patterns were designed to meet new nutrition standards for individuals grouped by age, sex, and physical activity level. The proposed food guidance system outlined a plan to develop both motivational and educational tools that would be focused on changing consumer behavior. Each Federal Register notice solicited comments from the public on any aspect of the proposed food intake patterns or food guidance system. In addition, comments were specifically solicited on several topics of interest to USDA. The comments were collected and are being considered as part of the revision process.
Recognizing the importance of taking individual needs, lifestyles, and preferences into account, CNPP proposed (USDA, 2003) new food intake patterns that include 12 energy levels for specific groups based on age, sex, and physical activity. These calorie levels range from 1,000 kcal/day for young children age 2–3, up to 3,200 kcal/day for active male teenagers. Each calorie level incorporates amounts to eat from each food group and subgroup, to meet the new nutrition standards as defined by the DRI and the Dietary Guidelines for Americans. The food intake patterns are based on the nutrients contained in commonly eaten foods, but include these foods in their most nutrient dense forms—with minimum levels of fat and no added sugars. In addition, the patterns include amounts of fats and added sugars that can be accommodated at each calorie level. The amounts of fat and sugar may be used to select foods with more than the minimum amount of fat or with added sugars, but in all cases these amounts are lower than current intake levels.
The food industry also had the opportunity during this time to provide their input to the revision process. For example, the Grocery Manufacturers of America (GMA, 2004) recently submitted comments to USDA recommending that the serving sizes used by the food guide system be aligned with those used in the Nutrition Facts panel. This proposal contends that consistency between the two tools would clarify significant confusion over serving sizes, improving the usefulness of both tools.
The final step in developing the new food guidance system will involve the development, testing, and implementation of educational materials for consumers as well as health professionals. There will be a focus on developing a framework for nutrition guidance and developing actionable and attainable behavior-change messages. Critical to this process will be designing interactive tools to personalize the food guide system. Creating partnerships with other agencies and health organizations for promotional activities and curricula development will also play an essential role.
The release of the new food guide system is expected to follow the release of the revised Dietary Guidelines for Americans early this year.
Consumer Attitudes
Consumer concern about nutrition has changed over the years. In 2004, 45% of consumers reported being “very concerned” about nutrition compared to 64% in 1992 when the Food Guide Pyramid was first introduced (FMI, 1992 and 2004). Specific nutrition concerns over the past 10 years have also shifted dramatically. Consumers are no longer as concerned about fat, salt, and cholesterol but are more concerned about total calories, sugar, and carbohydrate intakes. This is in line with the overweight and obesity issues facing many adults and children in the United States today.
Consumers report that positive health messages appeal to them—10% report that they are making an attempt to consume more whole grains and fish, and 5% are trying to eat more protein (Rodale, 2003). At the same time, there is considerable confusion about “who and what to believe,” with 64% agreeing that “There is too much conflicting information about which foods are healthy and which are not.”
The topics of obesity and overweight are largely driving increased interest in nutrition today. Media coverage of overweight and obesity has increased more than seven-fold between 1999 and 2004, with feature articles in widely read publications such as Time, U.S. News & World Report, Fortune, and The Economist. Consumers report that the coverage is conflicting and confusing—68% agree that “When reporting medical and health news, the media often contradict themselves, so I don’t know what to believe” (National Health Council, 1997).
--- PAGE BREAK ---
 Consumers and the Pyramid
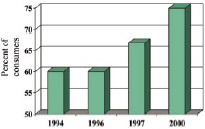
Following the introduction of the Food Guide Pyramid in 1992, there was considerable media coverage and public education about its use. As a result, by 2004 an impressive 88% of consumers had heard of USDA’s Food Guide Pyramid (Fig. 3). However, recognition does not necessarily lead to application. Only 17% of the population are aware of the Food Guide Pyramid recommendations and use it as a reference on which to base their diet. Data from USDA’s Continuing Survey of Food Intakes by Individuals (CSFII) (USDA, 1994-96) indicate that less than 1% of the U.S. population follows the Food Guide Pyramid recommendations by eating the appropriate number of servings from each food group (Figs. 4a and 4b).
The Dietary Guidelines Alliance (DGA), a public–private partnership among professional associations, government, and food industry associations, was formed in the mid-1990s to help bridge this gap between public policy and consumer education. Its mission is to provide positive, simple, consistent messages to help consumers achieve healthy, active lifestyles consistent with the Dietary Guidelines for Americans. The DGA uses consumer research as its basis for meeting its mission.
One question asked by the DGA in light of the obesity trend is, “How do consumers feel about portions and servings?” Many people are aware that they overeat but do not consider it a problem unless they perceive that they have a weight problem or health condition (DGA, 2002). DGA focus group research demonstrated that the average consumer does not distinguish between the terms “portion size” and “serving size” and uses them interchangeably. Many consider the serving size information on nutrition labels impractical and do not use it unless they are following a diet regimen. They do not feel that the label information is representative of what people really eat.
Focus group research results suggest that consumers would like to see food labels that are positive, fun, short and simple, specific and manageable, and tailored to them and that provide a payoff (DGA, 1996).
There will be obvious opportunities when the new Dietary Guidelines for Americans and food guidance system are released to educate the consumer in an attempt to alleviate confusion and provide practical tools to help them make wise food choices. The consumer’s current high interest in nutrition, food, and health provides the food industry an excellent opportunity to develop individualized and empowering food-guidance messages to segments of the population.
Impact of Dietary Patterns
People do not eat foods in isolation. Cereal and milk, fruit and yogurt, beans and tortillas, wine and cheese are only a few examples of how foods are often consumed in conjunction with each other. Because these patterns are deeply set, the development of any food guidance system must take into consideration the relationship between food patterns, choices, and nutrient intakes.
The following questions should continue to be addressed: How do dietary diversity and variety relate to nutrient intakes in the U.S.? What are possible practical implications and research needs? CSFII has provided generous amounts of data to analyze and start to answer these questions (USDA, 1994–96, 1998). Analyses of these data confirm that dietary diversity—including foods from each food group—is positively associated with micronutrient intakes (Weinberg et al., 2004) and nutrient adequacy (Foote et al., 2004). This was, in fact, the basis for a previous edition of the Dietary Guidelines for Americans to advise consuming a variety of foods.
--- PAGE BREAK ---
It is now known that one’s overall dietary pattern is also critical to the intake of certain nutrients. For example, when dairy consumption is limited, people not only consume less calcium, magnesium, and vitamin D but also generally consume lower levels of “non-dairy” nutrients such as iron and folate (Weinberg et al., 2004). This could be explained by the practice of consuming milk with fortified breakfast cereals, a good source of iron and other nutrients. Thus, when whole food groups are omitted in the diet—e.g, when dairy is limited because of perceptions of lactose intolerance or cultural preferences—individuals miss out not only on the inherent nutrients within that group but also on nutrients in foods that partner with that group. For example, examination of CSFII data show that consumption of dairy foods was positively associated with fruit and grain consumption (Guthrie, 1996; Ahlem, 2001).
Some current public health concerns are the long-term nutritional implications of low-carbohydrate diets, which a large proportion of our population are currently following at some level. On a nutrient/1,000-kcal basis, whole-grain consumers have higher intakes of vitamins A, B-6, E, and C, thiamin, niacin, folate, calcium, magnesium, iron, zinc, and fiber than do nonconsumers (Cleveland et al., 2000). Will people on low-carbohydrate diets put themselves at risk for deficiency diseases, an era we thought was long over? Are foods that commonly accompany whole grains being omitted as well, causing additional inadequacies?
Since nutrient intakes are positively associated with diverse diets, as defined by USDA food groupings, it is important to carefully examine convergence and divergence of food choices by considering what happens to nutrients when a food group is omitted or limited. Through the new food guide system there is an opportunity to emphasize food pairings and diversity of the diet to optimize food group and nutrient intakes. Maintaining a focus on whole foods and ingredients, or predictably fortified foods, may help consumers reap benefits of foods beyond their known nutrient content and simultaneously facilitate dietary planning and assessment. Common consumption patterns of foods and food groups are being considered in the development of the upcoming food guide system to ensure that recommendations and guidance are realistic and feasible given current dietary patterns.
Importance in Nutrition Education
A food grouping system has traditionally been used in nutrition education as a way to simplify nutrient recommendations. This approach is particularly important in teaching children how to select a healthy diet, which would be an unrealistically cumbersome task were we to focus on single nutrients. For example, guiding children to consume three or more servings of dairy products/day is much more feasible than informing them of the need to consume 1,300 mg of calcium/day.
With the rise in childhood obesity, nutrition education has never played a more prominent role in the health of our children and adolescents. Between 1988–94 and 1999–2000, we have seen a 25% increase in the prevalence of obesity in 6- to 11-year-olds and a 32% increase in the 12- to 19-year-old group (Flegal et al., 1992).
Interestingly, 94% of students say that eating healthy is important, and 74% report that they eat a healthy diet. However, fewer than 35% know how many servings were recommended from each of the five food groups (AHK, 2003). A recent survey revealed some frightening statistics on actual consumption among children and adolescents: only 2% of youth meet all the recommendations of the Food Guide Pyramid; 16% do not meet any of the recommendations; fewer than 20% of girls age 9–19 meet the recommended daily intake of calcium; teens drink twice as much soda as milk; and only one in five youths consume five servings of fruit and vegetables each day.
As an example of the usefulness of the Dietary Guidelines for Americans and the Food Guide Pyramid on national nutrition programs, the school lunch and breakfast programs are based on these tools. As a result, there has been considerable success in the delivery of good nutrition to our school children. In comparison with brown-bag lunches brought from home, school lunches are lower in fat and higher in protein, and contain on average one-third the number of snack items. In addition, 87% of school lunches contain milk, whereas only 7% of brown-bag lunches contain milk (AHK, 2003).
--- PAGE BREAK ---
Thus, a food-grouping system is absolutely essential in establishing nutrition goals for national programs such as school breakfast, school lunch, and others. It also plays a critical role in education of both children and adults, helping them to make healthful food choices. As food and nutrition professionals, we have an immense task in front of us as the new Dietary Guidelines for Americans and Food Guide System are revealed, not only to increase awareness of the updated recommendations but also to help motivate young children, adolescents, and adults alike to utilize these new guidelines in their daily food choices.
The Role of Industry
In spite of the growing body of nutrition research linking diet to health, taste remains the primary reason why people consume the foods they do. No nutrition education tool, pyramid or other will be effective if nutrition educators and policy makers do not recognize and accept that factors such as taste, convenience, and cost are often more likely to influence consumers’ food selections than is health (Glanz et al., 1998).
The food industry was very involved in disseminating nutrition messages based on the Food Guide Pyramid when it was released in 1992 and can be again when the revised food system is introduced. The industry can help at each step of the development and implementation of the new food system. The process by which the pyramid is being revised is an open one, with written and oral comments from the food industry and others accepted at various stages of the process. Once introduced, the industry can enable awareness of the new system through packaging, advertising, and public relations activities.
By partnering with health professionals and government organizations, and through educational and promotional materials, the food industry can make the system more accessible to consumers. Adjusting food labels to reflect new portion sizes will help the consumer in weight-control efforts. And through personalized dietary guidance and meal planning assistance, the industry can maximize the usefulness of the food guide system to the consumer.
Each of these actions naturally involves the use of industry resources—time, money, and expertise—yet ultimately the payoff will be increasing the demand for nutritionally positioned products to a better-educated and -enlightened base of consumers who value a broader range of healthy options from which to choose.
At the same time, there will be certain challenges facing the industry with regard to the new Food Guide System. The consumer may be wary if the graphic changes significantly from the previous well-recognized and popular pyramid used for the past 12 years. The introduction of “discretionary calories”—calories that one “earns” through higher levels of physical activity or by choosing less-energy-dense foods—will undoubtedly cause some confusion. And serving size and portion size may remain terms misunderstood by many, in spite of efforts to improve on consistent use in the Dietary Guidelines for Americans, the new Food Guide System, and the Nutrition Facts panel. Finally, consumers expect more individualized information and clarity on what’s in it for them to motivate themselves to make appropriate changes in diet and activity habits.
The food industry is an important partner in delivering dietary guidance messages. Companies have the advantage of having consumer insights on their product line, as well as being communication savvy and in a position to leverage government resources. As in the past, the industry can play an important part in educating the consumer about the new Food Guide System and its implementation. By aligning with the scientifically based national guidelines and delivering actionable and consistent messages, the food industry is in a strong position to deftly advance the acceptance of the new system by the consumer.
Industry’s cohesive embracement of the new system will be critical in minimizing consumer skepticism and allaying any potential confusion. These actions by industry will ultimately optimize health through wise food choices for individuals and the population as a whole.
Based on presentations at the forum, “The Revised Food Guide Pyramid: What Will It Mean to the Industry?” held during the Institute of Food Technologists’ Annual Meeting + Food Expo®, Las Vegas, Nev., July 12–16, 2004. The presenters were Louise Berner, Associate Professor, Food Science and Nutrition, California Polytechnic State University; Susan T. Borra, R.D., Executive Vice President, International Food Information Council; Eric Hentges, Director, U.S. Dept. of Agriculture’s Center for Nutrition Policy and Promotion; Guy Johnson, President, Johnson Nutrition Solutions LLC; and Marilyn A. Swanson, R.D., Director of Education and Training, National Food Service Management Institute, University of Mississippi.
The author, a Professional Member of IFT, is Nutrition Research Specialist, Dairy Council of California, 2151 Michelson Dr., Ste. 235, Irvine, CA 94612, [email protected].
References
AHK. 2003. Helping kids achieve their true potential. Sept 19, 2003. Action for Healthy Kids, www.kidseatwell.org/flyers/helpingkidsachieve.ppt, accessed Oct. 14, 2004.
Ahlem, C. 2001. Dairy product consumption and other diet and health related parameters. M.S. thesis. California Polytechnic State Univ., San Luis Obispo.
CNPP. 2004a. Web site, U.S. Dept. of Agriculture’s Center for Nutrition Policy and Promotion, www.usda.gov/cnpp/pyramid-update/index.html. Accessed Oct 6, 2004.
CNPP. 2004b. Kids’ pyramid Web site, U.S. Dept. of Agriculture’s Center for Nutrition Policy and Promotion, www.usda.gov/cnpp/KidsPyra/. Accessed Oct 6, 2004.
Cleveland, L.E., Moshfegh, A.J., Albertson, A.M., and Goldman, J.D. 2000. Dietary intake of whole grains. J. Am. Coll. Nutr. 19: 331S-338S.
Davis, C.A., Britten, P., and Myers, E.F. 2001. Past, present, and future of the Food Guide Pyramid. J. Am. Dietet. Assn. 101: 881-885.
DGA. 1996. “Reaching Consumers with Meaningful Health Messages: A Handbook For Nutrition and Food Communicators.” Dietary Guidelines Alliance, Chicago. http://fmi2.dev.matrixgroup.net/consumer/iaay/ Accessed Oct 18, 2004.
DGA. 2002. A focus group study to explore consumer attitudes regarding portion management and dietary fat. Shugall Research, Washington, D.C., for Dietary Guidelines Alliance. www.ific.org/research/upload/Dietary_Guidelines_Alliance_Portion_Size_and_Fat_Consumer_Research.pdf Accessed Oct 18, 2004.
Flegal, K.M., Carroll, M.D., Ogden, C.L., and Johnson, C.L. 2002. Prevalence and trends in obesity among US adults, 1999–2000. J. Am. Med. Assn. 288: 1723-1727.
FMI. 1992. Trends in the United States 1992: Consumer attitudes and the supermarket. Food Mktg. Inst., Washington, D.C.
FMI. 2004. Trends in the United States 2004: Consumer attitudes and the supermarket. Food Mktg. Inst., Washington, D.C.
Foote, J.A., Murphy, S.P., Wilkens, L.R., Basiotis, P.P., and Carlson, A. 2004. Dietary variety increases the probability of nutrient adequacy among adults. J. Nutr. 134: 1779-1785.
Glanz, K., Basil, M., Maibach, E., Goldberg, J., and Snyder, D. 1998. Why americans eat what they do: taste, nutrition, cost, convenience, and weight control concerns as influences on food consumption. J. Am. Dietet. Assn. 98: 1118-1126.
GMA. 2004. Food pyramid teamed with nutrition facts box would reinforce dietary advice. News release, Aug. 31. Grocery Manufacturers of America, Washington, D.C.
Guthrie J.F. 1996. Dietary patterns and personal characteristics of women consuming recommended amounts of calcium. Fam. Econ. Rev. 9: 33-49.
IPSOS. 2004. Dietary Guidelines consumer survey, March. Unpublished data. IPSOS Public Affairs, Washington, D.C. March 2004.
NHC. 1997. 21st century housecall: The link between medicine and the media. Natl. Health Council, Washington, D.C.
Oldways. 1999-2004. The Mediterranean pyramid. Oldways Preservation and Exchange Trust, www.oldwayspt.org/index.html.
Page, L. and Phipard, E.F. 1956. Essentials of an adequate diet. Facts for nutrition programs. ARS 62-4. U.S. Dept of Agriculture, Washington, D.C.
Rodale/FMI. 2003. Shopping for health 2003: Whole health for the whole family. Prevention Magazine and Food Mktg. Inst., Washington, D.C.
USDA. 1994-96. The Continuing Survey of Food Intakes by Individuals (CSFII) and the Diet and Health Knowledge Survey (DHKS), 1994-96. U.S. Dept. of Agriculture. www.barc.usda.gov/bhnrc/foodsurvey/Csfii94.html. Accessed Oct 18, 2004.
USDA. 1992. Dietary Guidelines for Americans, www.nal.usda.gov/fnic/dga/dguide95.html. Accessed Sept 30, 2004.
USDA. 2003. Notice of availability of proposed food guide pyramid daily food intake patterns and technical support data and announcement of public comment period. Center for Nutrition Policy and Promotion, U.S. Dept. of Agriculture, Fed. Reg. 68: 53536.
USDA. 2004. Notice of Proposal for food guide graphic presentation and consumer education materials; opportunity for public comment. Center for Nutrition Policy and Promotion, U.S. Dept. of Agriculture, Fed. Reg. 69: 42030.
Weinberg, L.G., Berner, L.A., and Groves, J.E. 2004. Nutrient contributions of dairy foods in the United States, Continuing Survey of Food Intakes by Individuals, 1994-96, 1998. J. Am. Dietet. Assn. 104: 895-902.
Willett, W.C. 2001. “Eat, Drink, and Be Healthy: The Harvard Medical School Guide to Healthy Eating.” Simon & Schuster, New York.