
Top 10 Functional Food Trends
Fewer calories, multiple benefits, and risk-reducing foods for kids will drive growth in the $36-billion U.S. functional foods market.
With one in eight children in the United States having two or more risk factors for heart disease, 59% of household grocery shoppers overweight, and only 16% of Americans satisfied with their energy level, health will remain a powerful driver of the food industry, as consumers search for more-convenient, better-tasting, and more-effective foods and beverages.
 Half of the most-successful new U.S. consumer food and beverage brands of 2005 on Information Resources Inc.’s “Top 10 New Product Pacesetters” list offered “better-for-you” benefits (Figure 1; IRI, 2006a). Unilever’s Slim-Fast Optima line topped the list with year-one sales of $166 million; Frito-Lay Light salty snacks ranked third at $112 million; Nabisco 100 Calorie Packs fourth at $107 million; Kraft’s Carb Well line sixth at $89 million; and Coke C2 mid-calorie carbonated soft drink ninth at $77 million. Gatorade also hit the mark with its new performance-enhancing Gatorade Lemonade. Also making the list were Budweiser Select, Cherry Vanilla Dr Pepper, Bertolli Dinners for Two, and Banquet Crock-Pot Classics.
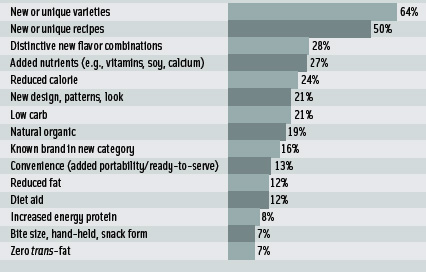
Nearly two-thirds of the Pacesetters offered taste/variety benefits, making it clear that consumers today are less willing than ever before to trade off taste for health. The Natural Marketing Institute reports that while four out of 10 consumers often give up convenience for health, the number (28%) who say that taste is more important than health continues to grow, up 10% since 2002 (NMI, 2005a).
Fortification is playing an increasingly important role in new product success. NMI (2005a) said that 65% of adults used a fortified food or beverage and 65% used a functional product in 2005. NMI (2006) projects that sales of functional and fortified foods will reach $35.86 billion in 2006, up 22% over 2005, and $59.87 billion in 2009.
FMI (2006) says that 59% of grocery shoppers report they’ve put a lot of effort into eating a more healthful diet in 2005, up 14% since 2000. Up-market shoppers—those better educated, with above-average incomes—are most committed to a healthy diet. Time constraints and cost remain the most-significant barriers to healthy eating.
And with too many conflicting health messages in the media, 36% of consumers say they’re feeling overwhelmed with the nutritional characteristics of food (NMI, 2005a). More important, it’s decreasing their ability to remember the health benefits associated with specific nutrients. For example, the number of consumers who link calcium with bone health has fallen to 66%, down 12% since 2003; fiber and digestive/colon health to 59%, down 9%; glucosamine and joint health to 38%, down 4%; and oats and heart health to 30%, down 17% (NMI, 2006).
1 Kids at Risk
With the incidence of high blood pressure (HBP) tripling in kids during the past decade, 10% of teens having total cholesterol levels above 200 mg/dL, and one million teens afflicted with Metabolic Syndrome (MetS)—multiple risk factors for type 2 diabetes and heart disease—activity is fast focusing on reducing serious risk factors in kids (AHA, 2006a; NHLBI, 2005, NIH, 2004).
--- PAGE BREAK ---
The National Heart Lung and Blood Institute (NHLBI, 2005), the American Heart Association (AHA, 2006b), and the American Academy of Pediatrics (AAP, 2004, 2000) have urged physicians to begin monitoring blood pressure at age 3, and cholesterol levels at age 8 if there is a family history. NHLBI (2001) concurs that low-fat diets can safely lower cholesterol levels in kids over age 4 without risk to development.
With many children already at risk for heart disease, 30–50% of new child diabetes cases being type 2, and 31% of kids at risk of or overweight, reformulating children’s products to be more nutrient dense—and lower in fat, calories, sugar, and sodium—will become an industry norm (AHA, 2006a; PBHF, 2005). Moreover, products that help to reduce risk factors naturally, like low-fat dairy products, soy products, cereals, and oatmeal, are well positioned for kids.
With one-third of kids born in 2000 expected to eventually become diabetic, sugared products will feel the heat (CDC, 2006). HealthFocus (2005) says that 41% of moms are avoiding sugar, 30% high-fructose corn syrup. Dental cavities have also increased for children age 6–12, due in part to consumption of bottled water without fluoride (USSG, 2000).
AAP (2006) reported that seven in 10 teenage boys and nine in 10 girls don’t get enough calcium, and recommended that physicians monitor calcium intake at age 3. PepsiCo’s Quaker Milk Chillers, made with 2% milk, contain seven vitamins and calcium and have 50% less sugar than leading flavored milks.
With kids and teens having to triple their intake of fruits and vegetables to meet the Dietary Guidelines, their diets are also lacking in dietary fiber, vitamin C, folate, vitamin A, calcium, potassium, and magnesium (PBHF, 2005). George Weston Bakeries’ X-treme™ Breads for kids with nine nutrients are an excellent source of calcium and a good source of fiber.
And meal skipping isn’t going to help. Sodexho (2004) reports that 23% of teenage boys and 37% of teenage girls skip breakfast and 28% and 18%, respectively, skip lunch.
With one in three children non-Caucasian, lactose intolerance has become a fast-emerging issue. Moreover, with three million kids afflicted with food allergies, allergen-free foods represent another much-needed alternative.
But it’s not all bad news. With kids snacking 23% more often than adults, it’s comforting to know that kids age 2–12 eat fresh fruit more often than any other snack-oriented food; yogurt ranks second for children age 2–7 (NPD Group, 2005).
And with the U.S. on the verge of the largest population boom in history—as the 74 million Gen Yers begin having their own children—and larger-family Hispanic households increase, it’s never too young to start (Packaged Facts, 2005a; Lempert, 2006a). Stonyfield Farm has introduced Yo-Baby Plus Fruit & Cereal yogurt with iron and DHA. Vincent Foods’ Oh Mama! bars fortified with folate, DHA, and B-vitamins are among the recent surge in fortified foods for pregnant women.
2 100-Calorie Cut-Offs
Light and lower-calorie products have re-taken their rightful place, as weight-concerned consumers gravitate back to lower-calorie and reduced-portion-size products, more so than reduced-fat and low-carb products. Nearly half of adults are currently watching or controlling what they eat; 25% are currently dieting; 28% think about the calories in what they eat; and 18% normally count calories (Packaged Facts, 2005b).
Based on an analysis of more than 1,000 brands and 17 categories sporting specific dietary benefits, IRI (2006b) reports that sales of low-carb foods fell 33.7% for the year ending (YE) 11/27/05, while sales of light foods—excluding low-carb—grew 2.5%.
--- PAGE BREAK ---
Light products are enjoying relatively strong growth in slow/no-growth beverage markets (IRI, 2006b). For YE 11/27/05, sales of light refrigerated juice/drinks rose 171%, light shelf-stable juices 21%, and light shelf-stable canned juices 49%, compared to total category sales of 1.9%, 1.6%, and 3.1%, respectively. Diet soft drinks continued to gain a larger share of the carbonated beverage business.
Light versions of snacks and desserts—excluding low-carb—have also experienced strong growth in usually indulgent markets. For YE 11/27/05, light versions of salty snacks grew 13.0%, cookies 15.9%, and ice cream 27.4% compared to slow total category sales performances of 1.5%, –0.1%, and –0.3%, respectively (IRI, 2006b).
Light yogurts represent one-quarter of category sales, although light varieties of cheese don’t seem to have caught on (IRI, 2006b). Stonyfield Farm has introduced Light Fat Free Yogurts with 100 calories and 3 g of fiber per cup. General Mills has launched 100-calorie popcorn packs.
But while light products will continue to grab consumer attention, it is portion size that will likely be the next big trend—61% of consumers say they want to cut down on the amount of food they eat, and 69% think it is healthier to eat mini-meals (Technomic, 2005). Four out of five chain-restaurant chefs predict that portion size will be among the next major restaurant trends, just behind minimally processed foods and nutritional disclosure on menus (Kruse, 2006).
While sales gains in mass, food, drug, and mass merchandisers (excluding Wal-Mart) for salty snacks, crackers, cookies, and chocolate candy were minimal or declining for YE 10/2/2005, sales of single-serve and 100-calorie packs of salty snacks rose 11%, crackers 4.9%, cookies 6%, and chocolate candy 4.9% (IRI, 2005a).
What is most important is that these highly successful single-serve, 100-calorie packs have inadvertently set a new 100-calorie standard in the consumer’s mind for the acceptability of healthy snacks and beverages. And nutrition bars may be among its first victims. Sales of nutrition/health bars fell for the first time in history—20% for YE 9/11/05—while breakfast bar sales grew 3%, granola bars 12.5%, and rice snack squares 27.2% (IRI, 2005a). Although bar marketers claim to have been caught too close to low-carb, it may well have been that their calorie levels—250+ for regular bars and 170–180 for smaller women’s bars—didn’t mesh with their healthier image. Optimum Nutrition has introduced a bite-sized nutrition bar called Mor’Sos.
Packaged Facts (2005b) estimates that U.S. sales of weight-loss foods and beverages reached $5.3 billion in 2005. Weight-loss frozen dinners and entrees, with nearly $1.7 billion in sales, accounted for more than 48% of total mass-market sales in 2005. Total frozen dinners and entrees posted gains of 7.2% for YE 12/25/05 (IRI, 2006a), with much of the growth coming from health-driven products.
In addition to Kraft’s Carb Well frozen items, Stouffer’s Lean Cuisine recently introduced its restaurant-quality panini line with a grilling tray that grills the bread in the microwave; some items have gone preservative-free. Heinz Weight Watchers’ Smart Ones line is offering higher-protein entrees, including Beef Sirloin with Asian Style Vegetables.
3 Phytochemicals, Finally!
Phytochemicals are finally moving mainstream, and interest in antioxidants is paving the way. ACNielsen (2006a) projects that products carrying an antioxidant claim, after a 19% sales gain last year, will enjoy double-digit growth in 2006 and be second only to the glycemic index among the next big blockbuster trends.
From 2004 to 2005, ACNielsen’s leading-edge “Health Activist” group spent more on antioxidants than any other health-related category. More important, 52% of their hard-to-attract “Health Neglectors” also used more antioxidant foods than the year before (ACNielsen, 2006a).
--- PAGE BREAK ---
And foods with antioxidants are taking a bite out of supplement sales. Sales of antioxidant-rich multi-vitamins fell 14% for YE 11/5/05, while sales of liquid tea grew 1,511%, teabags 194%, and ready-to-eat cereals 18% (Lempert, 2006b). Frozen blueberry sales grew 30% and pomegranate juice 88%; refrigerated juice/drinks with antioxidant claims fell 8%.
After a 14-year decline, fresh fruit consumption rose 4% last year, while fresh vegetable consumption fell 1% (PBHF, 2005). More than one-quarter of consumers (27%) said they ate fruits/vegetables in 2005 to prevent disease, 34% to feel healthy, and 87% to stay healthy; taste topped the list for 74%, down from 83% in 2004. Minute Maid has launched Fruit Solutions, 100% juice blends with no sugar added, providing two full servings of fruit and 3 g of protein per serving.
Dole Food Co. has a new Superfoods education campaign, with package logos that help shoppers identify health benefits, such as Superfood Antioxidant and Superfood for your Immunity. Super-high antioxidant fruits such as acai berry, starfruit, and goji berry are also coming into vogue.
Broccoli still tops the list of foods shoppers are eating more of to reduce their disease risk—59% eat more of it, up only 2% since 2002—58% eat more tomato, up 12%; 54% spinach/dark leafy vegetables, up 10%; 42% yogurt, up 12%; 15% olive oil, up 15%, and 14% soy, up 7%. Just over half (56%) of shoppers believe red wine may help reduce the risk of heart disease (HealthFocus, 2005).
Trial of green tea has tripled over the past five years; nearly 50% of tea drinkers drink it weekly (MSI, 2005). Starbucks is launching Tazo® Green Tea Latte and a Blackberry Green Tea Frappuccino® Blended Beverage. Lipton teas sport an AOX Seal to tell shoppers that tea is a natural source of antioxidants and that green and black tea both have antioxidants. Packaged Facts (2005c) projects that the tea market will reach $10 billion by 2010.
Chocolate flavonols—found in dark chocolate—are another super-hot antioxidant category. According to HealthFocus (2005), 31% of consumers have heard a lot/some about chocolate and heart health. In 2004, strong interest in chocolate polyphenols—especially in Japan—sent global sales of chocolate/cocoa food soaring 8% (ACNielsen, 2005a). Hershey has developed its own antioxidant seal and offers Hershey’s Special Dark and Extra Dark with higher levels of flavonols than regular dark chocolates. Mars’ CocoaVia line is formulated with plant sterols and carries a cholesterol-lowering claim.
According to Sloan Trends’ (2006a) TrendSense model, which predicts the timing of ingredients to reach mass-market status, lycopene, lutein, and resveratrol will be in the next wave of phytochemicals after green tea to go mainstream. Flavonoids and carotenoids are just moving beyond the specialty/health food channel, while anthocyanins, zeaxanthin, and polyphenols are firmly entrenched in the health food arena.
4 Multi-Benefits
Grocery purchases are now affected almost as much by a desire to reduce the risk of future health conditions as they are by weight. Weight loss has a major impact on 42% of grocery purchases, 39% future risk reduction, 28% managing an existing condition, and 30% following a doctor’s advice (FMI, 2006).
According to FMI (2006), 48% of shoppers have someone in their household suffering from, or at risk for, HBP, 43% high cholesterol, and 29% diabetes.
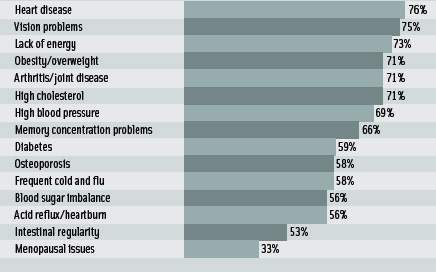 Heart disease is the No. 1 condition Americans are trying to prevent (Figure 2; NMI, 2005a). Two-thirds (65%) of consumers have used foods to help prevent obesity, 61% high cholesterol, 60% heart disease, 53% cancer, and 50% HBP; and 32% have used beverages for obesity, 25% cancer, 22% heart disease, and 20% HBP (NMI, 2004a).
--- PAGE BREAK ---
With 36% of women, 38% of men, 49% of Blacks, and 26% of Asian Americans already afflicted with two or more risk factors for heart disease, products that address multiple risk factors will soon be in high demand. For example, 22% of overweight men and 33% of women also have HBP; 19% and 31%, respectively, also have high cholesterol. Two-thirds of type 2 diabetics are overweight and 46% are obese; 55% have high cholesterol levels; and 37% have HBP (AHA, 2006a).
Heart-healthy foods and beverages sales reached $18.2 billion across all channels in 2005, up 9.5%. Women (63%) are more likely than men (53%) to use heart-healthy foods three times a week or more (Mintel, 2005a).
With a 30% increase in hypertension over the past decade—and 65 million adults, or one in three, having hypertension and 59 million pre-hypertension—the pressure to reduce the salt/sodium content of food will be unprecedented (NIH, 2004). Thirty percent of overweight children have HBP and 40% MetS (NHLBI, 2005). AHA has called for food marketers and restaurants to cut the salt added to foods by 50% over the next 10 years (AHA, 2006b).
Campbell Soup has taken a leadership role, announcing that it will slash salt content in its products by up to 45%, reformulating with an all-natural, lower-sodium sea salt.
While blood pressure–lowering drinks—which use a combination of bioactive peptides and minerals—are still unavailable in the U.S., low-fat dairy and soy protein have been found to be beneficial for blood pressure management.
While total cholesterol levels have decreased in middle-aged to older Americans, they are rising among younger adults, particularly women age 25–34, opening up a virtually untapped market segment (AHA, 2006a). But with 99 million adults still having cholesterol levels over 200 mg/dL and 35.5 million having seriously high levels of over 240 mg/dL—a larger segment of our population than the much-sought-after Hispanic segment—marketers would do well to stay focused on this important risk factor.
And with awareness of “good” and “bad cholesterol” on the rise, the 76 million with elevated LDL levels and 46 million with low HDL levels in the U.S. are another important target (AHA, 2006a). RD Foods’ Right Direction Chocolate Chip Cookies contain soluble fiber and plant sterols which help to deliver a substantial total cholesterol and LDL reduction.
In February, Archer Daniels Midland received FDA approval for use of its CardioAid plant sterols in pasta, salty snacks, soups, cheese, RTE cereals, and other products.
While 59% of all household grocery shoppers are overweight, older Baby Boomers, age 52–60, have the highest proportion, 71%. According to FMI (2006), 56% of younger Boomer shoppers age 42–51, 61% of Gen Xers age 28–41, 56% of matures age 61 and older, and 46% of Gen Yers age 18–29 are overweight. Those age 55 and over are nearly twice as likely as the general population to try to control their diet for weight, hypertension, cholesterol, blood sugar, and fat (Packaged Facts, 2005b) As a result, products that offer weight control, cholesterol, blood pressure, and other health benefits, like Quaker Oats’ Heart-to-Heart cereal, will find a welcome market.
5 Healthy Fats
Thanks to the growing popularity of omega-3s, consumers are opting for healthier oils and avoiding specific types of fat.
Low in saturated fat is now the most appealing fat-directed label claim and is extremely/very important to 41% of shoppers, followed by no trans fatty acids 39%, cholesterol-free 36%, low-fat 36%, and fat-free 32% (HealthFocus, 2005).
--- PAGE BREAK ---
More than eight out of 10 (82%) of consumers are aware of trans fats and 52% are trying to avoid them. And while 54% of label checkers still look for total fat, 43% also check for saturated fat, 35% percent of calories from fat, and 30% trans fat (NMI, 2005a). Saturated fat, cholesterol, total fat, and trans fat are the top ingredients—in descending order—that 58% of Baby Boomers try to avoid (NMI, 2005b). One-third of mothers with kids at home say that low in saturated fat and no trans fats (31%) are extremely/very important to them, compared to 27% low fat and 24% fat free (HealthFocus, 2005). And right behind calories (80%), 73% of those age 18–28 who check a label look for fat, 47% for saturated fat (NMI, 2005a).
Although nearly three-quarters of Americans still used low-fat foods and 69% fat-free foods last year, usage dropped from 82% and 76%, respectively, in 2001 (NMI, 2005a). Marketers should pursue more-specific fat claims and begin to reorient the no-, low-, and fat-free segment. Moreover, marketers must carefully evaluate the saturated fat component of any oil before making a change.
At the same time, consumers worldwide are opting for healthier—and often more-expensive—cooking oils, sending global sales of edible oils up 7% in 2004 (ACNielsen, 2005a). Olive oil ranked right behind vegetables, fruits, and whole grains—and above nuts—on the list of foods consumers increased their use of over the past two years for health reasons (HealthFocus, 2005). According to USB (2005), 91% of American adults believe that olive is the healthiest oil, followed by soybean 87%, sunflower 82%, canola 82%, safflower 79%, and corn 67%.
Marketers are formulating with, and promoting, healthy oils. Unilever’s Best Foods’ Hellmann’s® Canola Real Mayonnaise label touts “an excellent source of omega-3 (ALA) and omega-6 fatty acids (LA)” and “no trans fats.” The United Soybean Board’s Let ’em know what you’re made of media campaign encourages companies using soybean oil to prominently display its health benefits on their product packages.
Sixty-nine products with an omega-3 claim were introduced in the U.S. last year, 14 in 2006 (Mintel, 2006a). Arnold Foods Co.’s 100% Whole Wheat Bread with DHA/EPA Omega-3 Fatty Acids is one in a long line of high-omega-3 breads. Barilla America Inc.’s Barilla Plus line is “rich in heart healthy omega-3.” Unilever’s Promise margarine is made with “Heart Essentials” and flags “omega-3, ALA and no trans” on the label.
Last year, 13 new products carried an omega-6 claim; Edensoy’s Extra Organic Vanilla Soymilk is a new omega-6-fortified product (Mintel 2006a).
Kellogg will use Martek Biosciences DHA in future products as well as Monsanto’s Vestiv low-linolenic soybeans. And major pet food marketers, ranging from Iams’ Smart Puppy Formula to Nestlé’s Purina One, have added omegas to their foods. Chicken of the Sea flagged its natural omega content on its Smoked Pacific Salmon pouches; and Bumble Bee introduced a Bumble Bee Omega-3 & 6 Fish Oil Supplement.
Four out of 10 Americans and 31% of global consumers are regular buyers of cholesterol-reducing oils/spreads (ACNielsen, 2005b). Lack of believability of their health benefits, rather than price, is the primary deterrent to use. Mass-market sales of sterol-containing foods reached $93 million for YE 8/05, up 41% over 2004 (ACNielsen, 2005c).
6 Mature Matters
With 100 million Americans expected to be over age 50 by 2010, catering to their health concerns and dietary preferences will be an essential marketing strategy.
As consumers reach age 50, they’re significantly more likely to report that they suffer from joint pain/arthritis, osteoporosis, acid reflux/digestive issues, and eye problems (HealthFocus, 2005).
Those self-reporting arthritis rose from 24% in their 40s to 39% in their 50s and 54% age 65 and older (HealthFocus, 2005). Half (52%) of Americans over age 65 have arthritis. All told, one in five—43 million adults—have doctor-diagnosed arthritis, and 23 million have chronic joint pain (Arthritis Foundation, 2005). Elations™, a new clear fruit juice containing glucosamine, chondroitin, boron, 100% of the RDI for vitamin C, and 30% of the RDI for calcium, was developed by Procter & Gamble and will be marketed by the Elations Co.
--- PAGE BREAK ---
More than half (55%) of those over age 50—44 million people—have low bone mass or osteoporosis; the number is expected to reach 52 million by 2010 (NOF, 2005). And men will be getting more attention. Almost 12 million men have low bone mass, and 2 million have osteoporosis, compared to 8 million women.
Digestive problems also increase with age. The National Institutes of Health reports that 60–70 million Americans suffer from some form of digestive disease and that their incidence increases with age (NIDDK, 2005).
Although probiotics clearly would provide a natural solution, NMI (2006) reports that only 18% of grocery shoppers are aware of the term probiotics and that 71% don’t know any health benefits associated with probiotics. Of those who do mention a health benefit, 10% cite immunity, 8% cancer prevention, and 8% digestive health. About 13% of the general population thinks their diet is deficient in probiotics. Ironically, awareness of probiotics is highest among Gen Xers and falls off for ages 45–75.
Dannon is trailblazing the way for probiotics in the U.S. by introducing its Activia® probiotic yogurt with a promise that it will “naturally regulate the digestive system in two weeks when eaten daily as part of a healthy and balanced diet.” The yogurt contains Dannon’s proprietary Bifidus Regularis™.
Marketers also need to carefully monitor changing demographics. For example, just six years ago, 35 million women were suffering from menopause, and 10 million were perimenopausal. In 2005, 11 million were perimenopausal, 18 million in menopause, and 39 million postmenopausal, the latter at greater risk for heart disease, stroke, osteoporosis, and other conditions than the other two groups reflux $21 billion, menopause $16 billion, diabetes $14 billion, and arthritis $14 billion.
And tapping into these prescription-driven markets is easy. FMI (2004) reports that 91% of supermarket pharmacies offer blood pressure testing, 67% blood glucose monitoring, 64% cholesterol testing, and 58% osteoporosis screening.
With 49 million Americans already age 60 and older, the market for foods formulated for special dietary needs will continue to grow. Markets must continue to reinvent multi-claim high-protein supplements and meal replacements to meet the needs of older Americans—from improving bone health and increasing vitality to stemming muscle wasting. Mead Johnson’s MCT Oil—medium-chain triglycerides—is a fat substitute for those who poorly digest fats.
When marketing to households over age 50, women take on an important role. Between the ages of 60 and 64, there are 89 men per 100 women; at age 80, the number falls to 53 men. Those women age 55 and older generate 47% of all purchases in the drug store channel (ACNielsen, 2006b). Among households with a female head age 55–64, minerals, dog and cat treats, and sugar substitutes are among the most-developed product categories.
7 Glycemic, Gluten, and Grains
Three distinct but interrelated markets will have a dramatic impact on the global food industry in 2006:
• Low-Glycemic-Index Products. With benefits that go well beyond the weight-loss theories of the low-carb movement to diabetes, insulin resistance, energy levels, mood swings, appetite control, and concentration, proper blood sugar management might just be one of the most far-reaching diet-based markets of all time.
ACNielsen (2006a) predicts that low-GI foods will be among the leading health trends for 2006. Sales of GI-friendly products among ACNielsen’s “Health Neglectors” market increased almost 150% from December 2004 to December 2005—one of the biggest jumps among all products carrying health-related claims. While dollar sales are relatively small, ACNielsen feels that this signals the beginning of a blockbuster trend.
--- PAGE BREAK ---
While the scientific controversy continues, awareness of the GI rose to 45% in 2005, up from 33% in 2004, and 42% used a low GI food for blood sugar management in 2005 (NMI, 2006). Most important, strong and consistent usage—around 40–45%—was found throughout all age groups, indicating widespread appeal rather than appealing to just those worried about diabetes. One-third (34%) felt it was important for their store to offer low-GI packaged foods.
According to Sloan Trends (2006b), the desire for foods and beverages that aid in blood sugar management has reached mass-market status; however, the GI is still confined to the more-limited market of very health-conscious and specialty-store shoppers. Hain Celestial Group, Inc.’ s Estee Lauder brand introduced its new Low G low-glycemic bar, with a GI below 55.
Foods that aid in blood sugar management will have high appeal to the 47 million adults who already have MetS, the 49–69 million who are insulin resistant, and the 41 million who are prediabetic. According to NCHS (2005b), 20.8 million people have diabetes, and 1.5 million new cases were diagnosed in 2005. PBM has launched GlucoBurst Diabetic Drink in single-serve cans containing 25% of the RDI for 24 nutrients, DHA, added fiber, and no fructose.
Blood sugar concerns will keep attention focused on sugar. Two-thirds of consumers used sugar-free foods in 2005, and 50% check sugar content when they read a label (NMI, 2005a).
While 39% of consumers used artificial sweeteners to help reduce their sugar intake, the number of adults concerned about their safety continues to grow—37% don’t want to serve their family anything with artificial sweeteners, and 49% think their store should have foods without artificial sweeteners, up 10% since 2003 (NMI, 2005a).
• Gluten-Free Products. Gluten-free foods—for those with an intolerance to wheat, rye, and barley protein—is an explosive market segment, with sales in mass channels reaching $396 million for YE 10/8/05. Gluten intolerance can lead to celiac disease and may affect one in 133 Americans.
Gluten sensitivity, however, is more widespread. Unfortunately, the popular press has linked gluten intolerance to a wide range of conditions, including autism and stunted growth in children (Lempert, 2005a). Whole Foods Market added a gluten-free bake house in June 2004, and Wal-Mart introduced its Great Values gluten-free line in August 2005. Sloan Trends (2006c) confirms that gluten-free reached mass-market status in 2004.
Mintel International’s Menu Insights Group (2006b) reports that gluten-free is now among the most prominent health claims on restaurant menus, behind fat-free, low-carb, light, low-fat, vegetarian, organic, cholesterol-free, and lean. Gluten-free and high-fiber products are also well positioned for the growing U.S. market for sensitive tummies.
The gluten-free trend will also do its part to drive the move toward specialty and heritage grains and give soy a new lease on life. Along with corn, rice, and potatoes, soy, oats, buckwheat, millet, tapioca, quinoa, teff, amaranth, and sorghum are also gluten-free. Glutino’s and Nana’s are two well-established gluten-free lines.
• Whole-Grain Products. With products from Lipton Sides to Orville Redenbacher’s Microwave Popcorn going whole grain, it’s not surprising that Packaged Facts (2005d) projects that whole-grain foods will reach sales of $7.5 billion in 2009. New FDA heart-health claims for beta-glucan soluble fiber from barley, FDA guidance on the definition of “whole grain,” and greater usage of prebiotics in mainstream products will also draw attention to unique dietary fibers.
The multifaceted health benefits of whole grains—digestive health, weight loss, heart health, and cancer prevention—are gaining recognition (NMI, 2006). A focus on specialty and heritage grains will also spur the dietary fiber market. Tropicana has introduced Tropicana Pure Premium Essentials with Fiber, the first nationally marketed orange juice with 3 g of fiber in every glass. Frost & Sullivan (2006) projects that the U.S. fiber industry will grow from $193 million in 2004 to $495 million by 2011.
--- PAGE BREAK ---
8 Natural Solutions
Organic foods—one of the most-sustainable long-term growth categories, along with no-, low-, and reduced-sugar, according to ACNielsen (2005d)—are projected by NMI (2006) to reach $14.67 billion in sales in 2006, up 15% from 2005. IRI (2006b) projects high single-digit growth through 2010.
However, it appears that organic food growth is being driven by organic users broadening their purchases into more categories, rather than a significant increase in household penetration. Only 10% of consumers consume organic foods several times per week (Whole Foods, 2005).
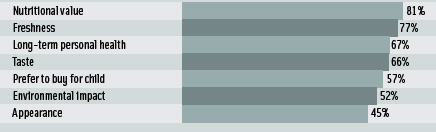 But a fast-emerging attitude shift to associate organic with freshness by 77% of shoppers and a preference for buying organic for children by 57% of shoppers could just put organic back on a meteoric growth curve (Figure 3; FMI, 2006). Marketers should capitalize on the freshness trend with fresh-looking graphics and by offering resealable packages, which are all the rage in the produce department.
ACNielsen (2005e) reports that consumers around the world are also keen on substituting organic staples for their children, with 27% in Latin America saying it is the main reason they purchase organics.
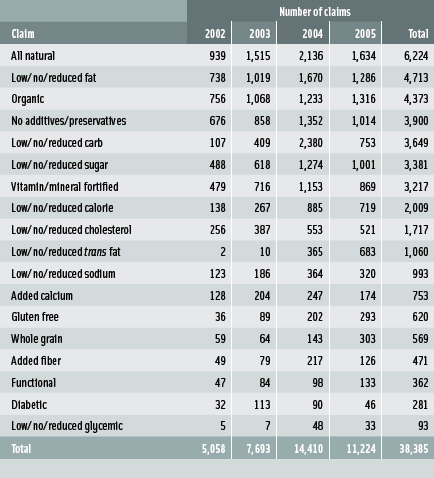 Natural foods and beverages—which have a household penetration of 94% compared to 47% for organic, according to IRI (2006b)—are projected by NMI (2006) to reach $14.44 billion in sales in 2006, up 8% over last year. Mintel (2006c) reports that all-natural products topped the list of new products introduced in 2005 with a health or wellness claim (Table 1).
Food-avoidance behavior is once again on the upswing (HealthFocus, 2005). According to Packaged Facts (2005e), 42% of adults say they are actively trying to avoid pesticide residues on produce, 38% hormones in meat/poultry, 35% antibiotics in meat/poultry, 30% GMOs, 32% preservatives, 24% food coloring/dyes, and 22% nitrites/nitrates. At the same time, concerns about humane treatment of animals, and a desire for “vegetarian-fed” and pasture-raised/free-range meat and poultry are quickly gaining mainstream attention.
Four of the nation’s top 10 poultry companies—Tyson Foods, Gold Kist, Perdue Farms, and Foster Farms—had by January 2006 stopped using antibiotics for growth promotion. They have also severely limited antibiotic use for routine disease prevention (Welse, 2006).
And with Arby’s Restaurant Group being the first to introduce a full line of natural chicken in February, the demand for natural meats and poultry will continue to grow. Arby’s Chicken Naturals™, with 100% all-natural chicken, will be served in all of the restaurant’s sandwiches, wraps, salads, and tenders. Featured menu items will include a Chicken Cordon Bleu Sandwich and others.
Just about two-thirds of consumers say that both locally grown foods and foods that come from farms that practice sustainable agriculture are important in their food and beverage purposes, and just under half are positively inclined to buy Fair Trade Certified products (NMI, 2004b). In February 2006, Wal-Mart agreed to a sustainable fishing policy (AROQ, 2006). McDonald’s began selling Fair Trade Coffee last October.
Socially responsible brands such as Newman’s Own products are continuing to attract a growing number of mainstream consumers who are concerned about protecting farmers and workers in countries where poverty is widespread, as well as ensuring the quality of their foods. Around 85% of consumers say they care about socially responsible business (NMI, 2004b).
And the incidence of vegetarian eating continues to grow differently on both sides of the age spectrum. Three out of 10 Boomers make an effort to regularly have a meatless meal, compared to 22% of Gen Xers and 19% of Gen Yers. On the other hand, 27% of Gen Yers consider themselves an occasional vegetarian and 13% a strict vegetarian (NMI, 2004a).
--- PAGE BREAK ---
9 Boosting Performance
With two-thirds of Americans very concerned about their energy levels, 21% trying to manage tiredness, and 38% admitting that fatigue is their biggest fear of aging, it’s no wonder that products that improve performance are on fire (NMI, 2006).
Needing extra energy is the No. 1 reason adults—nearly 60% of them—ate a functional food and the second reason they drank a functional beverage, just after trying to stay healthy. On the go ranked second for foods and third for beverages (Hartman, 2005).
With performance and weight control top of mind for young adults, the 74 million Gen Yers will drive a surge in the sports nutrition market. Those aged 18–25 are the highest users of energy/sports drinks (44%), sports nutrition bars (20%), protein powders (18%), and sports supplements (11%), according to NMI (2004a). One-quarter of Gen Yers always/usually choose foods and beverages daily to improve performance, 28% energy, 24% activity levels, and 15% mental performance (HealthFocus, 2005).
Sports drinks and bottled water ranked first and second on IRI’s Top 10 Growth Categories list for food, drug, and mass outlets (including Wal-Mart) with an increase in dollar sales of 25.1% and 16.5%, respectively (IRI, 2006c). PowerAde sports drink was the star performer of Coca-Cola’s third-quarter 2005, with sales up 28% (Anonymous, 2005).
Energy beverages continued to lead sales again this year, up 67% in mass markets (excluding Wal-Mart) (IRI, 2005a). ACNielsen reports that energy drink sales reached $1.79 billion for YE 4/23/05 for combined mass and off-premise sales, including convenience stores (Lempert, 2005b).
Mental alertness is also a reason that 55% of those over age 35 and 40% of those under age 35 use energy beverages (Mintel, 2005b). Younger Boomers are particularly high users of energy drinks and, along with older Boomers, heavy consumers of ready-to-drink tea and coffee (IRI, 2005b).
Many energy beverages, such as Hansen’s Natural’s Diet Red Energy, have caught the wave to diet drinks. Coca-Cola combined the benefits of sports and energy drinks in Advance by PowerAde, which “offers hydration with a boost” with B vitamins, electrolytes, taurine, and caffeine. Coca-Cola Blak is an invigorating blend of Coca-Cola and real coffee. Frappio, a decadent coffee ice cream drink, offers jitter-less energy, mental focus, and appetite suppression and is available at 7-11 stores.
Small single-shot concepts are very hot. Zipfizz™, packaged in a single-serve test-tube, is an effervescent powder delivering 25 nutrients and electrolytes.
With 2005 sales of $9.8 billion, per capita bottled water consumption is projected to jump nearly 50% by 2009, as flavored functional waters add another $800 million to the bottom line (Beverage Marketing, 2005). On average, in a two-week period, consumers drink bottled water 18 times and fruit juice 5.6 times (Aramark, 2005).
Water is the top beverage consumed on the job by 41% of workers, soft drinks 16%, and hot drinks 14%; 40% would purchase bottled water from a vending machine, if available (Aramark, 2005).
PepsiCo’s SoBe Life Water fortified with vitamins, B, C, and E is available in Pomegranate Cherry and five other flavors. RushNet, Inc.’s e-O2 Sports Water is a super-hydrating, energizing water which promotes fast muscle recovery. A Woman on Top Inc.’s Slimmer You H2O contains CitriMax to control appetite. Gatorade’s Propel Fitness Water is a good source of calcium.
And foods and beverages that help to improve learning in children and mental cognition in adult workers are also in high demand. After successful school feeding programs in Texas and the United Kingdom, omega-3s and other polyunsaturated fatty acids are finally being recognized for their cognitive-enhancing abilities. Danone Canada launched Danino, a new yogurt with omega-3s and 20 mg of DHA from fish oil, designed to support brain development in children.
--- PAGE BREAK ---
10 Fun Favorites
A Weight Watchers by Whitman’s line of chocolate candies, A Fit ’n Delicious menu at Pizza Hut, and a Crème Delight ultra-premium ice cream with less sugar, fat, and calories than regular ice cream—healthier versions of our favorite foods are popping up everywhere. And just say “Fresco Style” at Taco Bell and you’ll get a lower-fat version of your order made just for you.
For the past two years, dietetic candy, sugar-free gum, lower-calorie dessert mixes, and diet drinks have posted some of the largest annual sales increases in U.S. supermarkets (Sloan, 2005). And with 53% of consumers typically watching the sugar content of their diet, expect marketers to offer more-innovative and healthier snack and beverage choices.
Carbonated soft drinks posted the first volume decline in two decades in 2005 as per capita soda consumption fell from 837 servings in 2004 to 828 (Anonymous, 2006). In response, Coca-Cola launched Gold Peak teas and a Godiva-based dairy drink, and PepsiCo is expanding its Starbucks line of ready-to-drink beverages and readying Ben & Jerry’s licensed dairy drinks.
Elite FX’s Celsius, a soft drink clinically proven to burn calories, won Beverage Industry magazine’s2005 Best New Product Award out of 1,400 products. Global Beverages’ Kool Cow fortified sparkling drinks in kid-friendly flavors like Peach Mango are sugar-free and made with skim milk powder.
The Snack Factory’s Pretzel Crisps are all-natural, fat-free, pretzel crackers. Endangered Species Chocolate Co. introduced 1.4-oz portion-controlled Organic Baby Bars, including a Dark Chocolate Marine Iguana bar and a Key Lime Chiffon Puffin bar.
Belgian chocolatier New Tree has created nine 100% natural chocolate bars with unique health properties via added fruit and plant extracts. Quaker Oats’ new fortified breakfast cookies are an excellent source of calcium and iron and contain other key nutrients.
And ailment sufferers have a sweet tooth, too. While diabetics are more likely than the average population to purchase low-calorie soft drinks, they’re also more likely to buy cookies and frozen novelties; obese adults are more likely to purchase sandwich spreads, chocolate candy, and ice cream. Those consumers age 45–64 with high cholesterol are more likely to purchase snack nuts, cookies, potato chips, and chocolate candy than the general population (IRI, 2005c).
With more time for relaxation and entertaining, Boomers are driving consumption of spirits, wine, and light beer to the highest level in decades, and they’re looking for healthier options. Anheuser-Busch Peels, aimed at women, is a colorfully bright alcoholic beverage made with 100% real fruit juice.
Heineken is creating a new Luxury Light beer category with its Heineken Premium Light imported beer. Michelob Ultra Amber is the first extension of the Michelob Ultra brand, sporting only 115 calories, 3 g of carbs, and 5% alcohol by volume. Napa Valley’s Beringer Blass Wine Estates is one of the few major wineries offering lower-calorie and lower-alcohol wines, including White Lie Early Season Chardonnay.
As kids leave the nest, Boomers are turning to pets—especially cats—for companionship, sending pet ownership and pet food sales to an all-time high, projected to reach $16.7 billion by 2008 (Packaged Facts, 2004). Boomers are imposing their own health values on their pets, sending sales of kosher, weight-directed, and all-natural/organic pet foods and even bottled pet water soaring. And with 90 million cats and 73 million dogs in the U.S., that’s a lot of chow.
Restaurant favorites continue to get healthier, too. Chili’s features a lower-fat and -calorie Guiltless Grill, Applebee’s lists Weight Watchers points on menus, and Ruby Tuesday offers a Smart Eating plan. Red Lobster has a Lighthouse Menu providing fat, calorie, and carb information, and offers baked and broiled fish and chicken alternatives on its Clawde’s Cove children’s menu. Dairy Queen has low-calorie, low-fat, and gluten-free ice cream, and Starbucks offers a new Frappuccino Light Blended Coffee.
Convenience stores are touting healthier fare, as well. 7-11 stores, which serve more than 6 million Americans every day, added a fresh Pick Smart line of sandwiches, grilled items, and packaged baked goods with no more than 10 g of fat and 420 calories.
And with more than 100 million Americans buying from a vending machine every day, smart marketers, such as Aramark Refreshment Services Inc. with its Just4You vending program, are color-coding snacks and beverages to make healthier selections easier.
Taste and Quality Remain Important
With the number of overweight people worldwide expected to increase to 1.5 billion by 2015, heart disease now the No. 1 cause of death, and diabetes projected to afflict 230 million adults and children by 2020 (WHO, 2005), the functional food market will remain strong.
However, to effectively compete, marketers must realize that the same parameters that are important in traditional food and beverage products—taste, convenience, quality, premium ingredients, and often value—are equally as important in healthier fare.
A. Elizabeth Sloan, a Professional Member of IFT, is President, Sloan Trends & Solutions, Inc., P.O. Box 461149, Escondido, CA 92046 ([email protected]).
References
AAP, 2000. Cholesterol screening in children and adolescents. Am. Acad. of Pediatrics. Pediatrics 105: 637-638.
AAP. 2004. Blood pressure screening should start by age 3, according to new guidelines. Press release, Aug. 2. Am. Acad. of Pediatrics, Elk Grove Village, Ill. www.aap.org.
AAP. 2006. AAP updates guidelines for stronger bones. Press release, Feb. 6.
ACNielsen. 2005a. What’s hot around the globe. Jan. Schaumburg, Ill. www.acnielsen.com.
ACNielsen. 2005b. Functional food & organics. Nov.
ACNielsen. 2005c. Consumer attitudes toward organic foods. Dec.
ACNielsen, 2005d. Organic, no-/low–sugar products top list of best-performing ‘good for you’ product segments. Press release, May, 2.
ACNielsen. 2005e. Label trends. March.
ACNielsen. 2006a. ACNielsen unveils predictions for 2006. Press release, Jan. 30.
ACNielsen. 2006b. The relevance of the aging population: Ask what the “me generation” can do for you. ACNielsen Consumer Insights magazine, March.
AHA. 2006a. Heart disease and stroke statistics—2006 update. Circulation, published online Jan. 11. Am. Heart Assn., Dallas, Tex. www.americanheart.org.
AHA. 2006b. Kids should be focus of blood pressure-lowering efforts, says AHA. Press release, Feb. 6.
Anonymous. 2005. Sports drink heads Coca-Cola rise. Oct. 20. Nutra-USA Ingredients. com. www.nutraingredients-usa.com.
Anonymous. 2006. Soda share shrinks for first time in decades. Brandweek, March 8. www.brandweek.com.
Aramark. 2005. 2005 Dining styles research. Philadelphia, Pa. www.aramarkusa.com.
Aroq. 2006. U.S.: Wal-Mart agrees sustainable fishing policy. Feb. 6. Just-food.com.
Arthritis Foundation, 2005. Facts. Atlanta, Ga. www.arthritis.org.
Beverage Marketing. 2005. The multiple beverage marketplace in the U.S. June. New York. www.beveragemarketing.com.
CDC. 2006. Epidemiology of type 1 and type diabetes mellitus among North American children and adolescents. Diabetes Projects. Centers for Disease Control and Prevention, Atlanta, Ga. www.cdc.gov/diabetes/projects/cda2.htm.
FMI. 2004. Report from the supermarket pharmacy study. Food Mktg. Inst., Washington, D.C. www.fmi.org.
FMI. 2006. Meeting the needs of family, health and wellness. Food Marketing Institute/Prevention Magazine.
Frost & Sullivan. 2006. U.S. food fiber market. New York. www.food.frost.com.
Hartman Group. 2005. Wellness interactive on-line study: Functional foods study. Bellevue, Wash. www.Hartman-Group.com.
HealthFocus. 2005. U.S. trend report. St. Petersburg, Fla. www.healthfocus.com.
IRI. 2004. Rx centric retailing. Times & Trends, Nov.
IRI. 2005a. Convenience products. Times & Trends, Oct.
IRI. 2005b. Aging Baby Boomers. Times & Trends, Jan.
IRI. 2005c. Chronic disease. Times & Trends, June.
IRI. 2006a. 2005 New product pacesetters: Leading new CPG brands. Times & Trends, March.
IRI. 2006b. Healthy eating trends: Innovative solutions to evolving consumer needs. Times & Trends. Jan.
IRI. 2006c. 2005 CPG year in review: A remarkable year of challenges and wins. Times & Trends, Feb.
Kruse, N. 2005. State of the plate; Health and nutrition on the menu. Presented at Nation’s Restaurant News Health and Nutrition Summit, Sept. 15, Orlando, Fla.
Lempert, P. 2005a. Grocers discover new market: Gluten sensitive consumers. Facts, Figures & the Future, Dec 12, pp. 4-5. Food Mktg. Inst., Washington, D.C. www.fmi.org.
Lempert, P. 2005b. Alternative drinks energize beverage marketplace. Facts, Figures & the Future, June 13, pp. 8-9.
Lempert, P. 2006a. Slowing birth rate and increased health interest in baby nutrition translates to a burgeoning subcategory. Facts, Figures & the Future, Jan. 16, pp. 7-8.
Lempert, P. 2006b. Has antioxidant become the most powerful word in the supermarket? Facts, Figures & the Future, Jan. 16, pp. 4-5.
Mintel. 2005a. Heart health–U.S.–August 2005. Chicago. www.mintel.com.
Mintel. 2005b. Energy drinks report. July.
Mintel. 2006a. U.S. product launches featuring omega-3,6 claims.
Mintel. 2006b. Ingredient health claims on menus.
Mintel. 2006c. Health & wellness claims in the U.S.
MSI. 2005. Gallup study of hot tea. Multi-Sponsor Surveys, Inc., Princeton, N.J. www.multisponsor.com.
NCHS. 2005a. Menopause statistics. Natl. Center for Health Statistics, Centers for Disease Control and Prevention, Atlanta, Ga. www.cdc.gov/nchs.
NCHS. 2005b. Diabetes statistics.
NHLBI. 2001. NHLBI study shows reduced fat intake to lower cholesterol is safe and beneficial to children. Press release, Feb. 5. Natl. Heart, Lung, and Blood Inst., Bethesda, Md. www.nhlbi.nih.gov.
NHLBI. 2005. Diagnosis, evaluation, and treatment of high blood pressure in children and adolescents.
NIDDK. 2005. Digestive disease statistics. Natl. Inst. of Diabetes and Digestive and Kidney Diseases. Bethesda Md. www.niddk.nih.gov.
NIH. 2004. Average blood pressure levels on rise among American children/teenagers. Press release, May 4. Natl. Insts. of Health, Bethesda, Md. www.nih.gov.
NMI. 2004a. Health & wellness trends database, Natural Mktg. Inst., Harleysville, Pa. www.nmisolutions.com.
NMI. 2004b. NMI LOHAS consumer trends data base.
NMI. 2005a. Health & wellness trends database.
NMI. 2005b. Healthy aging/boomer database.
NMI. 2006. Health & wellness trends database.
NOF. 2005. Osteoporosis statistics. Natl. Osteoporosis Foundation, Washington, D.C. www.nof.org.
NPD. 2005. Fruit is #1 snack food consumed by kids. Press release, June 16. NPD Group, Port Washington, N.Y. www.npdfoodworld.com.
Packaged Facts. 2004. The U.S. pet food market. June. Marketresearch.com, New York. www.packagedfacts.com.
Packaged Facts. 2005a. The market trends: Baby and toddler foods and beverages. Feb.
Packaged Facts. 2005b. The U.S. market for weight-loss products & trends. Nov.
Packaged Facts. 2005c. The U.S. market for tea. Aug.
Packaged Facts. 2005d. The U.S. market for whole grain and high fiber foods.
Packaged Facts. 2005e. Understanding consumer attitudes about food safety.
PBHF. 2005. State of the plate 2005 study on America’s consumption of fruits and vegetables. Produce for Better Health Foundation, Wilmington, Del. www.PBHFoundation.org.
Sloan, A.E. 2005. Cruising the center store aisles. Food Technol. 59(10): 29, 30, 33-39.
Sloan Trends. 2006a. The mainstreaming of phytochemicals. March. Escondido, Calif. [email protected].
Sloan Trends. 2006b. The blood sugar management market. March.
Sloan Trends. 2006c. Great going for gluten free. March.
Sodexho. 2004. Kids and school meals—A national study of students and their parents. Gaithersburg, Md. www.sodexhousa.com.
Technomic, 2005 Consumer update: “What we want.” Chicago. www.technomic.com.
USB. 2005. Consumer attitudes about nutrition 2004-2005. United Soybean Board, Chesterfield, Mo. www.talksoy.com.
USSG. 2000. U.S. Surgeon General report on oral health. May. Natl. Insts. of Health, Bethesda, Md. www.nih.gov.
Welse, E. 2006. Natural chickens take flight. USA Today, Jan. 24. www.usatoday.com.
Whole Foods. 2005. Nearly two-thirds of Americans have tried organic foods and beverages. Press release, Nov. 18. Whole Foods Market, Austin, Tex. www.wholefoods.com.
WHO, 2005. World health statistics 2005. World Health Org. Geneva, Switzerland. www.who.int.