
Reinventing Restaurants
Older diners, a desire for healthier foods, and a move from meals to snacks represent opportunities for today’s foodservice industry to profitably change course.
Due to an economic slowdown in the United States, consumers are eating out less often, resulting in enormous repercussions in the foodservice industry. More than one-third (35%) of consumers are eating or buying dinners out less frequently than they did one year ago (Technomic, 2008a). Money is the main reason—77% have reduced their restaurant visits to save money, 59% have less money to spend, and 46% are concerned about the price of restaurant meals.
Along with the economy, changing demographics, healthier lifestyles, the blurring of snacks and meals, and, in some cases, boredom with menus that have changed little over the past 20 years—or are too focused on young, trendy adults—are taking their toll on the foodservice industry. Rising food prices, food safety recalls, menu labeling mandates, and retail competition for the away-from-home dining dollar have also cut deeply into the bottom line. In fact, Technomic Inc. projects that 2008 will end with the lowest growth rate in restaurant sales since 1991—2.1% (Walkup, 2008).
Until recently, the restaurant industry had been fat and happy for years, and to ensure that it continues on a successful path, it’s time for a change—a fact that a growing number of foodservice operators seem to recognize. Famous for more than 65 years for its Colonel Sanders Original Recipe Fried Chicken, Kentucky Fried Chicken Corp. is test marketing Kentucky Grilled Chicken, with nationwide rollouts expected early next year. Foodservice sales of French fries have been declining for the past three years, and were down 7% in the first quarter of 2008; the biggest cutbacks were among kids younger than age 6 and those age 18–24 (Glazer, 2008a). McDonald’s reportedly will have a coffee bar with a barista in every outlet by 2009. For a growing number of consumers, pizza has shifted to a weekend treat (Technomic, 2008b). Clearly, change is in the air—and on menus.
But when industry mega-drivers shift and regulators mandate new rules and/or procedures, they frequently create enormous opportunities—and, regardless of an economic slowdown, those who take advantage of them first will win.
Not Business as Usual
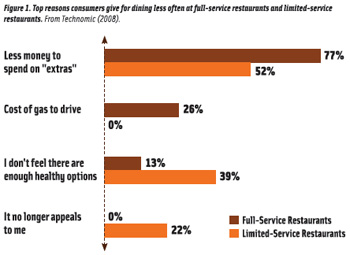
Total restaurant visits were flat for the 52-week period ending February 2008 (NPD, 2008a). In March 2008, one-third (35%) of consumers reported visiting limited-service/fast-food restaurants less often than they did three months earlier. While half (52%) cited financial reasons, 39% cut back due to a shortage of healthy options, and 22% did so because these restaurants no longer appealed to them (Technomic, 2008c). One-third (35%) cut back on visits to full-service restaurants.
Young adults contributed significantly to the drop in restaurant traffic; those age 18–24 made 15 fewer visits per person to restaurants for the 52-week period ending March 2008; those age 25–35 made three fewer visits. Older adults age 50–64 made five more visits per capita; those 65+ made seven more visits (NPD, 2008b).
Dinner was the daypart hardest hit, with traffic down 1% for the 52-week period ending February 2008; lunch traffic was flat. Breakfast and snacks remained the bright spots in the foodservice industry, with traffic up 5% and 4%, respectively (Glazer, 2008c). Dinner traffic fell 2% at fast-food restaurants. It dropped 1% in mid-scale restaurants and 8% in fine-dining establishments. Casual dining grew 1%. From December 2007 to February 2008, fast-food pizza traffic fell 43%, hamburger chain traffic was down 36%, and casual dining steak restaurants were down 14% (Glazer, 2008d).
--- PAGE BREAK ---
Eight in 10 restaurant meals that were cut back are now eaten at home; 20% were replaced by retail meals (Technomic, 2008c). In a finding that clearly has longer-term repercussions, NPD found that some consumers aren’t dining out because they find eating at home more leisurely, more enjoyable, and healthier, in addition to the fact that it provides for more family time (Glazer, 2008d). Restaurateurs should focus on ethnic and boldly flavored meals that can’t easily be made at home to keep consumers’ attention. Party platters and food kits, such as Rubio’s Fresh Mexican Grill’s A-Go-Go Beach Mex® Buffets Build-Your-Own Taco Bar, for entertaining and family meals are another big opportunity. One-third (36%) of family, 28% of casual, and 16% of fine-dining restaurants now offer retail food products (NRA, 2008).
Although takeout still accounts for 61% of all restaurant meals, takeout was flat for the 52-week period ending February 2008, while on-premise dining saw a 1% uptick (NPD, 2008d).
Full-service takeout in May 2008 was down by 6% from February; fewer heavy users ordered full-service restaurant takeout twice a week or more (Technomic, 2008d). Pizza, burgers/sandwiches, Chinese, Mexican, breakfast foods, Italian, seafood/fish, Asian, and steak are Americans’ favorite takeout foods. With gas prices high, there is a huge opportunity for home delivery. Domino’s now delivers sub sandwiches and Pizza Hut offers Tuscani pasta takeout meals. Fast food enjoys the bulk (64%) of prepared-meal takeout traffic, retail 13%, mid-scale 12%, and casual dining 11% (Glazer, 2007a).
Those purchasing prepared meals from retailers two-to-three times a month or more jumped 10% from November 2007 to May 2008 (Technomic, 2008d). Convenience stores enjoy 54% of all foodservice retail traffic, followed by supermarkets at 32%, discount stores 11%, and price clubs 3%.
Wal-Mart’s new Marketside concept, which is serving prepared meals such as take-and-bake pizzas, is projected to grow to 1,000 units. The retailer plans to open 10 of the 15,000-sq-ft Marketside stores initially, including four in the Phoenix area, where they will be competing directly with Tesco’s recently launched U.S. Fresh & Easy store concept.
Consumers are brown bagging more often—up three meals per person last year (Glazer, 2008e). Cost and health were the two top reasons. Restaurants are offering bring-from-home-style lunches. Honeybaked Ham markets a Supreme Lunch Box, and Rubio’s has a multi-compartment Baja Grill Burrito Baja Box.
Age Adjustment
A new day is dawning in the restaurant world, where chefs simultaneously will have to cater to the flavor, form, and food preferences of distinctly different generations. Returning to restaurants after the kids have gone, the nearly 100 million Americans age 50+ are now driving growth in the foodservice industry. Those age 55–64 are the highest-per-capita restaurant spenders, followed by those 45–54 (NRA, 2008).
Those 50+ are well rooted in classic Continental and European cooking techniques and cuisine. They’re the No. 1 consumers of fish/seafood, duck, pork, steak, veal, ham, turkey, lamb, ribs, stews, and pot pies, yet menus are not keeping pace. Members of the 50+ crowd are the most likely to order soup, salad, side vegetables, fruit, and dessert. Raised on the "Basic 4," they look for a balanced plate—a protein, starch, vegetable, and bread; they’re the No. 1 consumers of potatoes and beans.
--- PAGE BREAK ---
Technomic reports that more than half of older adults often trade in their potatoes for vegetables in full-service restaurants (Technomic, 2006). American Culinary Assn. chefs named zucchini, chili peppers, cucumbers, exotic mushrooms, root vegetables, potato varietals, and edamame among the hot vegetable trends. Pomegranate, dragon fruit, figs, passion fruit, prickly pear, and lychee are on the list of trendiest new fruits (NRA, 2007).
Nearly one-quarter of diners would order more soups if they were healthier and more interesting (Technomic, 2007a). Salad orders also are on the rise, with 59% of quick-service restaurant operators saying their patrons ordered more entrée salads last year (NRA, 2008). Operators are responding to customer demand for more crunch and protein; 56% of new salads menued in 2007 contained a nut, with almonds leading the way (Sterling-Rice, 2008). Expect the next wave of salads to be Japanese, Southern American, Thai, and Chinese varieties.
While young Gen Yers age 18–24 are still the most-frequent restaurant patrons, NPD reports their visits peaked in 2005, falling from 265 visits annually to 240 in June 2008 (Glazer, 2008f). To pique the interest of Gen Y diners, operators are upgrading pizza with flatbread crusts, exotic cheeses, caramelized/smoked toppings, and trendy veggies. Thai, teriyaki-bacon, "Black & Blue," "Smokey Bourbon," pot roast, and crab are among the latest gourmet burger makeovers.
Gen Yers are the most experimental and experiential of all diners and have the highest interest in ethnic and gourmet foods. Those age 18–34 are three times as likely to eat Thai, Greek, Indian, French, Cuban, German, and Korean more frequently than their older counterparts; 27% eat sushi two or more times a month (Technomic, 2007b). Fusion tops the list of up-and-coming ethnic food trends, with 61% of all diners saying they find the technique "extremely appealing" (Technomic, 2007c).
Gen Yers are the heaviest consumers of chicken, energy beverages, smoothies, and specialty coffees. Schlotzsky’s Hip Chick Trio chicken sandwiches in Smokey Cheddar, Cordon Bleu, and Fiesta varieties are right on target.
The Center for Culinary Development found that Gen Yers enjoy intense flavors—spices, peppers, smoked, and char-grilled; layered flavors—marinades, crusts, and coatings; trendy handheld forms—dumplings, steamed buns, and empanadas; and healthy proteins such as salmon. Spicy and hot, savory-sweet, "balanced Asian," spirits, and fresh flavors like cilantro or fruit rate high with Gen Yers (Nielsen, 2008). McCormick predicts that wasabi/mustard, mango/chipotle, green tea, Manchego, Caprese/bruschetta, and smoked paprika are up-and-coming snack flavors.
Gen Yers see customized choices, mix-ins, interactive foods (like flatbread and bean dips), multiple-sauce choices, and build-your-own concepts as fun. Combo appetizers, mix-and-match options, indulgent and healthful products, and trendy items like superfruits are all highly appealing. Members of Gen Y are fans of textures that are crunchy, creamy (as in an avocado), and smooth. Appetizers to be shared are popular, as well.
Snack occasions at restaurants have been on the upswing for the past three years and now account for 12.1 billion visits; 1.4 billion were to quick-service restaurants for the year ended May 2007 (Glazer, 2007b). Technomic (2007d) reports that 40% of mid-evening, 39% of late evening, 32% of mid-afternoon, and 26% of mid-morning snacks are purchased away from home and eaten at home. Nearly one-third of consumers buy and consume a mid-morning snack away-from home, one-quarter do so for mid-afternoon snacking, 20% for late evening, and 17% for mid-evening. The snack daypart is seeing the most growth in better-for-you products, according to NPD. In 2007, more than half of all consumers reported eating a better-for-you product in between meals, up from 44% in 2004 (Glazer, 2008g). Snackable products for late night and after school, as well as bar snacks, are all very big ideas.
Small plates and mini-portions are another popular trend, with more than eight in 10 diners preferring to eat at restaurants with various portion sizes. No wonder Quizno’s Sammies and T.G.I. Friday’s Sliders are such big hits. While only 16% of patrons ordered a dessert in 2007, look for bite-sized desserts to bring back the sweet-focused crowd (Sloan, 2008a).
--- PAGE BREAK ---
With four million young adults turning age 21 every year for the next 10 years, and boomers’ increasing freedom and desire to socialize, a new bar scene has emerged, boosting bar morsels and healthier cocktail companions to unprecedented popularity (Sloan, 2007). Shareable platters, Asian/Mexican tidbits, vegetables, seafood, tartare products, Carpaccio, and dips are the new appetizer trends, according to MenuMine (2008). Specialty and classic cocktail sales are skyrocketing.
With the vast majority of parents saying their children participate in the decision to choose a restaurant, kids’ taste preferences becoming more adult-like around age 7–8, and America in the midst of its largest baby boom in history, the time to upgrade the kids’ menu is now. More than 90% of schools serve tacos, burritos, and quesadillas; 66% serve Asian stir-fry, sushi, and egg rolls. Spanikopitas, kabobs, hummus dip, calamari, falafel, tabouli, curry, and jasmine rice are other common school menu offerings, according to NPD.
Bold and exotic flavors are fast becoming important selection criteria for kids. They rank third—right after cartoon characters and shape—as food-selection influencers (Yankelovich, 2007). Mintel Menu Insights reports that chicken fingers, macaroni and cheese, grilled cheese sandwiches, burgers, and pizza are the items most frequently featured on kids’ menus, but there is room to upgrade offerings for the younger set—in terms of both flavor and healthfulness. International Flavors & Fragrances reports that sour cream and onion, buffalo, taco, and honey mustard are among the new classic kids’ flavors.
To attract parents and their children, restaurants could create a "mixologist" menu for kids’ drinks, feature kid-sized portions of regular menu items, or offer children’s appetizers and courses to coincide with their parents’ dining pace. Samplers and "build your own" menu items are other recommended options for foodservice operators.
Healthy Does It
With sales of healthy consumer foods approaching $130 billion, nine in 10 consumers believing that they eat healthier at home, and 64% of adults trying to control their diet, providing more healthy menu options just makes good business sense (FMI, 2008a; Experian, 2007).
Seven in 10 adults (72%) said they tried to eat healthier in restaurants last year vs 71% in 2006, and 40% looked up restaurant nutrition information on the Internet (NRA, 2008). Those age 18–34 accounted for about one-third (32%) of all healthy/light dining visits; those age 18–24 were the fastest-growing group of healthy diners, followed by those 25–34, and households with incomes greater than $100,000 (Glazer, 2008g).
Healthy options are most important to those who use restaurants out of necessity—workers on their lunch hour, frequent business diners, and those who don’t have time to cook (Mintel Menu Insights, 2007a). Only 14% choose restaurants for a specific healthy food item, however, (Glazer, 2008g).
Two-thirds (63%) of fast-food diners would like to see more fresh ingredients on menus, 57% are seeking more healthy meals, 34% want more natural ingredients, and 19% would like to see more organic ingredients, according to Mintel Menu Insights, 2007. Four in 10 patrons of full-service restaurants (41%) feel they offer "too few" healthy sides (Technomic, 2007d). In addition, 39% say there are not enough healthy appetizers or desserts, 29% cite a shortage of healthy salads, and 28% mention entrees and sandwiches (Technomic, 2007d). When consumers order for health reasons, smoothies, cold cut combos, turkey sandwiches, snack bars, grilled chicken sandwiches, fruit, salty snacks, ham sandwiches, main dish salads, and bottled water are their top menu choices (NPD, 2008e).
--- PAGE BREAK ---
Nearly half of consumers say that "fresh" is the most important characteristic of a healthy food or beverage consumed away from home (Technomic, 2005). In 2008, freshly-baked, squeezed, cut, brewed, sliced, chopped, grated, ground, mashed, and grilled were the top fresh descriptors on menus (Caranfa, 2008).
Health concerns in restaurants fall into three tiers: fat; calories/sugar/sodium; and carbs/protein (Technomic, 2007e).The type of ingredient is the way half (55%) of diners decide if a food is healthy. Other criteria and the percentage of consumers who use it are as follows: amount of fat (50%); types of oil used (35%); number of calories (34%); amount of sodium (32%); portion size (31%); and amount of carbs (23%).
With sales of low-fat food jumping to $48 billion in mass channels in 2007, an increase of 12%, and low-cholesterol foods up 8% to $10 billion, according to ACNielsen data, operators need to stay focused on fats. But, despite widespread mandates for trans fat reduction, consumers’ interest in trans fat is waning, and concern over saturated fat is gaining, reports Sloan Trends’ TrendSense™ model (Sloan, 2008b). Moreover, with half of consumers believing that healthy eating requires both moderation of "bad" fats and incorporation of "good" fats, operators should promote the healthfulness of their oils, such as olive dipping oils.
With eight in 10 consumers taking some action to manage their weight in 2007 and low-calorie/light consumer food sales up 6% to $17 billion, it’s not surprising that calorie concerns in restaurants are moving into the spotlight. QSR magazine found that 42% of fast-food patrons were watching calories vs 34% who were tracking fat grams and 30% who were concerned about trans fat (QSR, 2007).
Including calorie counts on restaurant menus became a reality for chains with more than 15 units in New York City this past May; 20+ governing bodies have new laws pending, including those in San Francisco and Seattle (Elan, 2008).
Savvy marketers like Jack-in-the-Box have put a symbol on their menus flagging lower-calorie items; Taco Bell products prepared Fresco-style feature calorie call-outs on menu boards. Dunkin’ Donuts introduced its DDSMART menu of better-for-you options. The Cheesecake Factory’s Weight Management Salads have been very well received. KFC’s new Grilled Chicken has as much as 50% fewer calories, half the sodium, and up to two-thirds less fat than KFC’s regular chicken.
Restaurants reformulating menus need to be aware that calories from fat are the new culprit in the weight-loss war. Just over one-third of consumers are cutting calories from fat as a weight-loss technique; 33% believe that calories from fat are the most likely to cause weight gain, led by those age 18–24 (IFIC, 2008).
Sodium-reduced foods already represent a $16 billion mainstream food market, so it is likely that sodium reduction will be among the next big trends for foods consumed away from home (ACNielsen, 2008). About one-third (31%) of consumers are most careful about the amount of sodium they eat when dining in a restaurant or eating takeout food; 57% think restaurants should post the salt content of their food (Technomic, 2008e).
The top 10 menu-item health claims are: vegetarian/vegan, low-carb, low-fat, gluten-free, light, organic, trans fat–free, natural, healthy, and low-calorie (Mintel Menu Insights, 2007). The health claims with the most growth on menus are low-fat, gluten-free, vegetarian, low-calorie, and trans fat–free.
Overall, specific healthy menu choices have about the same level of appeal as highly indulgent items (Technomic, 2007e). Heart-healthy menu claims influence menu choices for about 15% of diners, low-fat for 12%, low-calorie 9%, and gluten-free 7%. Meanwhile, fried foods lured 16%, cheese items 15%, "loaded" 11%, and sweet 9%.
--- PAGE BREAK ---
Local Motions
A series of new "ethical" food descriptors continue to influence diners’ menu selections; these descriptors not only give a sense of being closer to the farm, but of being kinder to animals and the environment, too. Locally grown and organic produce, craft, artisan, and micro-brew beer, sustainable seafood, grass-fed items, micro-distilled artisanal liquors, organic wine, and seasonal beers were among the top 20 hottest trends cited by American Culinary Foundation Chefs (NRA, 2007).
Consumers already are extremely familiar with the terms Kosher (93% awareness), locally raised/grown (90%), farm-raised (84%), and free-range (70%). At least half have heard of humane treatment–certified, cage-free, or grass/vegetarian-fed, and 45% are familiar with certified vegan (IDDBA, 2008). Locally raised/grown is most important to nearly two-thirds (63%) of consumers, followed by farm-raised (34%), and humane treatment (30%). Boomers and seniors find locally grown more important. Fair trade and natural are more important to Gen Y than to other shoppers. Hartman (2007) reports that one in five consumers (18%) are interested in fair trade claims.
To create a healthy food halo, fine-dining restaurants are most likely to use an organic descriptor, followed by pesticide-free, natural, low-fat, naturally raised, lean, light, vegetarian, USDA, cholesterol-free, milk-fed, low-calorie, and sugar-free descriptors (Caranfa, 2008). Interestingly, there are more organic than natural claims being made on menus today, yet natural foods have greater overall appeal than organic to restaurant diners, 65% vs 48% (Technomic 2007d). In addition, one-third of fast-food customers said they’d like to see more natural ingredients on the menu, vs only one in five (19%) who wanted more organic options (NRA, 2008).
Local foods are extremely appealing to 31% of diners; organic has that appeal for 24% (Technomic, 2008f).
Increasingly, consumers are policing their foods to avoid components that they believe are harmful. No hormones/antibiotics is now the third-most-important label phrase when selecting foods and beverages, with one-third (35%) of shoppers saying that avoiding them is very or somewhat important. The No. 1 and 2 issues are, respectively, fresh, cited by 75%, and pesticide-free, noted by 48% (Hartman, 2008). Chipotle Mexican Grill’s naturally raised meats are free of antibiotics and added growth hormones, fed a vegetarian diet, and humanely raised.
Menu Makers
In 2007, servings of chicken sandwiches, breakfast sandwiches, and specialty coffee topped the list of menu items that made strong incremental gains in servings and that appeared more frequently on menus (Glazer, 2008h). Grilled chicken sandwiches outperformed fried (grilled up 10% vs 5% for fried), and breakfast burritos/wraps bested breakfast sandwiches (13% vs 5% growth). Other menu items in the top 15 included fruit, bagels, cinnamon rolls, and burgers. Iced tea, specialty coffee, and bottled water topped the list of drinks with the largest increase in servings. Smoothies were up 12%, hot chocolate 16%, and frozen/slushy soft drinks 7%.
McDonald’s is planning to add a Southern-style chicken breakfast biscuit later this year, and other major chains are now adding nontraditional breakfast sandwiches to their menus. Jack-in-the-Box offers a Sirloin Steak and Egg Burrito.
Nearly all types of specialty coffee except flavored coffees saw double-digit servings growth in 2007 (Glazer, 2008h). Hot cappuccino/espresso/latte is the largest segment and registered double-digit growth. The iced/frozen/slushy segment also enjoyed strong growth.
--- PAGE BREAK ---
Crisp, creamy, and homemade are the most frequent menu descriptors across casual, quick-service, and fast-casual restaurants, right after fresh (Caranfa, 2008). The desire for crunch and crispy are driving even greater interest in grains, nuts, seeds, and crusts. Ancient grains, including quinoa, amaranth, bulgur, and spelt, are making their way onto menus, parallel with the popularity of couscous, polenta, lentils, beans, barley, and fresh pasta.
When it comes to preparation, layering, stuffing, marinating, and crusting are in vogue. Braising, sautéing, pan-searing, and smoking, especially with hickory, applewood, and mesquite, will remain center stage. Poaching, aging, curing, salting, and breading (with coconut, cornmeal, and/or Parmesan cheese) are preparation techniques that are moving onto chain menus. Descriptors that include steamed, raw, chilled, marinated, sesame-crusted, spice-rubbed, horseradish-crusted-and-floured, and Meuniere-seasoned are appearing on upscale restaurant menus (MenuMine, 2008).
New trends in protein entrees on menus include more products that are sustainable, grass-fed, or free-range, as well as alternative meats, duck, and sea bass (NRA, 2007). Slow-cooked meats, including pot roast and prime rib, carne asada, and premium meats, including Angus, cured hams, and grass-fed beef, are fueling the hot trend in specialty sandwiches. Specifically, watch for Greek, Cajun, Southern American, and Pan Asian sandwich cuisines to take shape.
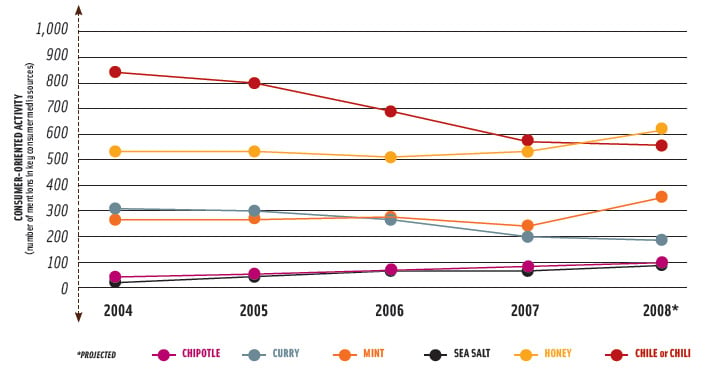
Lightly seasoned, lightly salted, nutty, tart, tangy, sweet and sour, hot and sour, and herbed are some of the descriptors emerging on cutting-edge menus (MenuMine, 2008). Two of the main seasonings that appear to be making the move from white-tablecloth to chain-restaurant menus are basil and cilantro (MenuMine, 2008). While chili and curry trend lines are declining among consumers, sea salt, honey, mint, and chipotle are increasing in 2008, according to the FlavorSense™ model (Figure 2, Sloan 2008c). Vinegars, aged meats, infused oils, and chutneys are other leading flavor trends. Also noteworthy are versatile cheeses, including blue cheese, feta, Asiago, Manchego, and a variety of quesos.
While appetizers, desserts, and beverages have taken a downturn due to the ongoing economic crunch, there is an opportunity to target high-spending older diners by presenting both healthy and classic appetizers, drinks, and desserts. Operators should consider using descriptors such as cool, sour, seasoned, candied, spiced, bitter, nutty, tart, tangy, and spicy to attract this audience.
For sandwiches, consumers have said they’d pay more for premium meats, freshly baked bread, and premium cheese (Technomic, 2008g). The aroma and taste of bread baked fresh daily in the restaurant was highly appealing to 43% in connection with breakfast and to 40% in relation to lunch.
Lastly, as consumers in some venues battle menu boredom, limited-time offerings, unique signature items, and the customization factor can be tie-breakers when it comes to a restaurant choice. More than half (58%) of restaurant patrons want to be able to substitute or choose a side dish; 29% said they sometimes make a meal out of appetizers (Technomic, 2008h).
To capture and capitalize on the unique tastes of today’s diners, operators not only need to look forward to new flavors, cuisines, and ideas, but also behind, as much of the future incremental business will come from the over-50 crowd. Snacks, breakfast, mini portions, and healthy choices in flavors and formats that appeal to both Gen Y and boomer patrons will surely change the course of restaurant menus in 2008 and beyond.
by A. Elizabeth Sloan , a Professional Member of IFT and Contributing Editor of Food Technology, is President, Sloan Trends Inc., 2958 Sunset Hills, Suite 202, Escondido, CA 92025 ([email protected]).
References
ACNielsen. 2008. LabelTrends for year ending April 18, 2008. ACNielsen, Schaumberg, Ill. www.acnielsen.com.
Baker, Brian. 2007. What consumers say isn’t always what they do. QSR. June. pp. 60-63.
Caranfa, M. 2008. The fresh factor. Presented at Ann. Mtg., Institute of Food Technologists, New Orleans, La., June 28-July 1.
Elan, E. 2008. NYC’s law forcing on-menu calorie disclosure impels compliance plans. Nation’s Restaurant News 42(19): 1, 44.
Experian. 2007. Experian Market Research Fall Consumer Survey. Experian Market Research, New York, N.Y. www.smrb.com.
FMI. 2008. Shopping for Health. Food Mktg. Institute, Crystal City, Va. www.fmi.org.
Glazer, F. 2007a. NPD: Retailers see sales boom from prepared meals, snacks. Nation’s Restaurant News 41(8): 16.
Glazer, F. 2007b. NPD: Quick-service operators feast on growing snack traffic. Nation’s Restaurant News 41(34): 14.
Glazer, F. 2008a. NPD: Weak traffic, more side choices cut into French-fry sales. Nation’s Restaurant News 42(23): 16.
Glazer, F. 2008b. NPD: Operators prepare for another difficult year in 2008. Nation’s Restaurant News. 42(1): 16.
Glazer, F. 2008c. NPD: Customers seek value during economic downturn. Nation’s Restaurant News. 42(13): 16.
Glazer, F. 2008d. Slumping supper traffic the result of more than just economic woes. Nation’s Restaurant News. 42(19): 14.
Glazer, F. 2008e.Financial, health concerns drive increase in "brown bagging." Nation’s Restaurant News. 42(35): 18.
Glazer, F. 2008f. NPD: Young adult restaurant visits decline across segments. Nation’s Restaurant News. 42(33): 16.
Glazer, F. 2008g. NPD: Consumers seek out restaurants with healthful options. Nation’s Restaurant News. 42(31): 16.
Glazer, F. 2008h. NPD: Spike in ’07 coffee, chicken servings spur new products. Nation’s Restaurant News. 42(11): 12.
Hartman. 2007. Pulse Report: Label Reading From a Consumer Perspective. The Hartman Group, Bellevue, Wash. www.hartman-group.com.
Hartman. 2008. Organics 2008 Report. The Hartman Group, Bellevue, Wash. www.hartman-group.com.
IDDBA. 2008. The Health & Wellness Driven Consumer. International Deli, Dairy, Bakery Assn., Madison, Wis. www.iddba.org.
IFIC. 2008. Food & Health Survey. International Food Information Council Foundation, Washington, D.C. www.ific.org.
Nielsen, K., and Strick, L., 2008. The millennial menu: flavors to attract Gen Y. The Center for Culinary Development, San Francisco. Presented at the Flavor Event, San Diego, Calif., Aug. 5.
MenuMine. 2008. FoodService Research Institute, Oak Park, Ill.
Mintel Menu Insights. 2008. Menu Analysis. Mintel Menu Insights, Chicago, Ill. www.mintel.com.
Mintel Menu Insights. 2007. Eat to your health. July Report. Mintel Menu Insights, Chicago, Ill. www.mintel.com.
NPD. 2008a. Consumer scorecard: Total restaurant visits remain flat in ’07-08. Nation’s Restaurant News 42(24): 3.
NPD. 2008b. Consumer scorecard: Older consumers up meal and snack visits. Nation’s Restaurant News 42(26): 3.
NPD. 2008c. Consumer scorecard: Family parties peaked last spring, fell in winter. Nation’s Restaurant News 42(27): 3.
NPD. 2008d. Consumer scorecard: Uptick in on-premise dining yields slight growth edge. Nation’s Restaurant News 42(28): 3.
NPD. 2008e. Consumer scorecard: Top 10 food choices. Nation’s Restaurant News 42(17): 3.
NRA. 2007. What’s Hot, What’s Not Chef Survey. National Restaurant Assn., Washington, D.C. www.restaurant.org.
NRA. 2008. 2008 Forecast. National Restaurant Assn., Washington, D.C. www.restaurant.org.
Sloan, A.E. 2008a. Little bites, big business. Food Technology 62(3): 19.
Sloan, A.E. 2008b. TrendSense™ Model Analysis. Sloan Trends, Inc., Escondido, Calif. www.sloantrend.com.
Sloan, A.E. 2008c. FlavorSense™ Analysis. Sept. 2008. Sloan Trends, Inc., Escondido, Calif. www.sloantrend.com.
Sterling-Rice, 2008. Volume Driver Attitudes, Awareness, and Usage, 2007. Sterling-Rice Group, Boulder, Colo. www.srg.com.
Technomic. 2005. Understanding Freshness in a Foodservice Context Report. April 2005. Technomic, Inc., Chicago, Ill. www.technomic.com.
Technomic. 2006. Starch Substitution Monitor. Am. Ex. Mkt. Brief. Nov. Technomic, Inc., Chicago, Ill. www.technomic.com.
Technomic. 2007a. The soup category report. Technomic, Inc., Chicago, Ill. www.technomic.com.
Technomic. 2007b. Ethnic foods are in fashion. Am. Ex. Mkt. Brief. May. Technomic, Inc., Chicago, Ill. www.technomic.com.
Technomic. 2007c. 2007 Snack Report. Technomic, Inc., Chicago, Ill. www.technomic.com.
Technomic. 2007d. Healthy options wanted beyond the center of the plate. Am. Ex. Mkt. Brief. Feb. Technomic, Inc., Chicago, Ill. www.technomic.com.
Technomic. 2007e. Finding the balance between healthy and indulgent. Am. Ex. Mkt. Brief. March. Technomic, Inc., Chicago, Ill. www.technomic.com.
Technomic. 2008a. The Dinner Occasion Consumer Trend Report. Aug. Technomic Inc., Chicago, Ill. www.technomic.com.
Technomic. 2008b. Tightening wallets have turned pizza into a weekend treat, says Technomic. Press Release: May 7. Technomic, Inc., Chicago, Ill. www.technomic.com.
Technomic. 2008c. Consumers report trading out dining occasions. Am. Ex. Mkt. Brief. March. Technomic, Inc., Chicago, Ill. www.technomic.com.
Technomic. 2008d. FSR takeout trend barometer. Am. Ex. Mkt. Brief. June. Technomic, Inc., Chicago, Ill. www.technomic.com.
Technomic. 2008e. Is sodium the next trans fat? Am. Ex. Mkt. Brief. May. Technomic, Inc., Chicago, Ill. www.technomic.com.
Technomic. 2008f. Locally sourced vs organic. Am. Ex. Mkt. Brief. August. Technomic, Inc., Chicago, Ill. www.technomic.com.
Technomic, 2008g. When you need to raise prices: knowing what the market will bear. Am. Ex. Mkt. Brief. July. Technomic Inc., Chicago, Ill. www.technomic.com.
Technomic, 2008h. Dinner solutions report. Technomic, Inc., Chicago, Ill. www.technomic.com.
Walkup, C., 2008. Technomic: Economic woes likely to carry over to 2009. Nation’s Restaurant News (42): 27: 1, 93.
Yankelovich. 2007. Yankelovich Youth Monitor. Yankelovich, Chapel Hill, N.C. www.Yankelovich.com.