
The New Super Segments
From little foodies to waist-watching adults, five emerging consumer groups represent important market opportunities.
Americans’ food attitudes, lifestyles, and major demographic segments are in transition, demanding dramatic new directions from marketers and potentially creating some of the largest and most lucrative food markets of all time.
 As the nation’s 72 million gourmet food–loving and performance-focused Gen Yers move into parenting age, they’re birthing a new generation of health-conscious little foodies. And with America in the midst of the largest baby boom in its history, the food sector that addresses the needs of children and families will take on a truly new dimension.
At the other end of the age spectrum, 31 million baby boomers will turn 65 in the next 10 years, creating a unique group of wealthy, active 60– and 70-somethings, whose food behaviors and demands are already dramatically different from previous “senior” generations. Moreover, our aging population has also helped to contribute to a virtually untapped group of singles, now 98 million strong (FMI, 2008a).
But it’s not all about demographics; new marketable super segments emerge when changing attitudes permanently affect everyday behavior. And health is no exception. With two-thirds (69%) of Americans describing their lifestyle as “preventative,” eight in 10 (80%) taking some action to control their weight in 2007, and only 29% living a sedentary lifestyle, not surprisingly, waist-watchers and performance enhancers have become major market segments (FMI, 2008a; GfKRoper, 2007).
This article provides a more-detailed look at these five market segments, including the issues, attitudes, and behaviors set to shape these new “super segments.”
Little Foodies
America’s new baby boom is creating unprecedented opportunities for prenatal, baby, toddler, child-oriented, and healthy-family foods, especially for families with kids under age 6 (Sloan, 2007a). Although its sheer size and diverse needs warrant marketers’ attention, understanding the new food attitudes and demands of Gen Y parents will be the key to success.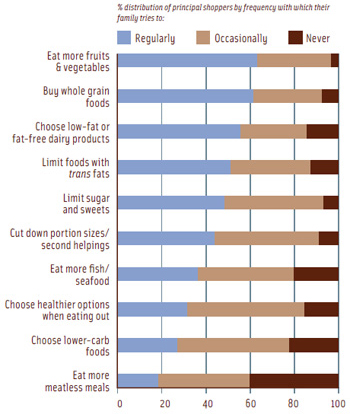
In 2009, 18 million of America’s 70 million children will be under age 5, 19 million age 5–9, 20 million age 10–14, and 13 million age 15–17. By 2015, the number of kids under age 5 is predicted to grow by 7% and the number of those 5–9, by 5%. The number of those 10–14 will remain flat, and the number of teens age 15–17 will fall by 3% (Census, 2005). Retail food sales for children age 3–11 reached $65 billion in 2007 (Packaged Facts, 2008).
Two ongoing family demographic shifts will create new product opportunities at the high and low ends of the market. First, the number of dual-income families—to whom time is more important than money—continues to rise and now accounts for 57% of all family households (USDL, 2005). Premium items such as Homemade Baby’s organic, chef-inspired fresh baby foods will continue to find a welcome market despite the economic climate.
--- PAGE BREAK ---
Secondly, the number of cash–and time-strapped single-parent families is also growing. More than one-quarter (27%) of all children live in single-parent households, and more than one-third (38%) of U.S. households earn less than $35,000; 15% earn $35,000–$50,000 (Census, 2005). With use of private label foods increasing with family size, expect the $80.3 billion private label segment, up 10% for the year ending (YE) 9/6/08, to reap even bigger rewards (Tarnowski, 2008). Safeway’s Eating Right line for kids is enjoying great success.
With 82% of households with kids preparing a home-cooked meal three or more nights per week, the economy causing cutbacks in family restaurant visits/takeout, and two-thirds of moms agreeing that eating at home is healthier, the demand for healthy, family-sized meal solutions is at an all-time high (FMI, 2008a, b).
But with half (50%) of moms citing time as most important when preparing food at home, 26% citing healthfulness, and 12% cost, the current crop of convenience foods will no longer do (FMI, 2008a). Expect kids’ flavor preferences to continue to diversify and increase in sophistication as two-thirds of kids/teens eat at home with their family five or more days per week (Mintel, 2008a). Almost all kids (96%) regularly eat some type of ethnic foods. This includes 76% who regularly eat Mexican, 73% Italian, 65% Asian, 24% Tex Mex, 15% Cajun, 13% Spanish, 12% Japanese, 10% Soul Food, 9% Greek, 6% Indian, and 5% Middle Eastern (MSI, 2007a).
Two-thirds (64%) of American Culinary Federation (ACF) chefs named kid’s haute cuisine and gourmet children’s dishes among their “hot” culinary trends for 2009; 53% cited ethnic-inspired children’s dishes (NRA, 2008a).
Young adults are also experimental diners and have the highest interest in trying new gourmet, specialty, and ethnic foods, and their adventuresome spirit is rubbing off on their kids. Nearly half (45%) of all kids age 6–17 say that their parents always allow them to try new foods (Mintel, 2008a). It’s not surprising that virtually all schools now serve tacos, burritos, and quesadillas, and two-thirds offer stir-fry, sushi, and egg rolls. New ethnic dishes such as spanakopitas, kabobs, hummus dip, calamari, falafel, tabouli, and curry are fast becoming mainstream school menu items (Experian, 2007; NPD, 2007). Now is the time for a convenience food flavor makeover.
Marketers should focus on upgrading the flavor and form of the most frequently eaten dinners in households with kids. Chicken/turkey top the list of dinners eaten in the past survey week, cited by 57%, followed by burgers 48%, pizza 46%, pasta 43%, steak/beef roast 41%, Mexican food/hot dogs/macaroni/casseroles 37%, pork chops/roast 30%, fish 27%, eggs/fried chicken 25%, and sandwiches 24% (MSI, 2007a).
Nearly all families practice a healthy eating strategy at least sometimes; 64% do so regularly (FMI, 2008b). Adding more fruits, vegetables, whole grains, and low-fat dairy products and avoiding trans fats top the list of healthy eating strategies (see Figure 1). Six in 10 households with kids say their diets could be a lot healthier (FMI, 2008a).
Gen Yers are the most interested in natural, organic, and Fair Trade foods. Half of shoppers with kids look to avoid antibiotics/hormones; 38% steer clear of additives/preservatives; and 29% look for all natural claims (IDDBA, 2008). One in 10 moms (13%) prefer to buy organic; 14% of kids age 6–17 try to eat organic foods (FMI, 2008b; Mintel, 2008a). Beech-Nut’s Let’s Grow! line with a “no junk promise” is right on target.
--- PAGE BREAK ---
With the number of Gen Yers extremely concerned about the nutrition content of food climbing 6% last year, expect interest in fortified foods for kids to escalate (FMI, 2008a). Calcium, vitamins C, E, D, and Bs, omega-3s, iron, and folic acid are the nutrients moms most want for their children (MSI, 2007b). One-third (35%) of kids age 6–17 say they try to eat foods rich in vitamins/minerals. Six in 10 parents (62%) are looking for snacks with added nutrients (IRI, 2006b).
Expect today’s young parents to opt for more functional products because Gen Yers are the heaviest users of functional foods and the most likely to say they follow a treatment lifestyle (Mintel, 2008b; GfKRoper, 2007). With the American Academy of Pediatrics recommending that children have a lipid profile after age 2, but no later than age 10, foods that are lower in fat, sodium, sugar, and calories will get the nod (Daniels, 2008). Twenty-six percent of kids age 6–17 say they try to eat foods that are low in fat, 22% seek low-sugar products, and 20% look for low-calorie products (Mintel, 2008a).
The ‘New Middle-Age’
It’s clear that 60– and 70-something consumers are destined to be a formidable food force given that 60% of global consumers cite one’s 60s as the “new middle age,” 39 million Americans already are age 65+, and 31 million older boomers are entering their “senior” years in the next decade (Nielsen, 2007; Census, 2005).
Since 1989, nearly all of the wealth created in the United States has gone to those 55+; 30% of those 65–74 still work (Anonymous, 2007). Only 22% of those 65–74 are in fair/poor health; 88% describe themselves as active and on-the-go (HHS/CDC, 2007).
Those 65+ increased their restaurant visits by seven visits per person in 2007, while visits by those 18–24—the heaviest restaurant users—fell by 15 visits per capita. On a typical day, 31% of those age 65–75 buy at least one restaurant meal (NPD, 2008a). They’re the least likely to limit restaurant visits, downgrade to less expensive venues, or to cut back on appetizers, alcohol, or desserts in order to economize (Mintel, 2007; Sloan, 2007b). Those 65+ are also above-average users of restaurant takeout and supermarket to-go meals (MSI, 207a).
Consumers in their 60s and 70s are the most likely to prepare a home-cooked meal three or more days per week and the most likely to cook from scratch or use frozen or heat-and-serve pre-packaged foods (FMI, 2008a; MSI, 2007a). Half (50%) cite healthfulness, 40% time, and 10% cost as the most important factors when cooking at home (FMI, 2008a).
Balanced nutrition is an important dinner selection criteria for 60% of those age 65+, who were raised on “the basic four.” Seniors are more likely than any other age group to eat a meat/poultry or fish entrée for dinner (72%), a rice, potato, pasta, or stuffing side dish (44%), a green salad (33%), a dessert (26%), and fruit (18%) (MSI, 2007a). This older market segment eats more of a variety of foods for dinner and is not as stuck in a meal routine as some of the younger groups. Asked about what they had for dinner in the past week, answers were as follows: Chicken/turkey/steak/beef roast 48%, burgers 44%, pork chop/roast 36%, pizza 32%, fish/fried chicken 31%, eggs 27%, soup/hot dogs 25%, pasta 23%, macaroni/casserole 22%, seafood/Mexican 19%, sandwiches 17%, and Chinese 15% (MSI, 2007a).
They’re also the No. 1 consumers of seafood, pork, lamb, eggs, fried chicken, chili, meatloaf, and soup for dinner (Sloan, 2007b). They’re above average users of light cream, cottage cheese, milk shakes, buttermilk, ice cream, natural cheeses, and frozen yogurt (NPD, 2007).
Seniors are projected to drive strong demand for wine, spirits, pies/cakes, coffee, margarine/spreads, snack nuts/seeds, breakfast meats, ice cream, and chocolate candy. As boomers turn 65, they’ll increase the demand for dried fruit, English muffins, frozen desserts, jellies/jams/honey, seafood, and sugar substitutes (IRI, 2006a).
--- PAGE BREAK ---
Most important, those 60–and 70-somethings were raised on foods prepared with classic European cooking techniques. As such, they’re the least interested in ethnic/gourmet foods and foods with a lot of spices (Experian, 2007). About 58% of this older group finds Italian cuisine extremely appealing; 51% feel that way about Asian food, 18% Tex-Mex, 11% Cajun/Greek, 8% German/Creole, and 7% Japanese (MSI, 2007a). “Barbecue” and regional American are a good fit with 60-somethings.
Senior shoppers are the most likely to always/usually eat healthy foods (87% vs 75% of total shoppers), select foods for health reasons (79% vs 72%), and to maintain a heart-healthy (69% vs 52%) or low-fat diet (54% vs 37%), according to HealthFocus (2007). They’re the least likely to say that their diet could be healthier (FMI, 2008b).
The healthy actions of 60– and 70-something consumers tend to be based on basic food solutions. For example, they’re trying to eat more oatmeal, fish, and veggies, but are not as interested in things like soy and flax (HealthFocus, 2007).
Ironically, there appears to be a disconnect between consumers in their 60s and 70s and the concept of functional foods. On the one hand, seniors aren’t really functional food believers. They’re not as likely to believe that food contains active components that reduce disease risk, nor are they more interested in seeking out fortified foods than the overall population (HealthFocus, 2007). On the other hand, those age 65–74 are the most frequent dietary supplement users, the most likely to practice preventative medicine, and the most likely to believe that the need for vitamins/minerals increases with age (Experian, 2007). Seniors are twice as likely as any other age groups to take fish oil, vitamin E, and calcium supplements and are heavy users of vitamins C, B-12, and B-complex, as wells as antioxidants and herbals.
With functional food use lowest among those 65+, it’s essential for marketers to build confidence in the effectiveness of functional foods. Enhancing the health properties of foods already thought to have a health benefit may just do the trick. For example, those age 65+ are the No. 1 purchasers of specialty oils, so adding plant sterols to help reduce cholesterol may be a way to bridge the gap (Tanner, 2007).
Older adults also are the most likely to be on a special diet. Of those 65+, 38% are on a low-fat diet, 34% follow a low-salt regimen,28% low-sugar, and 26% a high-fiber diet (IRI, 2006). IRI’s MedProfiler reports that six in 10 adults age 65+ suffer from arthritis, half from high cholesterol, one-third from osteoporosis, and one in five from diabetes (IRI, 2006). One-third (34%) of those 65+ report a lack of energy/tiredness (HealthFocus, 2007).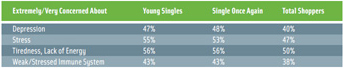
Eye and gastrointestinal (GI) problems posted the largest gains over the past two years among self-reported conditions afflicting those age 50+; heart disease, cancer, arthritis, and eye health topped the list of conditions they were extremely concerned about (HealthFocus, 2007). IRI projects that GI products, vitamins, and denture products are those best poised for growth. Products that address vision problems, periodontal disease, root cavities, loss of mental sharpness, sleeplessness, and decreased metabolism represent other opportunities.
But it’s the true diseases of aging, such as sarcopenia—the age-related loss of muscle mass/strength, which is solvable by dietary means—that may well provide the biggest market opportunity, taking the food industry into the medical foods category. Deficiencies of calcium, vitamin D, and vitamin B-12 are of particular concern.
--- PAGE BREAK ---
The Soloists
In 2009, 98 million Americans age 18 or older are single or unmarried. Singles head half (53 million) of U.S. households; 30 million adults live alone, accounting for more than one-quarter of households (FMI, 2008a). Four in 10 singles are under age 35; 44% of Gen Yers are single, 20% of Gen X, 21% of Boomers, and 11% of those age 62–82 (Packaged Facts, 2007a).
For singles, meals must be simple or social. Among singles who are preparing food, time is most important to 48%, health is most important to 22%, and cost is most important to 12%. However, 72% of singles still prepare a home-cooked meal three or more times a week. Singles cook an average of 4.6 times a week vs 5.0 for married couples; they spend less than 15 minutes cooking (FMI, 2008a).
Singles are among the heaviest users of frozen foods, supermarket takeout, restaurant delivery, restaurant takeout, and convenience-store meals (Packaged Facts, 2007a). However, surprisingly, they like to cook and are just as likely to cook for fun as other groups. They’re also the most likely to attend a cooking class.
With 57% of singles under age 45, where adventuresome dining, watching the Food Channel, and buying specialty foods index the highest—and cooking skills the lowest—marketers must reinvent convenience foods to better target this epicurean group.
Rather than replacing cooking with a complete meal, it’s a good idea for vendors to offer products that make cooking easier and fun. Celebrity chef and gourmet meal kits and frozen dinners will have great appeal. Members of Gen X and Gen Y are among the heavy buyers of gourmet cooking sauces, marinades, rubs/spices, and stir-fry sauces (Tanner, 2007). Mexican and regional Italian foods; uniquely seasoned/marinated meats; Spanish, Japanese, Creole, Greek, Thai, and Indian dishes; and tapas/small plates were the top foods members of Gen X and Gen Y enjoyed in restaurants that they would like to prepare at home (Hartman, 2008). Distinctive flavors, high quality ingredients, minimally processed, and imported/artisanal are other important criteria for today’s convenience foods.
Not surprisingly, singles eat out more frequently than other groups. They’re twice as likely to go to family restaurants with friends, three times more likely to visit fast-food places, and most likely to go to a restaurant to socialize and/or for an intimate dinner (Packaged Facts, 2007a). As a result, appetizers, samplers, and shareable platters get high marks with singles. Mini-burgers, amuse-bouche, edamame, appetizer combos/platters, and appetizer salads top the list of ACF chefs’ hot appetizer picks for 2009. The top trendy desserts also lend themselves to sharing: bite-sized/mini desserts, dessert flights/combos/platters, and gelato/sorbet (NRA, 2008a). Although singles don’t entertain as often as marrieds, they’re heavy users of party platters and catering kits. Pei Wei’s “Party Menu” has portions for five or seven adults.
Singles are twice as likely to go to bars as married folks (Packaged Facts, 2007a). Tempt trendy singles with ACF chefs’ hot alcohol and cocktails for 2009—micro-distilled/artisan liquor; culinary cocktails (savory and customized to specific dishes); organic wine; craft beer/microbrews; specialty beer; or a drinkable alcoholic dessert (NRA, 2008a).
When it comes to healthy behaviors, singles fall into two groups, largely based on age. Young Singles are less in tune with health and nutrition than the total shopper population. They’re less likely to eat healthy foods or to follow any kind of diet regimen. On the other hand, the Single Once Again group behaves more like the average shopper (HealthFocus, 2007).
--- PAGE BREAK ---
Singles tend to exercise more and are more willing to pay for fortified foods, regardless of their income (HealthFocus, 2007). More than half of singles (51%) and 42% of single parents take a vitamin supplement. Single women are more likely than single men to be trying to lose weight (Packaged Facts, 2007a).
Perhaps most notable is the fact that all singles show a much higher degree of stress and depression, as is spelled out in Table 1 (HealthFocus, 2007). They’re also more likely to suffer from insomnia, digestive issues, and stomach ulcers (Packaged Facts, 2007a). Single parents tend to neglect their own health and are more likely to say they suffer from colds and migraines.
Waist Watchers
The battle of the bulge continues, but the weapons and tactics have changed. Dieting is at a 16-year low, down 10 points since 1990 (NPD, 2008b). Moving away from formal diet programs and “rapid weight loss” plans, consumers are now trying to control their weight through healthier eating. When it comes to managing their weight, their new approach includes smaller portions, food restrictions, light/low-fat options and satiating foods.
With 142 million U.S. adults overweight (including 72 million who are obese), the opportunity for companies to help provide a better solution to the nation’s obesity epidemic continues to grow (AHA, 2008; CDC, 2007). Moreover, the prevalence of overweight in children between the ages of 6 and 11 increased from 4% in 1971–74 to 18.8% in 2003–2004; the prevalence of overweight in adolescents age 12–19 increased from 6.1% in the first timeframe to 17.4% in the second (AHA, 2008).
Concern about weight is also at an all-time high. Three quarters of adults are concerned about their weight, up from 66% two years ago (IFIC, 2008). Just over half are very concerned about their weight. Baby boomers, 18–24 year-olds, and women are the groups most likely to be very concerned about themselves or a household member being overweight (IDDBA, 2008).
With two-thirds (67%) of shoppers saying that a weight-related concern affected their food purchases a lot or somewhat in 2007, it’s not surprising that sales of reduced-fat products were up 12% to $45.6 billion and low-calorie/light consumer food sales were up 6% to $17 billion in food, drug, and mass merchandise retailers excluding Wal-Mart (FDMx) for YE 4/19/08 (FMI, 2008b; ACNielsen, 2008). In a recent survey, more than 70% of participants reported consuming reduced-fat foods at least once in the preceding two-week period, and more than half said they chose foods and beverages with reduced calories in that timeframe (NPD, 2008b).
Convenience is essential to dieters when cooking and eating at home. Waist-watcher householders are less likely to prepare meals from scratch (55%) compared with non-dieters (58%) and are more likely to prepare meals at home with pre-packaged foods that require some prep (25% vs 22%). Those trying to manage their weight are also more likely to use takeout from restaurants (6% vs 3.5%, MSI, 2007a). Portion– and calorie-controlled takeout meals and home-delivery are big ideas for the waist-watcher market. After convenience (66%), the most motivating reason for using a home meal delivery service is to maintain or improve health, with 26% citing weight loss, 21% seeking weight maintenance, and 19% attempting to control a medical condition (Technomic, 2007).
Calories from fat are consumers’ new target in the war against weight. Just over one-third of consumers are cutting calories from fat as a weight-loss technique; 33% believe that calories from fat are the most likely to cause weight gain, led by those age 18–24 (IFIC, 2008). Watch for an increasing focus on eliminating “body fat.”
--- PAGE BREAK ---
Calorie concerns in restaurants are also moving into the spotlight. QSR magazine found that 42% of fast-food patrons were watching calories, 34% fat grams, and 30% trans fat (QSR, 2007). In late September, California became the first U.S. state to require fast-food restaurant chains to list calories on their menus. Similar laws went into effect in New York City earlier this year, and several dozen states are likely to follow suit, with national legislation a possibility, as well. Savvy marketers like Au Bon Pain are hopping on the bandwagon with the launch of their new Portions menu, which includes 14 items under 200 calories, including Thai Peanut Chicken, Mango Coconut Mousse, and a range of new bite-sized desserts.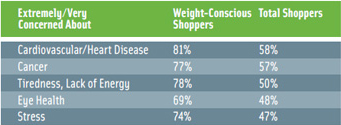
Perhaps the most interesting thing about waist-watcher shoppers is that health issues—particularly heart disease—are of much greater concern than they are for the general population (see Table 2). These consumers also are more interested in learning about the health-promoting benefits of ingredients and foods such as antioxidants, high-energy foods, and omega-3s (HealthFocus, 2007).
Good Sports
Exercise– and sports-minded Americans—regardless of their motivations for participation, end goals, or age—have a unique set of attitudes and behaviors that impact their everyday food and beverage choices. With 61% of those age 18+ regularly (31%) or sometimes (30%) exercising in some form, it might be one of the largest overlooked mass market food opportunities of recent years (CDC, 2007).
On an average day, walking, lifting weights, using cardio equipment, running, playing basketball, and swimming are the most-common activities. Men are slightly more likely than women to participate in sports/exercise; college grads are twice as likely as members of the general population to do so. Most people exercise alone, on average for 30–59 minutes (SGMA, 2007).
HealthFocus (2007) reports that few segments are more passionate about health and nutrition than performance-minded consumers, who frequently take their involvement to an extreme. They understand the link between healthy foods and improved performance—as well as feeling and looking better. Appearance is highly important to these shoppers; 69% of sports performance–minded adults chose foods/beverages to improve their appearance vs 22% of total shoppers.
While they want good taste, they’re more willing to sacrifice it for health. They’re highly knowledgeable about nutrition and functional food benefits, such as antioxidants and cancer prevention and are heavier vitamin and supplement users. They’re also more likely than the general population (64% vs 56%) to pay for food fortification and to always/usually believe foods can replace some of their drugs for health issues. Performance-minded consumers are also more likely than the general population (62% vs 37%) to always/usually choose foods for specific medical purposes such as cranberry juice for urinary tract infections (HealthFocus, 2007).
As the sports nutrition market moves away from pure sports and performance benefits to active lifestyle and health and wellness issues, there are lots of reasons to be optimistic. First, the sports nutrition and weight loss market reached $15.6 billion in 2007, up 7%; sales of serious sports supplements totaled $2.5 billion (Anonymous, 2008).
U.S. energy and sports drinks sales totaled $9.4 billion in 2007, up 13%, although the $2.1 billion energy bar market grew only 2.1%. The demand for energy products is still so strong that energy drinks were the No. 11 hot menu trend for 2009 in the first National Restaurant Assn.’s “What’s Hot?” survey of quickservice restaurant operators; sports drinks ranked 14th (NRA, 2008b). ACF chefs ranked green tea as the No. 3 hot trend in the nonalcoholic beverage category.
--- PAGE BREAK ---
And the future looks better still. Nearly three-quarters (72%) of male teens and 60% of female teens eat food for heightened energy and vitality, while 61% try to eat a balanced diet (Mintel, 2008a). When all children age 6–17 are included, 42% try to eat foods that give them more energy and 35% seek foods that are rich in vitamins, which they believe will give them more energy. Mintel found that kids are aware, not only of what different foods can provide them, i.e. energy, but also what certain other foods can take away, i.e., a trim body and the energy to participate in sports or other activities.
Moreover, foods, beverages, and snacks specially formulated for kids’ needs when they’re actively exercising is virtually an untapped opportunity; 58% of 6–17 year-olds eat at a practice game or after-school activity during the week (Mintel, 2008a).
Vitality products for older consumers will be another big opportunity. Those 50+ are the fastest-growing group of exercisers. While walking and gym workouts are their most popular form of exercise, weight lifting is their fastest-growing sport. Moreover, they are often compromised with various health conditions and are more prone to injury. While older adults index among the lowest for use of sports/activity drinks, liquid nutritional supplements, energy drinks, and energy/diet/snack bars, they’re as likely to select foods for energy as those 18–29 (Packaged Facts, 2007b; HealthFocus, 2007). With 40% of older boomers and 34% of those 65+ reporting a lack of energy/tiredness, vitality products are a very big idea.
Lastly, proven sports nutrition products will also find new mainstream markets as older Americans begin to try to prevent some of the inevitable diseases of aging. The current trend of fortifying sports beverages with amino acids, calcium, and high protein will be right on target.
A. Elizabeth Sloan, a Professional Member of IFT and Contributing Editor of Food Technology, is President, Sloan Trends Inc., 2958 Sunset Hills, Suite 202, Escondido, CA 92025 ([email protected]).
References
ACNielsen. 2008. Nielsen Global Functional & Organic Food Survey. Oct. ACNielsen, Schaumburg, Ill. www.acnielsen.com.
AHA. 2008. Heart Disease and Stroke Statistics—2008 Update. American Heart Assn., Dallas, Texas. www.americanheart.org.
Anonymous. 2007. USA Today Review of Federal Reserve Data. USA Today, May 21.
Anonymous. 2008. SNWL category turns in respectable but not stellar 2007 performance. Nutr. Bus. J. 13(9): 3-9.
CDC. 2007. NCHS Data Brief, No. 1. Nov. Centers for Disease Control and Prevention, Atlanta, Ga. www.cdc.gov.
Census. 2005. Current Population Reports. U.S. Census Bureau, Washington, D.C. www.census.gov.
Daniels, S. R. 2008. Lipid Screening and Cardiovascular Health in Childhood. Pediatrics 122(1): 198-208.
Experian. 2007. Simmons national consumer study. Experian Simmons, New York, N.Y. www.smrb.com.
FMI. 2008a. U.S. Grocery Shopper Trends 2008. Food Marketing Institute, Crystal City, Va. www.fmi.org.
FMI. 2008b. Shopping for Health 2008. Food Marketing Institute.
GfK Roper. 2007. Health and Well-Being, GfK Roper Reports® Monthly Client Teleconference. April 26, 2007. GfK Roper, New York, NY. www.gfkamerica.com.
Hartman. 2008. Reimagining convenience foods. The Hartman Group, Bellevue, Wash. www.hartman-group.com.
HealthFocus. 2007. U.S. 2007 Trend Report. HealthFocus International, St. Petersburg, Fla. www.healthfocus.com.
HHS/CDC. 2007. Health, United States, 2006. CDC National Center for Health Statistics, Atlanta, Ga. www.cdc.gov/nchs/jus06.htm.
IDDBA. 2008. Health and Wellness: The Purpose Driven Consumer. International Deli Dairy Bakery Assn., Madison,Wis. www.iddba.org.
IFIC. 2008. Food & Health Survey. International Food Information Council Foundation, Washington, D.C. www.ific.org.
IRI. 2006a. 55+ Consumers: The New Must Win Market Webinar. Aug. 17. Information Resources Inc., Chicago, Ill. www.infores.com.
IRI. 2006b. Snack Report. Information Resources Inc.
Mintel. 2007. Dining out review: family/midscale and casual. Mintel Intl., Chicago, Ill. www.mintel.com.
Mintel. 2008a. Kids’ and teens’ eating habits—U.S.—Sept. Mintel Intl.
Mintel. 2008b. Functional Foods—U.S.—May. Mintel Intl.
MSI. 2007a. The Gallup Study of Dinner. Multi-Sponsor Surveys, Princeton, N.J. www.multisponsor.com.
MSI. 2007b. Gallup study of nutrent knowledge and consumption.
Nielsen. 2007. Health, Beauty & Personal Grooming: A global Nielsen consumer report. March. The Nielsen Company, New York, NY. www.nielsen.com.
NPD. 2007. National Eating Trends Service and CREST.
NPD Group, Port Washington, NY. www.npd.com.
NPD. 2008a. Consumer scorecard: Older consumers up meal and snack visits. Nation’s Restaurant News. 42(26).
NPD. 2008b. NPD Dieting Monitor. NPD Group.
NRA. 2008a. What’s Hot Chef Survey 2009. National Restaurant Assn., Washington, D.C. www.restaurants.org.
NRA. 2008b. 2008 Quickservice Operator Survey “What’s Hot?” National Restaurant Assn.
Packaged Facts. 2007a. Singles in the U.S. May. Packaged Facts, New York, NY. www.packagedfacts.com.
Packaged Facts. 2007b. Sports nutritional products in the U.S. Aug. Packaged Facts.
Packaged Facts. 2008. The kids and tweens market in the U.S. Aug. Packaged Facts.
QSR. 2007. What consumers say isn’t always what they do. QSR. (June): 60-63.
SGMA. 2007. 2007 Sports & fitness participation report. Sporting Goods Manufacturers Association, Washington, D.C. www.sgma.com.
Sloan, A.E. 2007a. Converting Demographics into Dollars. Food Technology. 61(7): 26-45.
Sloan, A.E. 2007b. Flavor’s Golden Age. Summer 2007. Flavor and The Menu. www.flavor-online.com.
Tanner, R. 2007. Today’s specialty food consumer. Specialty Food Magazine 37(10): 49-64.
Tarnowski, J. 2008. What economic downturn? Progressive Grocer. 87(12): 32, 34.
Technomic. 2007. Lessons Learned from Home Meal Delivery. Sept. American Express Market Brief. Technomic Inc. Chicago, Ill. www.technomic.com.
USDL. 2005. Labor force projection to 2012. Bureau of Labor Statistics Monthly. U.S. Department of Labor, Washington, D.C. www.bls.gov.