
What, When, and Where America Eats
Culinary passions, fewer family meals, and a fast track for flavor are redefining a new era of food.
Dramatic shifts in eating patterns, a desire for more savoring and sophisticated food experiences, and the ever-widening recognition of the role of food in health continue to influence what, when, and where America eats. Despite a need for more affordable dining options, consumers continue their quest for more accessible, entertaining, flavorful, healthier, and cleaner-label food.
The economic uncertainty of the past four years has caused consumers of all ages and incomes to reevaluate, re-prioritize, experiment, and now pursue a new set of food preferences, dining habits, and buying behaviors, creating a series of unprecedented and virtually untapped new opportunities for food and beverage marketers. It is the intent of this article to detail America’s changing eating patterns, preferences, and priorities in these uncertain times.
Signs of the Times
While taste remains the most important driver of food selection for 87% of consumers, it is now closely followed by price for 79%, healthfulness 66%, convenience 58%, and sustainability 52% (IFIC, 2011).
Nearly half (46%) of shoppers believe they are a little or a lot worse off financially than last year; three-quarters expect their personal finances to remain stagnant or deteriorate in 2012, and 23% are having difficulty buying the groceries they need (IRI, 2011a). Conservative consumer buying behaviors have returned to the recessionary practices of two years ago. Six in 10 shoppers have cut back on or eliminated purchases deemed nonessential. American pantries are shrinking, down 5% in stocked SKUs over the past two years, and 40% of shoppers are not trying as many new products (IRI, 2011a).
Private label’s share of dollar sales advanced to a record 19.1% in supermarkets and to 23.5% unit market share; 48% of consumers are buying more private label products (PLMA, 2011). Younger and larger households remain the most likely to buy store brands; commoditized pantry items (e.g., bread, sugar, and pasta) are the best sellers (Mintel, 2011). Private label nuts, natural/imported cheese, canned tomatoes, and bagels are categories with the highest appeal to affluent consumers.
Consumer rituals around food, beverages, beauty, and health continue to center around the home. More than half (56%) of consumers serve more simple and less expensive meals at home, 55% eat out less often, and 42% bring snacks, foods, and/or drinks from home to work or school in order to save money (IRI, 2011a).
Last year’s fastest-growing food products reflect the trend to more at-home and from-home eating. The list of fastest-growing products includes ready-to-drink tea/coffee, sports drinks, energy drinks, snack/granola bars, shelf-stable seafood, dried meat snacks, creams/creamers, frozen seafood, vitamins, and wine (IRI, 2011b).
--- PAGE BREAK ---
Americans’ passion for gourmet foods continues despite tough times, however; 59% of consumers regularly purchase specialty foods, down only 4% from 2010 (Tanner, 2011). Eight in 10 specialty food shoppers (81%) are cooking more at home; two-thirds of consumers buy specialty foods to treat themselves.
Nearly two-thirds of consumers indicate their food tastes and preferences are driven primarily by restaurant experiences (IDDBA, 2011a). As a result, restaurant crossover products (e.g., Panera Bread’s new refrigerated soups and Golden Country Foods’ new IHOP at Home pancake syrups) continue to find a welcome market.
Consumers have once again stepped up home-based entertaining; four in 10 now choose to socialize at home; 33% use gourmet items for at-home get-togethers (IRI, 2011a; Tanner, 2011).
Although restaurants enjoyed a 1% traffic increase in the first two quarters of 2011, visits remained flat for the year overall. Traffic in fast food restaurants—78% of industry visits—was flat at the end of the third quarter of 2011. Mid-scale/family dining fell 4%, casual dining was down by 1%, and fine dining/upscale hotel dining was off by 3% (NPD, 2011a).
Among limited-service restaurants, categories posting above average sales growth included coffee/beverage sales, which were up 7.4%, donuts +5.5%, pizza +4.7%, and Mexican +4.3% (Technomic, 2011a).
More than 11% of all adult eating today includes foods or beverages consumed within one hour of purchase, spurring convenience store and drug store food sales to new heights (Hartman, 2010a; IRI 2011a). Foodservice sales in convenience stores reached $23.8 billion, up 6.1% in 2010. Sales of packaged beverages grew 5.1% to $19.9 billion, while sales of beer/malt beverages dropped by 0.5% to $17.8 billion. Sales of edible grocery products were up 1.1% to $9.4 billion, candy/gum up 3.3% to $5.6 billion, milk up 1.8% to $4.1 billion, salty snacks down 4.8% to $4 billion, ice cream/frozen novelties down 1% to $1.7 billion, alternative snacks up 6.1% to $1.5 billion, and packaged sweet snacks up 0.6% to $491 million. Energy shots were the fastest-growing item in convenience stores in 2010 (Longo, 2011).
And lastly, despite somewhat softer sales in some segments, Americans’ commitment to healthier eating and do-it-yourself self-care continues. Sales of functional food reached $38 billion in 2010, and natural and organic food sales were $39 billion (Anonymous, 2011).
All for One . . .
Dramatic changes have quietly taken place in America’s eating patterns over the past few years. Moreover, an increased understanding of how consumers orient their culinary expectations to foods depending on the type, and motivation for, individual eating occasions is identifying some new and potentially very lucrative product opportunities.
--- PAGE BREAK ---
Eating alone is on the rise. In 2010, 44% of all adult eating occasions were solitary, well in excess of the 26% of adults who live alone (Hartman, 2010a). Most important, in 35% of these “single” eating events, consumers focused on savoring a higher quality, more sophisticated culinary food experience—one defined by freshness, distinctive flavors, foodie narratives, etc. Moreover, Hartman reports that one-third of all adult snacking falls into this new upscale culinary “savoring” category.
When eating dinner alone, today’s single consumers are also more likely to replace frozen meals with fresh, less processed alternatives, Hartman observes. Moreover, these meals are likely to be more indulgent. With two-thirds (64%) of adults who are eating alone doing so at home and only 8% in restaurants, retailers that offer unique fresh meals for one will be rewarded (Hartman, 2010a).
FMI (2011a) reports that 69% of shoppers sometimes/often buy ready-to-eat items in the grocery store, and 45% purchase heat-and-eat products. Packaged Facts (2010a) estimates sales of fresh prepared foods (e.g., prepared meals, salads, sandwiches, pizzas, etc.) at $14 billion.
At the same time, traditional family meals that include children are declining. Three-quarters (72%) of adult family eating occasions involve only adult household members, which is not surprising given that empty nesters are now the No. 1 household unit in the United States (Hartman, 2010a).
Although many consumer packaged goods marketers continue to tout the traditional “family meal solution,” only 28% of family meal occasions involved children in 2010. Moreover, Hartman (2010) reports that more parents are cooking special meals for their child (usually to his or her liking) before moving on to cook yet another meal for themselves, giving higher priority to kid-directed meals.
In addition to healthful meals, American Culinary Federation (ACF) chefs cite smaller versions of adult meals, oven-baked items (e.g., baked chicken fingers, gourmet kids’ cuisine, and ethnic-inspired children’s dishes) among the hot kids’ food trends for 2012 (NRA, 2011). The U.S. kids’ food and beverage market reached $10.4 billion in 2010 and is projected to grow 40% from 2010–2014; the better-for-you kids’ segment totaled $4 billion in 2010 (Packaged Facts, 2011).
With diverse schedules and 76% of adult eating not tied to family occasions, the pantry and kitchen in family households is being transformed to a 24-hour commissary for all to access at will. As a result, rather than shopping for family meals, many moms are simply procuring items to accommodate individual family members’ meal schedules and preferences (Hartman, 2010a).
Hartman (2010) classifies eating occasions according to three categories: instrumental or simply eating to get things done (59% of all eating occasions); savoring as described above (41%); and inspirational, which includes a focus on small craft production, heirloom/heritage ingredients, and a sense of passion for food (< 1%).
--- PAGE BREAK ---
Based on these classifications, the top 10 eating occasions in the U.S. in 2010 include, in descending order: instrumental afternoon snacks, instrumental lunches, savoring dinners, instrumental breakfasts, instrumental dinners, savoring lunches, instrumental morning snacks, savoring breakfasts, instrumental late night meals, and savoring afternoon snacks (Hartman, 2010a).
Meal Plans
More than 70% of meals are eaten in the home (NPD, 2011b). Annual meals prepared and eaten at home per person rose from 817 in 2002 to 877 in 2010; 194 meals per person were eaten at restaurants last year. Of all meals, 72% were sourced from home, 18% from foodservice, and 8% were skipped (2% of occasions are unknown) (NPD, 2011b).
On average, shoppers prepare five home-cooked meals per week, eat out one night, and use take-out/delivery one evening; singles and empty nesters are more likely to eat out (FMI, 2011a). One-third (33%) of shoppers overall are preparing more home-cooked meals than last year; that is true for 55% of Gen Y consumers and 37% of Gen X (FMI, 2011a).
When it comes to cooking, young adults are catching on. Six in 10 meal preparers ages 25–34 (60%) and 57% of those 35–44 now rate their cooking skills as very good vs 50% of those 45 and older who characterize themselves in that way (NPD, 2011c). Those ages 25–34 are most likely to be foodie cooks, followed by those 35–42 (Packaged Facts, 2009).
Half (48%) of shoppers are cooking from scratch or with fewer convenience foods in order to save money (IRI, 2011b). But home cooks could still use some guidance. More than one-quarter say they want help with pairing food with wine, preparing fresh seafood, and making marinades, sauces, and gravies (FMI, 2011a).
Shoppers are planning meals further out; only 10% don’t know at 4 p.m. what they’ll serve for dinner (FMI, 2011a). Just 40% of meal planners use a recipe once a week or more, and less than 1% reported using a recipe app within a given six-week period. Pressure cookers are the new hot kitchen appliance; they are now in 20% of households (NPD, 2011c).
On a typical week night, 57% of meal preparers serve a meat/poultry or seafood entrée; 43% a rice, potato, stuffing, or pasta side dish; 42% serve a vegetable side dish; 24% bread, biscuits or rolls; 20% a green salad; 5% dessert; and 3% an appetizer (MSI, 2009). Three-quarters of meal preparers reported serving meat in a given week. Hamburgers, steak/beef roast, pork chops/roast, hot dogs, meat loaf, and ham topped the list; 51% served chicken or turkey and 33% fish/seafood (MSI, 2009).
Just over half (54%) of the population serves a main dish pasta for dinner during the week; for weekday dinners, 40% serve pizza, 35% soup, 27% Mexican food, 25% eggs, and 12% a Chinese main dish (MSI, 2009).
--- PAGE BREAK ---
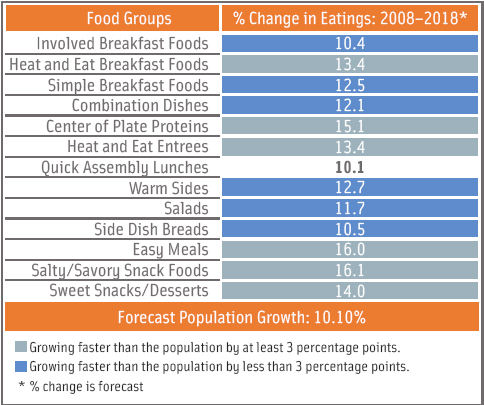 Easy meals, center-of-the-plate proteins, and heat-and-eat entrees are projected to be among the fastest-growing food categories from 2008 to 2018 (Figure 1, NPD, 2011d). One-third (36%) of shoppers use heat-and-eat products, up 7% from 2010, and 36% use ready-to-eat meat/poultry for dinner at least once a week, up 3%. Eight in 10 (81%) buy prepared/marinated meat/poultry, up 6% vs 2010; 61% also frequently marinate their own meat with a store-bought marinade, up 8% (FMI, 2011b).
Onion, garlic, teriyaki, Hawaiian, Asian, and ginger are among the top beef flavor descriptors in limited-service restaurants; onion, garlic, tomato, Asian, sweet, and bacon lead the list in trendy full-service eateries. Barbecue, grilled, seasoned, smoked, and basted are the top preparations for pork (Technomic, 2011b).
One in three consumers (32%) are very interested in purchasing free-range chicken/turkey; 30% country ham/ bacon or grass-fed beef; 22% wild game (e.g., bison, venison); 20% skirt steak; 19% ethnic meats (e.g., carne asada or chorizo); 18% Kobe/wagyu beef; 7% Italian salumi; 13% hanger steak; and 10% French charcuterie (IDDBA, 2011a). Rib-eye fillet and petite are new, highly appealing beef cuts.
Locally sourced meats/seafood top the list of main dishes that will be trendy for 2012, followed by sustainable seafood; new fabricated cuts of meat (e.g., petite tender, Denver steak); nontraditional fish (e.g., branzino, arctic char); half-portions/smaller portions; street food-inspired main courses (e.g., satay, grass-fed beef); lower-sodium entrees; and gourmet sandwiches (NRA, 2011). Restaurants are name dropping high-end meat brands (e.g., Chipotle Mexican Grill’s mention of Niman Ranch pork on the menu).
Eight in 10 meal preparers (79%) served side potatoes (mashed, baked, or fries) for dinner in a recent week; 40% served rice; 37% a pasta/macaroni side; 30% baked beans; 10% stuffing; and 3% couscous/quinoa (MSI, 2009). Four in 10 have heard of or tried couscous, 32% polenta, and 24% quinoa (IDDBA, 2011a).
Non-wheat noodles (e.g., rice, buckwheat); black/forbidden rice; quinoa; red rice; vegetable pickles; Asian noodles (e.g., soba, udon); braised vegetables; sweet potato fries; steamed/roasted vegetables; and brown/wild rice top the list of trendy sides for 2012 (NRA, 2011).
Heirloom apples, beans, and tomatoes join locally grown and organic produce, super and exotic fruits, specialty potatoes, and micro greens as hot produce items for 2012 (NRA, 2011). Nearly three in 10 ACF chefs (28%) have a traditional garden at their restaurant; 3% have a rooftop garden (NRA, 2011).
Frozen prepared vegetables continue to be one of the best sellers in the frozen case along with handheld breakfast items and frozen pies, up 8.8%, 6.2%, and 9.0%, respectively, in unit sales for the year ended (Y/E) 9/4/11 (Mitchell, 2011). Sales of frozen dinners/entrees are still struggling.
--- PAGE BREAK ---
Decorated cakes, cupcakes, individual-sized treats, cookies, and brownies are among the top sellers in in-store bakeries (IDDBA, 2011b). Look for more ethnic cookies (e.g., Mexican Polvorones and Asian tea cookies) and more classic European desserts (e.g., éclairs, mousse, canoli, and strudel), which have high appeal to older consumers.
One-third (31%) of consumers are very interested in buying gourmet donuts in the in-store bakery, 29% cream puffs, 28% sweet crepes, 26% parfaits, 25% tarts, 21% French macaroons, 20% Pennsylvania Dutch desserts (e.g., whoopie pie), and 20% beignets (IDDBA, 2011a).
Artisan/house-made ice cream, bite-size mini-desserts, savory desserts, deconstructed classic desserts, dessert flights/combos, gelato/sorbet, and fruit desserts (e.g., cobblers), lollipops, and granite are among the trendy desserts for 2012 (NRA, 2011).
Sweet, hot, smoky, spicy, and fruity flavor profiles and breakfast pizzas are among the next innovations for pizza. While Cajun flavors are currently trendy for pasta entrees in restaurants, look for retro pasta flavors to come on strong (Technomic, 2011c).
Dissecting Consumption by Daypart
In 2010, consumers ate breakfast 5.3 days per week; 52% never skipped breakfast (FMI, 2011a). Breakfast was typically eaten at home on weekends (85%) and on weekdays (74%), up 8% over the past two years (MSI, 2010a). One in five (20%) packed breakfast foods from home for work; 20% brought coffee or other early morning beverages.
Breakfast is a multi-meal, multilocation occasion for 27% of adults; they may nibble at home, stop at a drive-through/coffeehouse, and then take a mid-morning break at work (FMI, 2010).
Breakfast restaurant traffic remained flat through June 2011 (NPD, 2011e). Ethnic-inspired breakfast items, French toast, waffles, and chicken/seafood as sides are trendy breakfast items for 2012 (NRA, 2011). On the home front, breakfast foods of all kinds are projected to be among the fastest-growing categories through 2018 (Figure 1, NPD, 2011d).
One-third of adults brown bag their lunch; 65% of those with household incomes >$125,000 do so, suggesting a need for more upscale deli items. Brought-from-home lunches are now the most common source of away-from-home lunches, followed by fast food (FMI, 2011a).
Healthy items are important in the away-from-home lunch decision for 50%; made-to-order sandwiches are important for 46%, microwavable products that are easy to heat and eat are important for 39%, and a hot food buffet/bar are important for 33% (FMI, 2011a). Shoppers average 5.6 lunches away from home each week.
--- PAGE BREAK ---
Burgers remain America’s favorite sandwich, ordered by 77% of adults in 2010, followed by deli sandwich 57%, taco/burrito 52%, sub/hoagie 47%, breakfast sandwich 41%, chicken 41%, hot dog 39%, salad sandwich 27%, wrap 24%, mini sandwich 21%, Panini 17%, and flatbread 10% (Technomic 2010a).
Four in 10 adults (44%) are very interested in purchasing multi-grain bread for deli sandwiches, 38% cheese bread (e.g., Asiago); 36% croissants; 33% sourdough; 32% wraps; 32% specific wheat breads (e.g., semolina); 30% flatbread and ethnic breads (e.g., naan, pita, etc.); 29% Panini; 28% artisan; and 25% seeded bread (IDDBA, 2011a).
Almost six in 10 Americans (58%) have eaten food from a food truck; 61% of ACF chefs would consider launching a food truck as an entrepreneurial business venture (NRA, 2011).
Although lunch traffic at restaurants fell 1%, afternoon snack traffic was stable for the first half of 2011. Savory/salty and sweet/dessert snack foods are projected to be one of the fastest-growing consumer packaged goods food categories through 2018 (NPD, 2011d).
In 2010, dollar sales growth for healthy snacks was fueled by protein (+7.6%); low-sodium (+6.2%); and low-fat (+1.9%) (Watt, 2011). Moreover, there is strong growth outside of sweet (+0.3%) and savory (+0.7%) snacks. In 2010, refrigerated appetizer/snack rolls grew 8%, snack/granola brands 7%, yogurt 6%, dry fruit snacks 5%, and string cheese 3% (Watt, 2011).
In restaurants, egg rolls—ordered sometimes or every time/most times by 80% of diners—are the most ordered appetizer, followed by quesadillas (72%), spring rolls (64%), bruschetta (41%), lettuce wraps (36%), and hummus (27%) (Technomic, 2010b).
Vegetable/vegetarian appetizers, appetizers inspired by ethnic street food (e.g., tempura, kabobs), charcuterie plates/samplers, amuse-bouché/bite-sized hors d’oeuvres, warm appetizer salads, ceviche/seviche, sliders, and oysters top the list of trendy appetizers for 2012 (NRA, 2011).
House-made soft drinks, specialty iced teas, gourmet/house-made lemonade, organic coffee, dairy-free milk, and aqua fresca are among the new hot beverages for 2012; many of them will be consumed as snacks (NRA, 2011).
--- PAGE BREAK ---
Flavors and Foodies
Americans’ ever-accelerating passion for food has put the demand for more sophisticated and uniquely flavored foods on the front burner. Seven in 10 consumers (69%) like to try new flavors, up 5% over the past two years (Technomic, 2011c).
Just over half (53%) of adults are more likely to visit a restaurant that offers new or innovative flavors, up 11% vs 2009. Younger adults, including 52% of those ages 25–34 and 47% of those ages 18–24, remain most interested in trying new flavors; the figures are 43% and 44%, respectively, for ethnic flavors/cuisines (Technomic, 2011c).
Flavor continues to drive the consumer packaged goods food industry, with 73% of the best-selling new food and beverage products introduced in 2010–11 touting a new/unique recipe, 39% a distinctive new flavor or ingredient variety (e.g., spelt flour), and 17% a different texture (IRI, 2011c).
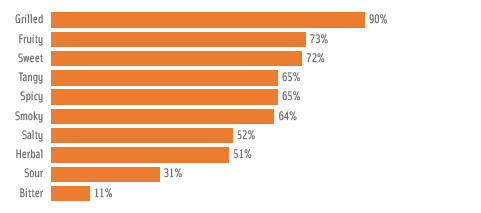 Americans’ flavor preferences continue to evolve. See Figure 2, for a look at 2011’s favorites. Notably, Technomic data shows that preference for spicy foods grew a substantial 9% among those ages 25–34 and 13% among ages 35–44 over the past two years (Technomic, 2011c).
Preparation style remains the most appealing way to add flavor to food for 81% of consumers, up from 70% in 2009 (Technomic, 2011c). Sauces hold high appeal for 64% of adults, marinades appeal to 61%, and glazes 55%. Interest in spreads/condiments that come with the order/product is also high, with 61% of consumers interested, up 8% since 2009.
Pickling, fermenting, sous vide, liquid nitrogen chilling/freezing, oil poaching, smoking, braising, grilling, roasting, and foam/froth/air round out the top 10 hot food preparation techniques for 2012 (NRA, 2011).
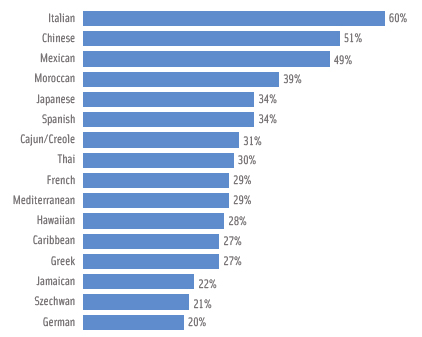
Although Italian, Chinese, and Mexican still top the list of ethnic fare consumers would opt for at restaurants, Moroccan, Japanese, and Spanish are coming on strong (Figure 3, Technomic, 2011c). Italian leads the list of ethnic cuisines Millennials (Generation Y) are most likely to order, followed by Spanish, Thai, French, Greek, and Mediterranean.
--- PAGE BREAK ---
Ethnic fusion, Peruvian, regional ethnic, Cuban, Southeast Asian (e.g., Thai, Vietnamese), Malaysian, North African/Maghreb, Korean, Latin American/Nuevo Latino, Mediterranean, and Nordic/Scandinavian round out the top 10 rankings of trendy cuisines for 2012 (NRA, 2011). Four in 10 consumers ages 25–34 (44%) are interested in foods that mix globally inspired flavors from more than one type of cuisine (e.g., French-Vietnamese).
At the same time, the American culinary movement is beginning to build momentum. About one-quarter of consumers are ordering more traditional, familiar flavors than they were ordering a year ago; one-third of those ages 18–24 are increasingly ordering foods with classic flavor profiles vs onequarter of the population overall (Technomic, 2011c).
 In the home, garlic, cinnamon, basil, oregano, parsley, vanilla extract, and black peppercorn were along the spices used more frequently over the past few years; garlic powder, cinnamon, seasoning blends, chili, onion powder, nutmeg, cloves, cumin, and ginger were the top 10 dry seasonings purchased (Nielsen, 2011a).
The U.S. pantry for spices has grown from fewer than 10 per household to more than 40 spices over the past 10 years (Mintel, 2008). Pickling spices and rice vinegar and mustard seed and vermouth are among the hot 2011 flavor pairings identified by McCormick Spice.
For more than half of adults (54%), a unique sauce can pique their purchase interest, up 11% over two years ago. Yogurt sauces to replace butter/cream sauces are of high interest to older adults. Among hot sauces, jalapeno, chili pepper, red pepper, chipotle, and cayenne are top priority (Technomic, 2011c).
Ethnic cuisine cheeses (e.g., queso fresco, paneer, labneh, halloumi); specialty salt (e.g., flavored, smoked, regional); black garlic; ethnic condiments (e.g., raita, chimichurri, sriracha, chutney); red vinegar/house-made vinegars; agave; flower syrup/essence; matcha/green tea powder; and specialty oils are among the flavoring ingredients on the ACF chefs’ list of hot ingredients for 2012 (NRA, 2011). So it appears that today’s consumers will continue to enjoy adding a touch of the exotic and ethnic to their menus.
Pure and Healthy
There is some evidence that the economy is causing a decline in healthy eating. The proportion of shoppers very concerned about nutrition fell to 39% in 2011, down 6% from 2010. More shoppers admit their diet has room for improvement, and fewer shoppers started a weight control program in 2010, down 7% from 2009 (FMI, 2011a).
--- PAGE BREAK ---
Whole grains and low sodium top the list of “front of pack” health claims shoppers seek out when purchasing foods, followed by high fiber, no trans fats, low sugar, no/low fat, no preservatives, antioxidants/superfoods, low calorie, and no chemical additives (FMI, 2011a). Interest in positive nutrition is accelerating. Nearly two-thirds (63%) of adults are interested in learning what to eat, instead of what not to eat, up 7% over the past two years (IFIC, 2011).
Getting nutrients naturally by eating foods that are naturally high in specific nutrients is increasingly becoming the desired way for consumers to get their nutrition (Sloan, 2011). In 2010, one-third (32%) of consumers made a strong effort to eat foods/drinks naturally rich in nutrients (MSI, 2010b). And while 65% of adults are still making a strong/some effort to eat more fortified foods, the number has fallen for the first time in history. Those making no effort rose 7% to 35% from 2009 to 2010 (MSI, 2010b).
Three-quarters (74%) of shoppers look for the descriptor “100% whole wheat” when shopping, 59% look for “a full serving of vegetables,” and 22% seek gluten-free products (Technomic, 2010c). About half of all shoppers have bought cranberry juice, dark chocolate, or almonds in the past year for their superfood benefits (FMI, 2011c).
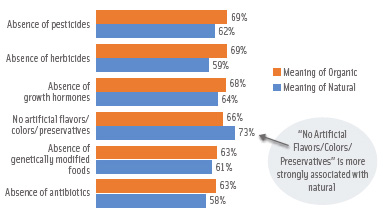
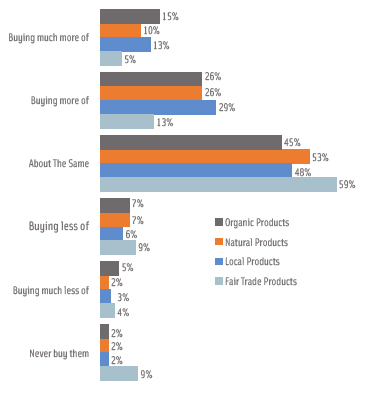 Products that made an all natural claim took the highest share (12%) of all consumer packaged goods product sales with wellness claims in 2010, according to IRI (IRI, 2011b). Sales of foods/beverages carrying a natural claim in supermarkets reached $22.6 billion for the year ended 4/16/2011 (Nielsen, 2011b). The tight economy appears not to have slowed interest in organic foods (Figure 4, Hartman, 2010b). Generally, consumers associate similar product attributes with both natural and organic products (Figure 5, 2010b).
 HealthFocus reports that 65% of consumers are extremely/very interested in foods that boost the immune system, 62% are interested in fiber and satiety, 61% express high interest in active cultures in yogurt for digestive health, 58% are interested in dairy and weight management, and 58% nutrition for healthy skin (HealthFocus, 2010).
--- PAGE BREAK ---
And there’s clearly room And there’s clearly room for growth. According to the NPD Group, in a given week, only 2% of consumers achieved at least 70% of the daily recommended intake for dairy, fruit, grains, protein, and vegetables as specified in the U.S. Dept. of Agriculture’s My Plate guidelines (NPD, 2011f).
A. Elizabeth Sloan, a Professional Member of IFT and Contributing Editor of Food Technology, is President, Sloan Trends Inc., 2958 Sunset Hills, Suite 202, Escondido, CA 92025 ([email protected]).
References
Anonymous. 2011. Organic wins big in 2010. Nutr. Bus. J., June/July: 1, 3-5.
FMI. 2010. U.S. grocery shopper trends. Food Marketing Institute, Washington, D.C. www.fmi.org.
FMI. 2011a. U.S. grocery shopper trends.
FMI. 2011b. The power of meat.
FMI. 2011c. Shopping for health.
Hartman. 2010a. The Hartman Group eating occasions compass. The Hartman Group, Bellevue, Wash. www.hartman-group.com.
Hartman. 2010b. Beyond organic & natural 2010: Resolving confusion in marketing foods and beverages.
HealthFocus. 2010. U.S. trend study. HealthFocus Intl., St. Petersburg, Fla. www.healthfocus.com.
IDDBA. 2011a. Innovation, trends, attitudes and opportunities. International Dairy, Deli, Bakery Assn, Madison, Wis. www.iddba.org.
IDDBA. 2011b. What’s in store?
IFIC. 2011. 2011 Food & Health Survey. International Food Information Council Foundation, Washington, D.C. www.foodinsight.org.
IRI. 2011a. The downturn shopper. Times & Trends, Oct./Nov. SymphonyIRI Group, Chicago, Ill. www.infores.com.
IRI. 2011b. CPG 2010 year in review. Times & Trends, Feb.
IRI. 2011c. New product pacesetters. Times & Trends, March.
Longo, D. 2011. Convenience store news industry report ’11. Convenience Store News 47(8): 36-97.
McCormick. 2011. McCormick flavor forecast 2011. McCormick Spice Co., Hunt Valley, Md. www.mccormick.com
Mintel. 2008. Seasonings—U.S. Oct. Mintel International, Chicago, Ill.www.mintel.com.
Mintel. 2011. Private label food—U.S. Nov.
Mitchell, R. 2011. Thawing out. Perishables Buyer Oct.: 28, 30.
MSI. 2009. The 2009 Gallup study of dinner. Multi-Sponsor Surveys, Princeton, N.J. www.multisponsorsurveys.com.
MSI. 2010. The Gallup study of breakfast.
MSI. 2010b. The 2010 Gallup study of nutrient knowledge and consumption.
Nielsen. 2011a. Food, drug, mass merchandisers excluding Wal-Mart, year ended 5/15/11. The
Nielsen Co., New York, N.Y. www.nielsen.com.
Nielsen. 2011b. Health and wellness sales: U.S. supermarkets, year ended 4/16/11.
NPD. 2011a. NPD forecasts 2012 begins with industry traffic flat, but ends with visits up by one percent. Press release, Dec. 6. The NPD Group, Port Washington, N.Y. www.npd.com.
NPD. 2011b. National eating trends survey.
NPD. 2011c. Kitchen audit.
NPD. 2011d. A look into the future of eating.
NPD. 2011e. Restaurant supper traffic improves after several years of decline. Press release, June 27.
NPD. 2011f. New federal dietary guidelines and MyPlate icon are a sharp contrast to what’s on America’s plates. Press release, Dec. 13.
NRA. 2011. What’s hot? survey: American Culinary Federation Chefs. National Restaurant Assn. Washington, D.C. www.restaurant.org.
Packaged Facts. 2009. Foodies in the U.S. Packaged Facts, New York, N.Y. www.packagedfacts.com.
Packaged Facts. 2010. Fresh convenience foods in the U.S.
Packaged Facts. 2011. Kids food & beverage market in the U.S.
PLMA. 2011. 2011 private label yearbook. Private Label Manufacturers Assn., New York, N.Y. www.plma.org.
Sloan, A.E. Navigating the natural marketplace. Food Technology 65(7): 24-33.
Tanner, R. 2011. Today’s specialty food consumers 2011. Specialty Food 41(8): C1-16.
Technomic. 2010a. The sandwich consumer trend report. Technomic Inc. Chicago, Ill. www.technomic.com.
Technomic. 2010b. Left side of the menu: consumer appetizer trend report.
Technomic. 2010c. The healthy eating consumer trend report.
Technomic. 2011a. The top 500 report.
Technomic. 2011b. Center of the plate: beef & pork consumer trend report.
Technomic. 2011c. The flavor consumer trend report.
Watt, Sally Lyons. 2011. The state of the snack industry. Presented at SnaxPo, Snack Food Assn. Annual Meeting, Orlando, Fla., March 20-23.