

What, When, and Where America Eats
U.S. consumers’ palates and plates are changing thanks to a renewed focus on home, outsourcing food preparation, and the influence of kids/teens.
Article Content
With more than one-third of the U.S. population over age 50 and maturing Millennials starting families or moving out on their own, it’s not surprising that activities, including eating, are recentering around the home. So what’s the new normal? Just over eight in 10 consumers prepare and eat their evening meal at home four or more nights per week (FMI 2017a). And 42% of shoppers say they do so more often than in 2016 (Packer 2017).
But despite an increased passion for cooking, especially among Millennials, time pressures and a desire for more sophisticated fare are forcing Americans to further outsource their meals. Nearly one-third (30%) of evening meals are now completely prepared outside of the home; 34% are made from a mix of prepared/partially prepared and some scratch items; and 35% are made from scratch (Hartman 2017). One in five food shoppers looks for meals that require little or no preparation (FMI 2017a).
Supermarket foodservice is now the fastest-growing foodservice category, up 8.6% in 2016 and projected by Technomic to reach sales of $51 billion by 2025 (Hanson 2017, Technomic 2015, Figure 1).

Figure 1. 2016 Foodservice Segment Performance. (% Growth in 2016) From Technomic 2017
Figure 1. 2016 Foodservice Segment Performance. (% Growth in 2016) From Technomic 2017
Six in 10 retailers are devoting more space to prepared foods. Two-thirds believe that convenient, on-the-go snacks offer the best competitive advantage (Gallagher 2017).
Retailers report that deli/grocerant/prepared sections are second only to the meat department in generating store traffic and sales (Dudlicek 2017a). Sixty-two percent of supermarkets offer self-service food bars; 44%, fast-casual food stations; and 13%, a full-service restaurant (Gallagher 2017).
In 2016, 64% of all restaurant food was eaten off premise (NPD 2017). Nearly two-thirds (63%) of consumers ordered carryout food from a restaurant, 63% from a drive-through, 42% for delivery, and 16% from a food truck (Acosta 2016). Jack-in-the-Box, Panera Bread, Burger King, and Taco Bell now offer delivery service.
Per capita restaurant dinner visits dropped from 62 in 2013 to 57 for the year ended (Y/E) June 2017; those aged 35–54 were mostly responsible for the decline (Glazer 2017).
Two-thirds of convenience store shoppers buy prepared foods. Hot dogs, deli sandwiches, pizza, breakfast sandwiches, and freshly baked goods are the most purchased items (CSN 2017).
Unit sales of handheld breakfast sandwiches jumped 13% in convenience stores in 2016; nonbreakfast entrées were up 11.9%; sushi, egg rolls, and empanadas were the fastest-growing menu items, per Datassential (Datassential 2016a, CSP 2017).
Meal Patterns
The demise of the family meal continues. In households with kids, only 7.4 meals are eaten together at home each week—3.5 dinners, 1.6 lunches, and 2.3 breakfasts (FMI 2017a). Because different schedules are the primary obstacle, dinners that are ready to eat at any time (e.g., slow cooker and frozen meals) are getting the nod.
Increasingly, food purchase decisions are being influenced by the presence of kids/teens. Nine in 10 Millennial parents order food from a restaurant at least once per week versus 73% of the population overall (Technomic 2017a).
Nearly three-quarters (73%) of households with kids buy ready-to-eat prepared foods versus 48% of households without kids, and they are twice as likely to use frozen meals/entrées (FMI 2017a, Packaged Facts 2017a).
Households with kids accounted for 40% of snack sales in 2016, driving sales up 13% (Wyatt 2017). One-third of households with kids carry food to work/school. One in five parents wants more kid-specific meals (Packaged Facts 2016a).
Prepared lunch kits top the list of foods that households with kids/teens are much more likely to use, followed by fruit snacks, toaster pastries, nutrition bars, breakfast pastries, snack cakes, and frozen pizza (Packaged Facts 2016a).
Forty-six percent of eating occasions are alone—53% of breakfasts, 45% of lunches, and 24% of dinners (Hartman 2017). Just over one-quarter of U.S. households are composed of a person living alone (U.S. Census 2017).
Forty-nine percent of eating occasions involve snacks; 8% of consumers forego meals altogether in favor of all-day snacking. On 18% of snacking occasions, snacks are consumed within one hour of purchase (Hartman 2016).
Snacking tends to increase as the day progresses; there is greater desire to indulge rather than exercise restraint later in the day (Hartman 2016, Figure 2).

Figure 2. Snacking Occasions by Daypart. (Percentage of Total Population Participating in Eating Occasions in a 24-hour Period) From Hartman 2016
Figure 2. Snacking Occasions by Daypart. (Percentage of Total Population Participating in Eating Occasions in a 24-hour Period) From Hartman 2016
Nearly two-thirds (63%) of early morning snacks are eaten alone; 59% of midmorning snacks are consumed alone; 56% of afternoon snacks; 54% of after-dinner snacks; and 56% of late-night snacks (Hartman 2017).
Lunch combination kits (e.g., Lunchables and/or fresh on-the-go snack packs) were the fourth best-selling food/beverage category in 2016, +14.4% in sales (Nielsen 2016). Two-thirds of consumers are interested in meal kits for entertaining, game days, and secondary holidays (e.g., St. Patrick’s Day) (FMI 2017b). Sales of gourmet frozen appetizers jumped 14% between 2014 and 2016 (SFA 2017).
The number of meals eaten at another person’s house jumped 19% in 2016 from 32 meals per person in 2015 to 38 in 2016 (NPD 2017).
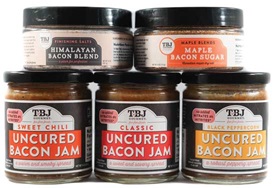
Gourmet/specialty foods continue to outpace their traditional counterparts in nearly every food category, reaching sales of $127 billion in 2016, up 15% from 2014. Six in 10 consumers are regular specialty food buyers; 36% buy gourmet snacks for everyday use (SFA 2017).
Cheese is the largest specialty food category, with sales of $4.4 billion in 2016, followed by meat/poultry/seafood, $3.7 billion; chips/pretzels/snacks, $3.6 billion; coffee/cocoa (not ready to drink), $3.2 billion; bread/baked goods, $2.8 billion; chocolate/confectionery, $2.2 billion; yogurt/kefir, $2.0 billion; frozen lunch/dinner entrées, $2.0 billion; refrigerated lunch/dinner entrées, $1.9 billion; and gourmet condiments/dressings/marinades, $1.9 billion (SFA 2017).
Eggs, ready-to-drink coffee/tea, jerky/meat snacks, and water posted the highest dollar sales growth among specialty foods. Jerky/meat snacks grew 85% in unit sales; refrigerated juices and functional beverages were each up 35% (SFA 2017). New cuts of meat, house-made condiments, street food–inspired dishes, ethnic breakfasts, and healthful kids’ meals are among the overall top 20 culinary trends for 2018 identified by a National Restaurant Assoc. survey of American Culinary Federation members (NRA 2017).
Daypart Dining
In a typical week in 2016, roughly 4.5 dinners required some level of food preparation (FMI 2016a). Fifty-seven percent of adults bought ready-to-eat prepared foods (e.g., rotisserie chicken, sandwiches, or sushi); 53% purchased heat-and-eat items (e.g., fresh pizza, casseroles, or soups) (FMI 2017a). Half (53%) are buying more prepared items than one year ago (Datassential 2016a).
For the year ended July 1, 2017, sushi posted the largest dollar share gains in the deli prepared food section, +19.5%, followed by deli breakfast foods, +13.1%; deli beverages and tea, +7.8%; soups, +6.3%; coffee, +5.4%; sandwiches, +4.5%; appetizers, +4.2%; deli sides, +3.5%; salads, +3.2%; and deli entrées, +3.0% (IDDBA 2018).
More than four in 10 deli operators are putting more emphasis on rotisserie programs, sandwiches, hot/cold bars, and daily specials (Dudlicek 2017b). Mexican foods, Asian dishes, and pasta top the list of foods that supermarket prepared food shoppers would like to see more of (Hanson 2017).
When it comes to prepared foods, food kits are second only to freshly cooked heat-and-eat foods in terms of consumer interest. One-quarter of adults bought a meal kit in 2016 (Nielsen 2017). Thirty-six percent would buy food kits if they were available in their local store. Those aged 25–44, households with kids, and urban adults are most likely to do so (Nielsen 2017).
U.S. meal kit sales reached $2.2 billion in June 2017 and are projected to grow 25%–30% annually over the next five years (Pentallect 2017). Nearly four in 10 consumers (39%) bought more frozen main courses/entrées in 2016 versus 2015. Nearly half (46%) of U.S. households buy frozen dinners; 41% buy frozen entrées/main dishes (Packaged Facts 2017a).
Sales of multiserve frozen dinners/entrées jumped 4.9% for the 12 weeks ended Aug. 13, 2017, versus only 0.3% for single-serve frozen meals, per IRI. Sales of frozen pizza were up 6.8%, and frozen pot pie sales climbed by 7.2% (Penguin 2017). Three-quarters of U.S. households use frozen vegetables (Packaged Facts 2017a).
The stove top—used to prepare 35% of main meals in 2016—is the most used cooking device; it is followed by the microwave, used for 28.5% of main meals; the oven, 18.5%; and the outdoor grill, 4.7% (NPD 2017). Two-thirds of households own and use a slow cooker (Mintel 2016a).
Households with kids are four time more likely to use a food processer/blender, three times more likely to cook on the grill or use a slow cooker, and twice as likely to use preprepared side dishes (Harris Poll 2016). Over the past five years, use of one-pot meals jumped by 29% (FMI 2016b).
Sales of spices rose 6.3% for Y/E Oct. 30, 2016; sales of natural and organic spices were up by 26% (Best 2017).
 Savory leads the list of flavors that are appealing and extremely appealing, followed by sweet, smoky, spicy, ethnic, bold, tangy, and fruity—the latter down in terms of appeal from 59% in 2015 to 40% in 2017 (Technomic 2017b).
Ketchup remains America’s favorite condiment, used by 93% of consumers, followed by peanut butter/nut butters/chocolate spreads, mustard, mayonnaise, barbecue sauce, and salsa (Packaged Facts 2017b).
After Italian, Mexican, and Chinese, U.S. regional and Thai are the ethnic cuisines most consumed by food shoppers. More than one-third of adults eat barbecue during an average week (FMI 2016c, Wyatt 2017). Middle Eastern, African, and Peruvian are the trendy cuisines for 2018; ethnic meals for kids are trending as well (NRA 2017).
Egg rolls remain America’s favorite ethnic appetizer, followed by Mexican tidbits (e.g., nachos, tacos, quesadillas, and enchiladas) and spring rolls; 25% of those who order appetizers now opt for sushi (Technomic 2017c).
In 2017, 3.8 meals in a typical week were home cooked and contained meat or poultry—the highest proportion in five years; 74% of meal preparers include meat/poultry at least three days per week (FMI 2017b).
Since 2011, conventional meat/poultry posted compound annual sales growth of 4.6% versus products with a natural label at +14.6%; antibiotic-free, +28.7%; hormone-free, +28.6%; and organic, +44% (FMI 2017b).
Nearly half (48%) of shoppers bought natural or organic meat (FMI 2017b). Sales jumped 17% in 2016 to $991 million (OTA 2017). One in five consumers has purchased grass-fed beef and cage-free chicken (Packaged Facts 2017c).
Eight in 10 households prepare dinners with other protein main courses at least once a week. Top choices for non-meat main courses include fish/seafood, chosen by 57% of households; eggs, 52%; beans/lentils/legumes, 37%; quinoa/plant-based protein, 18%; seeds/nuts, 17%; veggie burgers, 13%; and soy/tofu, 8% (FMI 2017b).
Shrimp tops the list of the most eaten seafood, followed by salmon, canned tuna, tilapia, Alaska pollock, Pangasius, cod, crab, catfish, and clams (NFI 2017).
Consumers say spaghetti is their favorite pasta, followed by lasagna and macaroni and cheese (NPA 2015).
Sales of value-added/fresh-cut fruit grew 8.3%, and vegetables grew 8.7% for Y/E March 19, 2017, versus sales of traditional fruits and vegetables, each up 2.8%, per IRI (FMI 2017c). Packaged salad sales grew 4.7% for Y/E Dec. 31, 2016, per Nielsen. Complete kits account for 26% of total salad kit sales (FMI 2017c).
Potatoes are the most purchased vegetable, followed by tomatoes, onions, carrots, lettuce, broccoli, salad mix, bell peppers, celery, and cucumbers. Lettuce purchases grew 8% and potatoes 6% in the past year; bagged salads moved into the top 10 (Packer 2017).
Bananas are the most purchased fresh fruit, followed by apples, grapes, strawberries, oranges, watermelon, lemons, blueberries, peaches, and cantaloupe (Packer 2017). Nectarines came into the top 20, and mangos fell out of the top 20 list.
Sales of organic fruits rose 16.5% and organic vegetables were up 7.9% for Y/E March 19, 2017, per IRI (FMI 2017c). Fresh beans, squash, beets, peppers, cucumbers, mushrooms, and potatoes were the fastest-growing organic vegetables; limes, cherries, avocados, peaches, and berries were the fastest-growing organic fruits (Packaged Facts 2017d).
Trendy spaghetti squash, vegetable pastas and fries, and cauliflower-based pizza crusts are moving produce to the center of the plate. Vegetable carb substitutes are No. 7 on the list of hot culinary trends for 2018 (NRA 2017).
Nearly half of shoppers say they are grabbing fresh produce as a snack more often than last year. Fresh melon and berry mixes are the “go-to” produce snacks, followed by carrot/celery snacks (Packer 2017).
Sales of exotic fruits are likely to get more attention. Datassential reports that dragon fruit mentions on menus have jumped 192% over the past four years; persimmons, +121%; blood oranges, +105%; prickly pears, +88%; and passion fruit, +41% (Strailey 2017).
What’s for Lunch and Brunch
On average, 62% of Americans eat lunch 6–7 days per week; 21% do so 4–5 days weekly; 13% have lunch 1–3 times weekly; and 5% skip the meal (FMI 2017a).
Fifty-eight percent of adults pack a sandwich for lunch at least once a week; 68% pack one for their child. Nearly half of all consumers ate a sandwich in the past day (Datassential 2017).
Burgers, purchased by 88% of consumers, lead the list of sandwiches ordered away from home. Other popular options include deli sandwiches, purchased by 75%; chicken breast sandwiches, 72%; breakfast sandwiches, 66%; subs/heroes, 65%; tacos/burritos, 64%; wraps, 50%; hot dogs, 46%; mini sandwiches, 43%; and flatbread or panini sandwiches, each 40% (Technomic 2016).
Turkey, ham, beef, chicken, salami, and bologna are the largest deli cold cut categories. Salami is the fastest-growing presliced deli meat for Y/E July 1, 2017, with sales up 12.6%; sales of Italian specialty meats rose 4.5% (IDDBA 2018).
Consumers who use frozen snacks/appetizers as a meal replacement are most likely to do so at lunchtime. Forty-five percent have eaten frozen snacks for dinner, and 30% have had them for breakfast. Hispanics and households with kids are the most likely to do so (Mintel 2016b).
One-quarter of Millennials/Gen Xers bring frozen snacks to work; one in five eats them in the car en route (Mintel 2016b). In 2016, 37% of consumers bought a frozen handheld pocket sandwich for themselves; 38% bought burritos; 39%, Mexican-style snacks; 41%, Asian-style snacks; and 42%, Italian-style snacks (Mintel 2016b).
American, Swiss, cheddar, provolone, Parmesan, Muenster, Gouda, Colby Jack, and Brie are America’s most purchased deli cheeses (IDDBA 2018). Specialty cheese sales grew five times as fast as the overall category. Oaxaca, Mexican, manchego, Cotija, fontina, Gournay, butterkase, queso de papa, Jarlsberg, and panela are the fastest-growing specialty cheeses (IDDBA 2018).
Portable snack packs, shreds, organic/natural, and full-fat varieties are driving the cheese sector. For Y/E Aug. 6, 2017, sales of farmer cheese grew 27% and organic cheese, +35% (Kennedy 2017).
The fastest-growing cheeses in restaurants in 2016 were Danish blue cheese, Italian grana padano, and Mexican asadero (Kennedy 2017). Sweet flavors (e.g., chocolate), spicy varieties (e.g., habanero mango), and fruit-infused flavors (e.g., coconut) are right on trend.
Soup is another category that deli operators are giving some attention to; many plan to enhance their fresh soup stations (Dudlicek 2017b). For the 12 weeks ended Sept. 10, 2017, fresh soup sales jumped 11.7% (Weaver 2017).
 Blount Fine Foods offers a new line of fresh Asian-inspired soups that separate the broth and noodles until heating to prevent sogginess. Ready Pac’s new Fresh Prep’d soup kits include all the ingredients in a bowl plus a spoon; soup lovers need only add water.
In 2016, 59% of consumers ate breakfast 6–7 days per week; 13% ate breakfast 4–5 days per week; 21% ate it 1–3 days per week; and 7% skipped it all together. Eight in 10 Matures eat breakfast 6–7 days a week (FMI 2017a).
Cold cereal remains America’s most popular at-home breakfast (Mintel 2016b). Sales of frozen breakfast entrées climbed 6.1% for Y/E Aug. 13, 2017 (Penguin 2017). Asked about their breakfast product purchasing behavior, 65% of consumers in a Mintel survey reported purchasing hot or cold cereal at retail within the preceding three months (Mintel 2016b).
One-quarter of consumers said they bought eggs marked as cage-free, free-range, or pasture-raised; 23% bought local eggs; 20%, organic; 15%, natural; and 11% bought eggs from hens that were fed vegetarian diets (Packaged Facts 2017c).
Despite exotic newcomers, (e.g., French and Icelandic varieties), the yogurt category is struggling with sales; sales declined 1.9% for Y/E Aug. 6, 2017, as the Greek phenomenon wanes (Kennedy 2017).
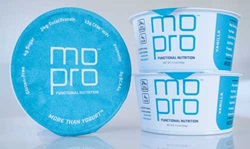 MOPRO Nutrition’s whole milk Greek yogurt uses technology to deliver 24 g of protein per cup, which makes it well positioned to compete with high-protein bars.
Two in five adults skip breakfast in favor of drinking a meal replacement beverage (Mintel 2016c). Four in 10 consumers say high protein is important to them at breakfast time (Mintel 2016c).
Ethnic breakfasts are among the hot culinary trends for 2018; 45% of consumers say they would be interested/very interested in breakfast burgers; 45% are interested in breakfast stir-fry; 37% breakfast lasagna; 35%, breakfast pasta or salad; and 32%, a breakfast soup (Datassential 2016b).
McCormick & Co.’s Slow Cooker Breakfast seasoning mixes have brought crock-pots into the early morning daypart.
 Snacks, Treats, and Desserts
Ninety-one percent of consumers snack multiple times per day; 37% of the time a snack provides one of the three most substantial eatings of the day (Hartman 2016).
In 2016, sales of indulgent snacks grew 2.5%; healthy snack sales fell 2.1%. Nearly half (48%) of snacks consumed were sweet; 31% were savory (Wyatt 2017).
No-/low-sugar fruit snacks, smoothies, appetizer rolls/snacks, low-sugar trail mix, snack-size fresh produce, doughnuts/pastry, refrigerated handheld nonbreakfast entrees, ice cream/sherbet, and chocolate-covered salty snacks were among the top dollar-growth snack categories for Y/E Feb. 26, 2017, per IRI (Wyatt 2017).
Among traditional salty snacks, popcorn posted the largest sales gains, up 12% for Y/E April 16, 2017, per IRI; puffed/extruded snack sales were up 7.6%; pork rinds, +4.9%; and corn snacks, +3.9% (Peckenpaugh 2017a). Dried meat snack sales grew 8% a year over the past five years to reach $3.2 billion in 2016 (Packaged Facts 2017e).
Seventy-five million households buy nuts as a healthy snack; 60 million buy breakfast/cereal/granola bars; 29 million, trail mixes; and 27 million, fruit snacks (Packaged Facts 2016b).
In 2016, 56% of adults bought snacks made with whole grains; 51%, snacks made with multigrain; 36%, vegetables; 27%, chick peas/garbanzos, lentils, beans, or dried peas; 22%, ancient grains; and 16%, seaweed (Packaged Facts 2017f).
For the first time in 10 years, sweet snacking is on the rise (NPD 2017). Ice cream, chocolate/candy, fresh fruit, cookies, and ice cream novelties are the most popular after-dinner snacks (NPD 2017, Figure 3).

Figure 3. Most Popular Evening Snacks. From The NPD Group/SnackTrack for Year Ending March 2016
Figure 3. Most Popular Evening Snacks. From The NPD Group/SnackTrack for Year Ending March 2016
Fifty-seven percent of adults eat dessert after a meal at least once a week; fruit is most often consumed (51% of adults), followed by cookies (40%), and ice cream/gelato/sorbet (40%) (Technomic 2017b).
In the packaged bakery aisle, pie sales jumped 8.2% for Y/E March 19, 2017, IRI reports; cakes sales increased 4.4%; snack cakes, +4.0%; and cookies, +1.8% (Peckenpaugh 2017a).
Sales of all packaged sweet good categories also rose. Sales of pastries/Danish/coffee cakes grew 4.2%; doughnuts, +3.0%; and muffins, +8.5%; 40% of adults regularly eat breakfast pastries (Peckenpaugh 2017b).
Cakes, bread, cookies, doughnuts, pies, artisan breads, and cupcakes were the best sellers in the in-store fresh bakery. Pies and specialty desserts posted strong gains for Y/E Feb. 25, 2017 (Martin 2017).
Dollar sales of snack and granola bars grew 1.6% for Y/E March 19, 2017. Sales of nutritional bars jumped 3.6% (Peckenpaugh 2017b).
What We’re Drinking
Today, U.S. consumers are drinking 72 fewer purchased beverages per year in and away from home than they were 10 years ago. Coffee, soft drinks, milk, iced tea, and bottled water are their top choices (NPD 2016). Nearly two-thirds of adults say they sometimes have a drink as a snack, up 3% versus 2016 (Wyatt 2017).
In 2016, bottled water overtook carbonated soft drinks as the largest beverage category. For Y/E May 14, 2017, bottled water sales rose 6.2%, and sparkling water sales were up 15% in mass markets/convenience stores, according to IRI (BI 2017). Bottled water sales are projected to increase 44% by 2021 (BMC 2017).
Seven in 10 adults consumed single-serve bottled water in 2016; 53% consumed regular carbonated soft drinks; 41%, tea drinks; 37%, sports drinks; 27%, coffee drinks; 26%, diet carbonated soft drinks; 23%, sparkling water/natural soda; and 15%, energy drinks/shots (Packaged Facts 2017g).
Ready-to-drink coffee sales jumped 22% for Y/E May 14, 2017; refrigerated ready-to-drink tea sales increased 7.1%; sports drinks, +4.7%; and energy drinks, +4%, per IRI. Also, according to IRI, energy shot sales fell 6.7% and growth of coffee K-cups slowed to 2.3% (BI 2017).
Sales of superpremium juice climbed 11%; natural and organic juice sales were up 7% and 23%, respectively (BI 2017).
Cold-pressed, cold-brewed, estate-grown, single origin, high protein, and—for juices—non-GMO remain highly appealing beverage terms (BI 2017).
Although milk consumption is down 4% versus 2000, 76% of Americans drink milk; 41% do so every day. About half drink lowfat milk. Sales of whole milk are up 3.9%, and flavored milk sales are up 3.2%; reduced-fat milk sales fell 6% for Y/E Aug. 6, 2017 (Kennedy 2017).
One-third of consumers sometimes drink chocolate milk; 16%, yogurt smoothies; 11%, flavored (not chocolate) milk; 10%, organic; 7%, lactose-free; and 2.3%, yogurt non-smoothie drinks (Packaged Facts 2017g).
One-third of adults drink plant-based nondairy milks; 30% do so daily. While younger adults are most likely to do so, use is growing with adults aged 55-plus (Packaged Facts 2017h).
Almond milk is consumed most often by 67% of plant-based milk users, followed by soy at 18%. Thirty percent of users sometimes drink coconut milk; 22% drink almond-coconut; 20%, cashew; 11%, rice; 8%, flax; 7%, chia or hemp; and 5%, quinoa (Packaged Facts 2017h).
With Health in Mind
Consumers continue their quest for fresh foods. For Y/E March 3, 2017, fresh perimeter department sales outpaced total food and beverage sales with growth of 3.9% for the perimeter versus 1.8% overall growth (Packaged Facts 2017d).
 More than eight in 10 consumers are very/somewhat concerned about the nutritional content of their foods (FMI 2017a). Healthful kids’ meals are No. 5 on the hot culinary trend list for 2018 (NRA 2017).
“High in nutrients” is the top attribute that defines healthy foods for consumers; 64% are trying to eat more protein; 60%, more fiber; 59%, more whole grains; 56%, more vitamins; and 48%, more potassium (IFIC 2016, 2017).
Three-quarters of adults (170 million people) take a supplement; 56% take a multivitamin; 28%, vitamin D; 24%, vitamin E; 20%, calcium; 18%, B-complex; 17%, protein; 16%, omega-3s; 12%, probiotics/magnesium; and 11%, vitamin E, fiber, or green tea (CRN 2017).
One in five retailers says clean label was the strongest wellness trend in 2016 (SN 2017). In 2017, 65% of food shoppers are looking for claims that avoid negatives; 59% want claims that confirm minimal processing; 41%, good fiber; and 25%, ethical practices (FMI 2017a).
Of the 57% of consumers who are at least somewhat familiar with the term, 30% say they look for minimally processed foods often if not all the time (FMI 2016d). Between June 2016 and May 2017, 23% of all new U.S. foods/drinks carried a no-additives/no- preservatives claim; 19% were GMO-free; 15%, organic; and 9%, all natural (Mintel 2017).
Organic food/beverage sales reached $43 billion in 2016, up 8.4% (OTA 2017). Forty-one percent of grocery shoppers are currently trying to avoid GMOs versus 45% who were doing so in 2015 (FMI 2017a).
Millennial women are the demographic segment most likely to describe themselves as vegetarian; 5.8% say they are vegetarian versus 3.6% of Millennial men. About a quarter of adults self identify as “flexitarian” or “lessitarian,” meaning that they’ve cut back on their consumption of animal-based foods and beverages. Twelve percent say they bought a packaged food item that carried a vegan claim, and 6% bought a product with a Paleo claim in the past month (Packaged Facts 2017d).
Weight loss is the most desired benefit from food, followed by heart health, energy, digestive health, immunity, muscle and bone health, and mental health (IFIC 2017).
A. Elizabeth Sloan, PhD, a professional member of IFT and contributing editor of Food Technology, is president, Sloan Trends Inc., Escondido, Calif. ([email protected]).


