Big Data in Food Safety and Quality

What is big data? No matter what definition is used, the term “big data” is most simply and best described by the sheer volume of data involved, which can offer the opportunity for increased insight and better decision-making that could not be accomplished by analyzing smaller data sets. Nonetheless, to uncover underlying trends, correlations, and relationships that would typically be absent from one-dimensional data alone, the analysis and management of huge data sets demand consideration of several other important aspects of big data. IBM describes big data by four key aspects: 1) the volume of data, 2) the speed at which data is generated, 3) the aggregation of distinctly different data types, and 4) the validity and security of data. These aspects are known as the four Vs: volume, velocity, variety, and veracity (IBM, 2014). Big data has required the development of new non-relational database structures capable of handling unstructured data, computational algorithms that can effectively use all dimensions of big data, and parallel and cloud computing infrastructure to enable fast processing and sharing of data. According to the McKinsey Global Institute, the use of big data could revolutionize and create value across all sectors of the global economy, save the United States $300 billion annually in healthcare costs, and increase operating margins for retailers by 60% (Manyika et al., 2011). Furthermore, free or low-cost sources of unstructured data, such as word searches on Internet engines and online discussion sites, may provide near real-time information on disease outbreaks (Keller et al., 2009) (see Figure 1). Despite its potential, big data remains vulnerable to traditional data-analysis challenges such as sampling error and bias, the failure to correct significance levels for multiple comparisons, and the correlation-causation inference that is characteristic of working with retrospective data. Nevertheless, development and implementation of tools that use big data in food safety have considerable potential to improve microbial food safety and quality.
Big Data Applications in Food Safety and Quality
Similar to other areas, the amount of food safety-related data being generated by the government, industry, and academia is increasing rapidly. While specific information on the amount of data being generated is often not easily accessible, the use of big data is very apparent in routine subtyping of foodborne pathogens. Techniques that interrogated only a small proportion of bacterial genomes (e.g., pulse field gel electrophoresis) are being replaced by whole genome sequencing (WGS), which provides information on each of the approximately three to six million nucleotides that make up typical bacterial foodborne pathogen genomes. For example, the private-public partnership 100K Foodborne Pathogen Genome Project aims to sequence 100,000 foodborne pathogen genomes. Similarly, the U.S. Centers for Disease Control and Prevention, the U.S. Food and Drug Administration (FDA), and the U.S. Dept. of Agriculture’s Food Safety and Inspection Service as well as public health agencies in other countries have begun routinely sequencing foodborne pathogen isolates. For example, since fall 2013 all human clinical Listeria monocytogenes isolates obtained in the United States are subjected to WGS by either state or federal public health agencies. In addition to the large data sets that are being generated specifically for food safety applications, food safety professionals increasingly recognize the value of using larger data sets that are not specifically for food safety applications. For example, the use of geographical information systems technology (GIS) and geo-referenced data for predicting or identifying pre-harvest food safety hazards (particularly in the produce area) shows considerable potential to yield new science-based approaches to food safety hazards. The food industry collects large data sets, often through real-time monitoring, that could be used in more in-depth analyses along with other data sets to improve food safety and optimize food safety investments. This article highlights a few examples of how big data can be used to develop and implement improved food safety practices and how big data could help food safety professionals make better decisions.
--- PAGE BREAK ---
Using GIS to Predict Foodborne Pathogen Hot Spots
GIS is a computer-based tool for mapping and analyzing things on earth. The technology integrates common database operations, such as query and statistical analysis, with the visualization and geographic analysis offered by maps. With regard to food safety, GIS combines information on geographical features and attribute data (i.e., characteristics/information related to a specific location) to identify associations between the environment and a pathogen. The first application of geographic analysis was in 1854 when Dr. John Snow, a London physician recognized as one of the pioneers of modern GIS and epidemiology, mapped the location of cholera deaths and water wells. He used maps along with personal interview data to identify the source of the disease: the Broad Street water pump.
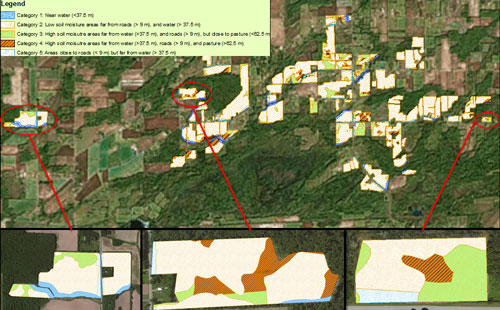 Today, GIS is applied to predict the spatial and temporal occurrence of foodborne pathogen contamination in produce production environments. Furthermore, GIS has aided growers to understand the transmission dynamics of foodborne pathogens in the environment as well as various spatial-temporal factors (e.g., climate trends, proximity to landscape features, soil properties) that influence the potential for produce contamination events. The ultimate goal is to prioritize risks on farms and to develop a preventive approach to pre-harvest food safety. The application of GIS in produce food safety has shown incredible promise, such as helping growers make more informed decisions about field practices and develop targeted pathogen-surveillance programs. For example, the FDA and National Aeronautics and Space Administration have collaborated to develop GIS-Risk, a program that links GIS data with predictive risk-assessment modes to forecast when, where, and under what conditions microbial contamination of crops is likely to lead to human illness (Oryang et al., 2014). Furthermore, Strawn and others (2013) used a GIS framework to predict spatial locations of L. monocytogenes reservoirs based on proximity to various landscape features and level of soil moisture in the produce production environments of the State of New York. They showed field locations near impervious land cover class had a predicted L. monocytogenes prevalence of 20% while field locations away from impervious land cover class had a predicted L. monocytogenes prevalence of only 5%. Growers can therefore identify locations on farms that are at high risk for contamination and implement intervention measures to minimize the risk of transfer to produce (see Figure 2). Additionally, researchers observed that the incidence of Escherichia coli O157:H7 increased significantly after heavy rains in a California produce growing region (Cooley et al., 2007). This finding suggested that during intense weather and subsequent flooding events, pathogen levels in the environment may be elevated. Therefore, monitoring data on rainfall totals or river flow rates may aid growers in forecasting risk of potential contamination events.
Overall, the application of GIS to produce safety research has generated massive amounts of new data on the ecology of different organisms in the environment and data on various spatial-temporal-based scenarios that influence the likelihood of contamination events. In this big data driven era, GIS is one tool that helps researchers store, capture, process, analyze, and visualize large datasets. While the promise of GIS to complex food safety issues is being demonstrated, further integration of multiple large data sets (e.g., WGS data, real-time data acquired via drones) will be critical to further improve food safety throughout the farm-to-fork continuum. Application of GIS tools to address pre-harvest food safety of plant-based foods will specifically be facilitated by the rapid growth of precision agriculture, which focuses on improving yield and optimizing various production inputs.
 Improving Surveillance and Traceability through Next-Generation Sequencing
Big data and genomics tools are already making a considerable impact in facilitating improved surveillance of foodborne diseases and foodborne pathogen contamination. In the United States, 48 million people fall prey to foodborne illnesses, yielding 128,000 hospitalizations and 3,000 deaths per year; associated economic burdens are estimated at $152 billion annually (Scallan et al., 2011). At times, mitigating foodborne illness seems an intractable challenge; however, big data is now providing timely and innovative solutions. For example, next-generation WGS is revolutionizing the science behind food safety, pathogen diagnostics, and molecular trace-back of food and feed contamination events. Never before have scientists had access to and been able to analyze and compare—in high resolution—thousands of complete genomic sequences of bacterial pathogens. This vast amount of genomic data permits a better understanding of virulence traits, adaptability to food manufacturing environments, geographical and host traceability, transmission to humans, and a host of other information important to food scientists and regulators (Lienau et al., 2011; Allard et al., 2012, 2013; Hoffman et al., 2014).
The FDA has created, validated, and applied for real-time regulatory use an open-source WGS integrated network of state, federal, and industry partners. The network is known as GenomeTrakr and represents the first distributed genomic food shield for detecting and tracing foodborne pathogen outbreaks back to their sources. WGS information guides investigators to specific food products, plants, and farm sources for pathogen outbreaks, providing valuable insight into the origin of contaminated food. This capability is particularly important because the FDA has a limited number of food inspectors and the U.S. food supply is becoming more global. Sample collection and sequence cataloging from food production sites can help monitor compliance with the FDA’s rules on safe food-handling practices, enhancing preventive controls for food safety. A recent example involved the 2014 suspension of a U.S. producer of a Mexican-style cheese linked to numerous illnesses caused by L. monocytogenes. WGS was employed to confirm the link between the food and facility isolates and those derived from clinical cases. The usefulness of this new technology for source tracking had previously been demonstrated when it provided enough high-resolution micro-evolutionary single nucleotide polymorphism changes to pinpoint the sources and ingredients of a Salmonella outbreak in spiced meats in 2009 and was used to confirm L. monocytogenes persistence for 12 years in a food processing facility (Orsi et al. 2008).
The FDA’s Center for Food Safety and Applied Nutrition and the National Center for Biotechnology Information at the National Institutes of Health have collaboratively developed a complementary database, bioinformatics pipeline, and associated dashboard software tools for WGS applications in public health. The proliferation of such distributed WGS networks provides a snapshot of how foodborne pathogen surveillance and traceability may greatly improve public health.
--- PAGE BREAK ---
Preventing Food Safety Issues
Big data has the ability to change the conventional strategy for prevention: Historically, food safety professionals have relied on food safety audits or inspections to determine if a food establishment was in compliance with food safety standards and regulations. However, at best, food safety audits are a snapshot of an establishment’s condition at a single point in time. For example, retail food-inspection results were not a good predictor of whether or not a food establishment would be linked to or cause an outbreak because of the low frequency of visits, which ranged from once a year to just a few times per year (Jones et al., 2004).
 One nationwide retailer, Wal-Mart Stores Inc., is leveraging big data for food safety purposes. Wal-Mart utilizes handheld information technology, Bluetooth communication, and state-of-the-art temperature measuring devices to check the internal temperatures of every batch of rotisserie chickens cooked, ensuring a safe internal temperature. In a single period, health inspectors across the country checked rotisserie chicken cooking temperatures in Wal-Mart stores approximately ten times. During the same time frame, a third-party inspection firm checked rotisserie chicken cooking temperatures approximately 100 times, a tenfold increase of the checks during regulatory inspections. However, by leveraging data obtained over this same period of time through an internal handheld self-check system, Wal-Mart recorded 1.4 million internal cooking temperatures of rotisserie chickens. This approach provided much greater insight than what could have been obtained through inspections or audits alone. Leveraging big data and the information it provides appears to be an innovative and effective way to enhance regulatory compliance and track compliance with desired standards.
 Enhancing the Quality of Food
Big data tools such as metagenomics also increasingly offer new approaches to control and reduce microbial food spoilage. Food spoilage results from complex combinations of microbiological factors and physiochemical factors of the matrix, and the relationships between causative agents and physiochemical changes associated with spoilage are poorly defined. In some foods, such as fresh pork sausage, microbial growth (as measured by traditional methods) and spoilage are even temporally unlinked by as much as 30 days, leading to the suspicion that microbial growth plays only a small role in spoilage. Using large-scale parallel 16S rRNA-based pyrosequencing, researchers described in detail the dramatic changes in abundances of microbial species that occur over the shelf life of a refrigerated model sausage product, effectively resulting in multiple ecological successions of taxa with one wave of microorganisms rising to high abundances and displacing the previous wave (Benson et al., 2014). These successions occurred despite little change in the absolute abundance of the populations detected by traditional plating, illustrating the powerful resolution afforded by metagenomic analysis. The addition of antimicrobials changed the picture dramatically, yielding an essentially static community for the first 30 days of refrigeration, followed by an abrupt decline in relative abundances of nearly the entire population except for a single microorganism. Combining changes in microbiota composition with chemical signatures of the matrix over time further established high degrees of correlation between abundances of specific taxa and significant changes in the chemical composition of the sausage, providing a list of possible taxa as major causes of the onset of spoilage. Detailed trace-back analyses comparing the distributions of specific taxa from ingredients and final product also identified the ingredients, specifically the spice blend, as a major source of the most abundant taxon in the spoiled product. Importantly, it was the combination of high-resolution microbiota data and traditional plating data that enabled a full understanding of the ecosystem behavior to reduce the likelihood of spoilage, thus enhancing the quality of the product.
Challenges and Opportunities
Opportunities for big data applications in food safety and microbial spoilage beyond the ones detailed in this article appear to be abundant, yet food scientists and food microbiologists have used only a small amount of the relevant data generated and available. Hence, there is a considerable need for a comprehensive multidisciplinary approach across industry, government, and academia to develop the people, tools, and infrastructure to facilitate application of big data in food science. The challenges on this path are multifaceted and range from the rather mundane, such as switching from paper-based to electronic-based record-keeping schemes, to the complex, such as implementation of computational tools that can integrate and analyze structured and unstructured data (e.g., video, satellite images, audio) to reveal food-safety-relevant associations. An important next step will be to create data that show that analyses of big data can also successfully predict future microbial food safety and quality outcomes. In addition, there is an urgent need to train future food safety professionals and food scientists to use and analyze big data sets and interact successfully with data scientists. The ultimate creation of a big data culture in the food industry can facilitate considerable advancements in food safety, food quality, and sustainability.
Laura K. Strawn, a member of IFT, is assistant professor, Dept. of Food Science and Technology, Eastern Shore Agriculture Research and Extension Center, Virginia Polytechnic Institute and State Univ., Painter, Va. (Lstrawn@vt.edu). Eric W. Brown is director, Division of Microbiology, Center for Food Safety and Applied Nutrition, U.S. Food and Drug Administration, College Park, Md. (eric.brown@fda.hhs.gov). Jairus R. D. David, a professional member of IFT, is senior principal research scientist, research & innovation, applied science & technology, ConAgra Foods Inc., Omaha, Neb. (jairus.david@conagrafoods.com). Henk C. den Bakker is assistant professor, Dept.of Animal and Food Sciences, Texas Tech Univ., Lubbock, Texas (henk.C.den-bakker@ttu.edu). Pajau Vangay is graduate research assistant, Dept. of Biomedical Informatics and Computational Biology, Univ. of Minnesota, Minneapolis, Minn. (vanga015@umn.edu). Frank Yiannas, a member of IFT, is vice president of Food Safety, Walmart, Bentonville, Ark. (frank.yiannas@walmart.com). Martin Wiedmann, a professional member of IFT, is professor, Dept. of Food Science, Cornell Univ., Ithaca, N.Y. (mw16@cornell.edu).
References
Allard, M.W., Luo, Y., Strain, E., et al. 2012. High resolution clustering of Salmonella enterica serovar Montevideo strains using a next-generation sequencing approach. BMC Genomics 13: 32.
Allard, M.W., Luo, Y., Strain, E., et al. 2013. On the evolutionary history, population genetics and diversity among isolates of Salmonella Enteritidis PFGE pattern JEGX01.0004. PLoS One 8(1): e55254.
Benson, A.K., David, J.R.D., Gilbreth, S.E., et al. 2014. Microbial successions are associated with changes in chemical profiles of a model refrigerated fresh pork sausage during an 80-day shelf life study. Appl. Environ. Microbiol. 80(17): 5178–5194.
Cooley M., Carychao, D., Crawford-Miksza, L., Jay, et al. 2007. Incidence and tracking of Escherichia coli O157:H7 in a major produce production region in California. PLoS One Nov. 2007(11): e1159.
Hoffmann, M., Zhao, S., Pettengill, J., et al. 2014. Comparative genomic analysis and virulence differences in closely related Salmonella enterica serotype Heidelberg isolates from humans, retail meats, and animals. Genome Biol. Evol. 6: 1046–1068.
IBM. 2014. The four V’s of big data. www.ibmbigdatahub.com/infographic/four-vs-big-data. Accessed Dec. 19, 2014.
Jones, T., Pavlin, B., LaFleur, B., et al. 2004. Restaurant inspection scores and foodborne disease. Emerg. Infect. Dis. 10(4): 688–692.
Keller, M., Blench, M., Tolentino, H., et al. 2009. Use of unstructured event-based reports for global infectious disease surveillance. Emerg. Infect. Dis. 15(5): 689–695.
Lienau, E.K., Stain, E., Wang, C., et al. 2011. Identification of a Salmonellosis outbreak by means of molecular sequencing. N. Engl. J. Med. 364: 981–982.
Manyika, J., Chui, M., Brown, B., et al. 2011. Big data: the next frontier for innovation competition, and productivity. http://www.mckinsey.com/insights/business_technology/big_data_the_next_frontier_for_innovation. Accessed Dec. 19, 2014.
Orsi, R.H., Borowsky, M.L., Lauer, P., et al. 2008. Short-term genome evolution of Listeria monocytogenes in a non-controlled environment. BMC Genomics 9: 539–555.
Oryang, D., Dennis, S., and Chen, Y. 2014. U.S. FDA Risk Modeling Tools for Enhancing Fresh Produce Safety: Modeling the Interface between the environment and Produce. Presented at ORACBA Science Policy and Risk Forum, College Park, Md., July 23.
Scallan, E., Hoekstra, R.M., Angulo, F.J., et al. 2011. Foodborne illness acquired in the United States– major pathogens. Emerg. Infect. Dis. 17(1): 7–15.
Strawn, L.K., Fortes, E.D., Bihn, E.A., et al. 2013. Landscape and meteorological factors affecting prevalence of three food-borne pathogens in fruit and vegetable farms. Appl. Environ. Microbiol. 79(2): 588–600.
Authors
-
MARTIN WIEDMANN
Categories
-
Food Safety and Defense
-
Food Technology Magazine


