What, When, and Where America Eats

 A. Elizabeth Sloan
Food Technology Magazine
Americans are spending more than half (54%) of their food dollars on food away from home; that’s the highest level in history (Lyons Wyatt and Parker 2019a).
Although more than eight in 10 dinners are eaten at home, the number of evening meals prepared at home continues to fall. On average, U.S. households prepare 4.5 dinners at home per week, down from 4.9 in 2017; 28% of households prepare meals three nights per week or less; and 28% do so on six or more nights (FMI 2019a).
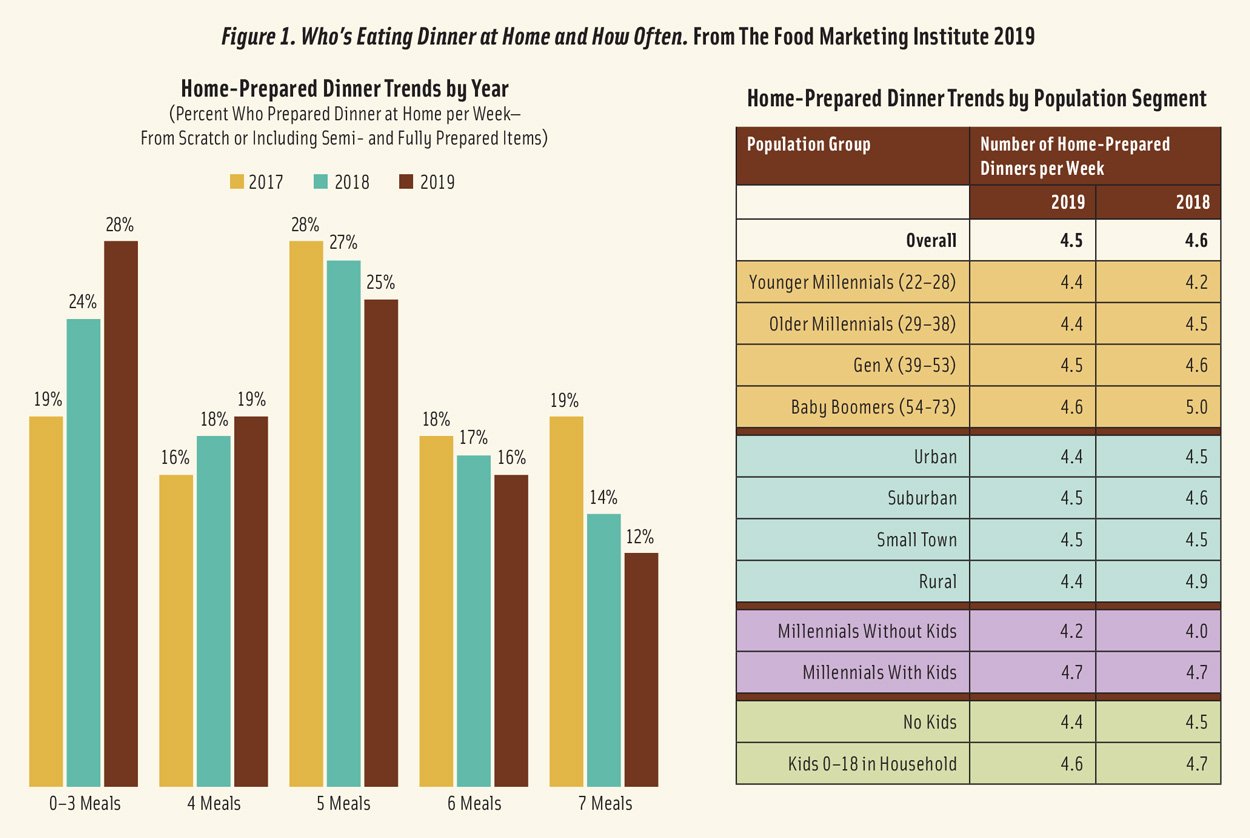
Over the past year, for the first time, the number of meals prepared at home by Baby Boomers and by those who live in rural areas has dropped dramatically, down from 5.0 to 4.6 meals per week and 4.9 to 4.4, respectively (FMI 2019a; Figure 1).
On average, U.S. adults eat breakfast 4.9 times per week, lunch 5.5 times, and dinner 6.4 nights per week; those living alone eat breakfast slightly less frequently (FMI 2019b).
Forty-six percent of eating occasions are alone; that includes 53% of breakfasts, 45% of lunches, and 24% of dinners. Most people snack alone (Hartman 2018a). Four in 10 visits to restaurants are also alone (Packaged Facts 2019a).
Interest in eating with others is on the rise; 60% say they’ve “eaten well” if they have eaten with family or friends (FMI 2019b).
Although only 3.6 dinners, 2.0 breakfasts, and 1.4 lunches per week are eaten at home with the family in households with children, 76% of parents say eating together is very or extremely important (FMI 2019b).
Kid-specific foods and takeout/take home–oriented menus are becoming increasingly important as parents make separate meals for adults and kids on 49% of family eating occasions (FMI 2019b).
Millennials continue to drive demand for more specialty foods/drinks. Over the past two years, gourmet food sales jumped 9.8% to reach $113 billion at retail and an additional $2.8 billion online (SFA 2019).
Cheese/plant-based cheese alternatives; frozen/refrigerated meat, poultry, and seafood; chips, pretzels, and snacks; coffee/cocoa; bread/baked goods; chocolate/ confectionery; refrigerated entrées; frozen desserts; frozen entrées; and yogurt/kefir (in descending order) are the largest specialty food categories (SFA 2019).
Refrigerated/frozen plant-based meat alternatives, rice cakes, waters, refrigerated ready-to-drink tea/coffee, creams/ creamers, frozen desserts, jerky/meat snacks, and refrigerated pasta posted the largest specialty dollar sales gains (SFA 2019).
Over the past few years, the U.S. food culture has focused consumers on eating “fresh.” When shopping, 67% of consumers prioritize fresh; 55%, clean; 49%, real; and 47%, pesticide-free (Hartman 2018b). Of the 38% who experimented with a diet in the past year, 10% did so for clean eating (IFIC 2019).
But while fresh still makes up onequarter of multi-outlet food/drink retail sales, growth slowed to 1.3% for the year ended (Y/E) Sept. 8, 2019, versus overall food/drink sales, which grew 2.0% (Lyons Wyatt and Parker 2019a). Deli/ prepared food, seafood, and packaged/ fresh bakery were the only major fresh departments posting positive dollar gains (Lyons Wyatt and Parker 2019a). During the same time frame, center-store sales growth outperformed fresh foods for the first time in 10 years (Lyons Wyatt and Parker 2019a).
Lastly, consumers have more choice than ever; 13,000 new UPC food/beverage brands were launched in 2018, with only four reaching year one sales of more than $100 million (Lyons Wyatt and Parker 2019b).
Taking Out Takes Over
It’s time for restaurants to start catering to the younger generations—literally. Millennials (80%) and Gen Z (70%) are now the most likely to visit a restaurant at least once a week versus 67% of Gen Z and 50% of Boomers (Technomic 2018a).
In 2018, these younger generations each sourced 45% of their lunches, 40% of dinners, one-third of their breakfasts, and 30% of their late-night snacks from foodservice (Technomic 2018a).
Quick-service restaurants serving beef, barbecue, or burgers remain by far the most visited restaurant by menu segment—used by 74% of the U.S. population or 182 million adults. That is followed by restaurants that focus on chicken, patronized by 47% of the population; coffee/bakery outlets, 42%; Mexican/Asian/ethnic restaurants, 41%; sandwich shops, 33%; ice cream/ smoothie/juice outlets, 11%; and seafood-focused restaurants, 8% (Packaged Facts 2019a).
For the first time, sales in Asian/noodle limited-service and full-service restaurants outpaced Mexican in 2018.
McDonald’s is the most popular restaurant, with 127 million U.S. customers visiting in the 12 months ending in spring 2019. Chick-Fil-A, with 66 million patrons, outpaced KFC in the chicken sector.
Applebee’s, with nearly 54 million patrons, still has the most diners in the casual dining segment despite Olive Garden, with about 49 million patrons, taking over the top spot in sales earlier this year. Steakhouses and seafood restaurants still reign in full-service (Packaged Facts 2019a).
Diners ordered 6.4 billion beef burgers and 4 billion chicken sandwiches versus 228 million vegetable burgers and vegetable/salad sandwiches for Y/E April 2019 (NPD 2019).
Chicken sandwiches/strips, other desserts/snacks, pizza, and tacos are the fastest-growing quick-service items (NRA 2019). For the first time, sales in Asian/noodle limited-service and fullservice restaurants outpaced Mexican in 2018 (Technomic 2019a).
Build-your-own items are the top trend for quick-service and fast casual restaurants and will gain in popularity on restaurant menus along with iced tea, mini-desserts, snack-sized versions of regular meal items, healthy meals for kids, specialty coffees, and ethnic condiments (NRA 2019).
All natural/minimally processed, vegetarian/vegan, gluten-free, housemade, locally and eco-sourced produce/ meats, and organic and free-range/grassfed meat and poultry are the healthy and sustainable menu descriptors projected to get more attention.
But consumers are not dining out more often. Diners eat at the restaurant on only 38% of all visits; 39% of visits are for carryout; 22% are drive-through visits; and 3% involve food delivery (NRA 2019).
Customers dine off-premise on more than three-quarters of quick-service and coffee/bakery/snack shop visits, half of fast casual, 20% of family, 18% of casual, and 6% of fine dining visits (NRA 2019). Off-premise traffic is equally split between lunch and dinner for quickservice and fast casual restaurants; breakfast dominates in coffee/snack outlets (NRA 2019). While visits to restaurants by Millennial parents with their kids are increasing faster than those of any other group, 40% of the meals they buy are eaten at home (Technomic 2018a).
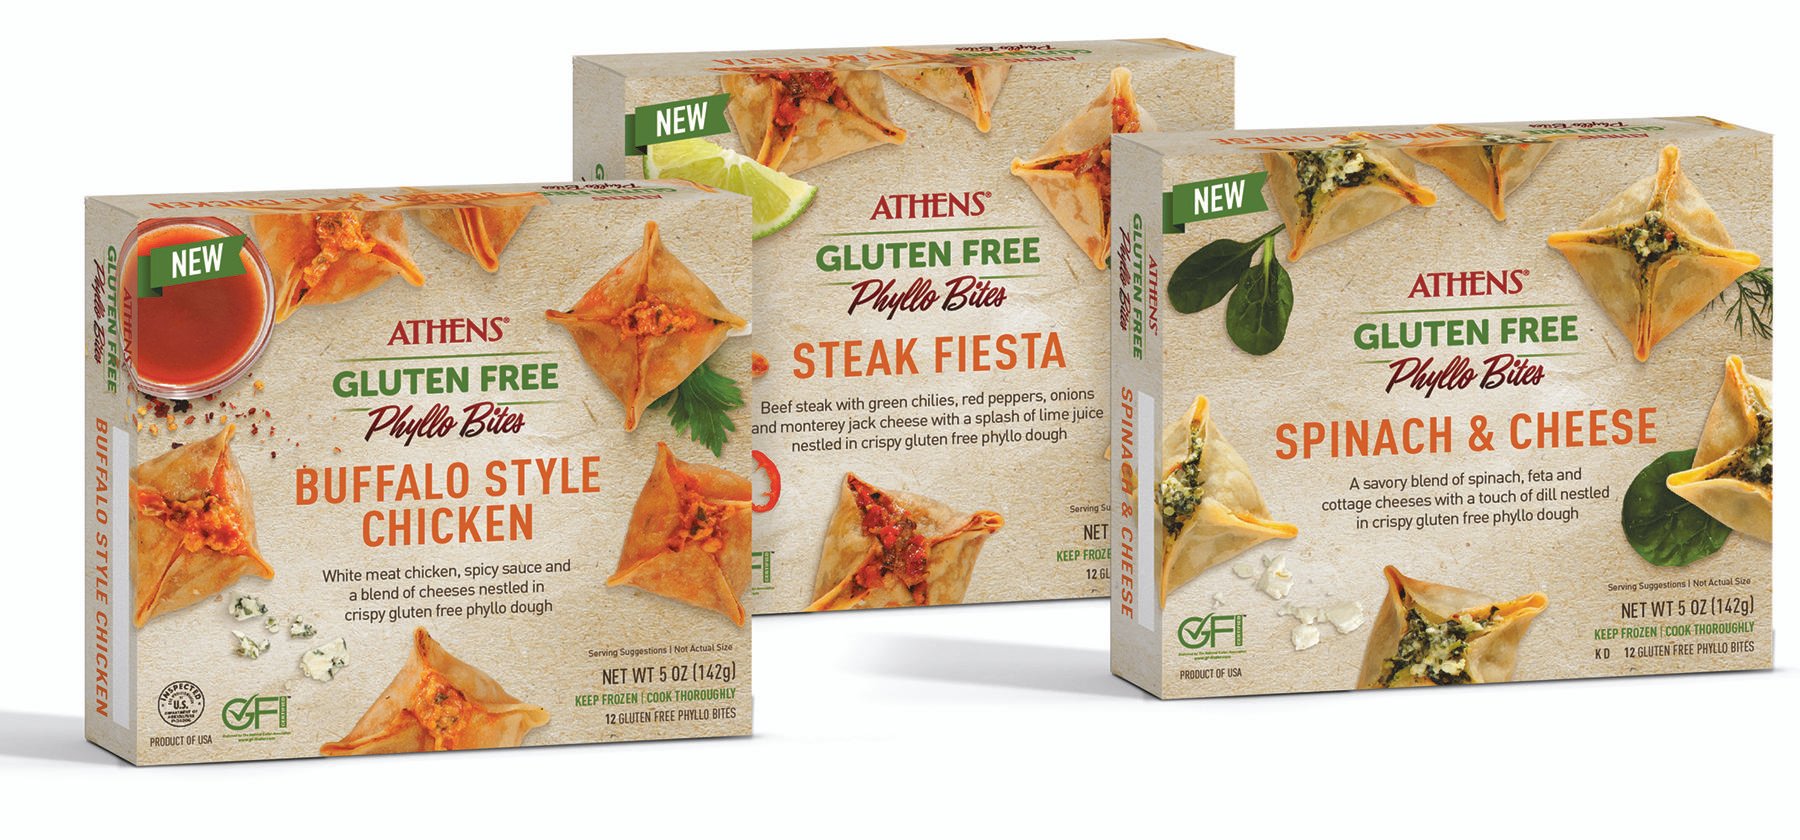
Nine of the top 10 frozen food categories reported sales growth, with frozen appetizers leading unit growth. New Phyllo Bites from Athens Foods are gluten-free and available in three flavors. Photo courtesy of Athens Foods.
Quick Fixes
Sales of retail prepared foods topped $12.5 billion for Y/E March 24, 2019. Sales of entrées/prepared meats were up 2.6% to $5.3 billion; appetizers were up 13.5% to $1.8 billion; and dips/sauces, up 12.7% to $313 million (Dubois et al. 2019a).
Sushi accounts for 10.4% of prepared food sales. Prepared salad sales topped $1.8 billion; sales of sandwiches were $1.7 billion; sides, $412 million; and soups, $227 million.
Sales of fresh prepared breakfast sandwiches were up 39%; egg roll appetizers, +34%; chicken appetizers, +16%; vegetable entrées, +14%; hot sandwiches, +11%; jalapeno popper appetizers, +7%; and pasta side dishes, +5%. Pizza sales fell 3% (Dubois et al. 2019a).
Home entertaining is driving party appetizer platter sales, up 25% to $337 million; holiday meal sales jumped 17%. One in 10 consumers buy prepared foods at gourmet retailers; 9% purchase prepared foods at convenience stores (Lyons Wyatt and Parker 2019b).
Sales at olive, caper, and pickled vegetable food bars reached $450 million; trail mix and gelato bars are other popular in-store stations (Dubois et al. 2019a).
Forty-five percent of consumers have increased their purchases of frozen foods for Y/E Sept. 8, 2019 (Lyons Wyatt and Parker 2019a). Although two-thirds bought more frozen products for convenience, 61% did so to try a new food, cuisine, or flavor (AFFI 2019).
With sales of $9.2 billion in 2018, dinners/entrées remain the largest frozen food category, followed by ice cream at $6.8 billion; novelties, $5.2 billion; pizza, $4.9 billion; seafood, $4.8 billion; poultry, $4.2 billion; breakfast food, $3.5 billion; meat, $2.7 billion; vegetables, $2.5 billion; and appetizers/snack rolls, $2.3 billion. Nine out of the top 10 frozen categories grew sales; frozen appetizers led unit growth (AFFI 2019).
Nearly half (45%) of workers bring frozen food to work for breakfast, lunch, or snacks at least occasionally. Real, no artificial ingredients, and all natural are the claims that matter most to frozen food users (AFFI 2019).
The Dinner Lineup
Serving home-prepared meals using meat/poultry has returned to levels not seen since 2011–2012, with frequency at four nights/week. This is despite all the talk about cutting back on meat consumption (FMI 2019c).
The U.S. Department of Agriculture projects meat/poultry consumption overall will remain essentially the same in 2019 as last year. In terms of pounds, chicken and beef are now consumed at about equal levels (USDA 2019).
Chicken tops the list of foods Millennials typically eat for a weekday dinner, with 70% doing so; 46% eat beef; 39%, a burger; 31%, fish; and 28%, pork. Pasta, pizza, salad, rice, and Mexican foods are other popular weekday dinner items for young adults (Ypulse 2018).
Added-value meats/poultry (e.g., premarinated/seasoned meats), drove 50% of the growth in the fresh meat department for Y/E Jan. 19, 2019. While still the largest sector, whole fresh items accounted for only 24% of growth; ready-to-eat/precooked accounted for 22% (Dubois et al. 2019b).
Sales of fresh chicken stir-fry/kebabs/ fajita cuts and ground pork each grew 14% in 2018; ground chicken, +12%; chicken thighs, +9%; variety beef cuts, +8%; beef ribs, +6%; chicken wings, +6%; and ground turkey, +6%. Valueadded chicken sales rose 8.8%; value-added pork, +6.3%. Sales of fresh prepared grab-and-go meats jumped 16.1% in the deli (Dubois et al. 2019b).
All-natural meat/poultry sales reached $7.3 billion, up 2.4% for Y/E Jan. 19, 2019; antibiotic-free was $4.9 billion, up 3.1%; hormone-free was $3.4 billion, up 5.2%; organic was $950 million, up 13.1%; humanely raised was $515 million, up 0.6%; and grass-fed was $489 million, up 11.7%. Grass-fed tops the list of claims shoppers want to see more of in their fresh meat case (FMI 2019c).
Over the past two years, 14% of adults say they have increased their frequency of eating meatless meals (HealthFocus 2019). Fourteen percent describe themselves as flexitarian, and 4% say they are pescatarian (Datassential 2019).
While 32% of consumers are interested in vegetarian menu items and 28% are interested in vegan menu items, the percentage who are practicing these eating plans is a much smaller group; 5% of consumers define themselves as full-time vegetarians, and 3% say they are fulltime vegans. Vegan descriptors appear on 11% of restaurant menus (Datassential 2019).
Young adults aged 18–24, followed by those aged 25–39, Asians, and both low-income and very high-income individuals, are most likely to be true non-meat consumers (Packaged Facts 2019b).
One-third of consumers purchased a meat alternative in a recent three-month period in 2019 (Hartman 2019a). Threequarters of those who buy meat alternatives also eat meat. U.S. retail meat alternative sales topped $979 million for Y/E Jan. 19, 2019, up 17.6% (FMI 2019c).
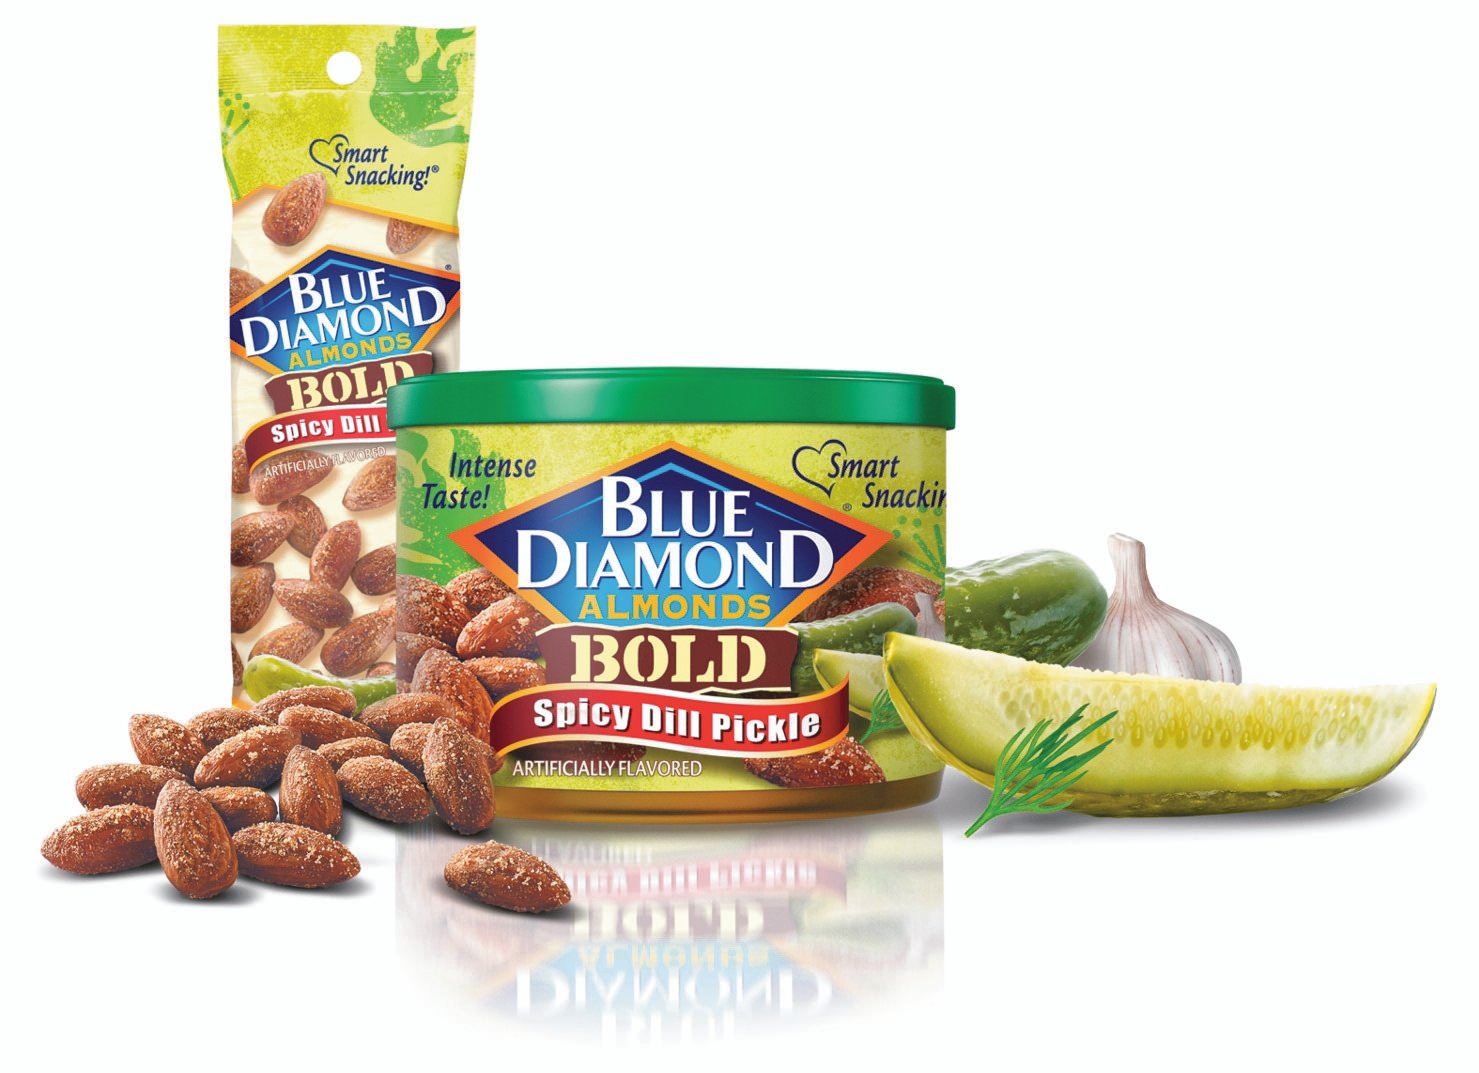
For that segment of consumers who seek to eat adventurously, Blue Diamond offers almond varieties like Bold Spicy Dill Pickle. Photo courtesy of Blue Diamond Growers.
Right after burgers, chicken/poultry, hot dogs, pizza, breakfast items, and deli meat are the most popular forms of meat alternatives. Morningstar Farms, Boca, and Gardenburger are the most purchased brands (Packaged Facts 2019b).
Beyond Meat’s investment prospectus projects sales of $213 million for yearend 2019, including both restaurants and retail (Beyond Meat 2019).
At least on occasion, 73% of meal preparers serve plant protein–based meals for dinner. Beans, chickpeas, lentils, and legumes are used by 49%, nuts/ seeds by 48%, veggie burgers or similar by 30%, quinoa or other grains by 29%, and tofu/tempeh by 17% (FMI 2019d). Just over half of consumers eat legumes at least once a week (Datassential 2019).
Two-thirds of adults eat fish; 58% are eating more fish/seafood, at least occasionally. Shrimp, salmon, tuna, tilapia, Alaskan pollock, pangasius, cod, crab, catfish, and clams are America’s most consumed fish/seafood (NFI 2019).
Four in 10 consumers (43%) purchased milk alternatives in a recent three-month period; 30% bought dairy product alternatives. Plant-based spreads, creamers, yogurt, cheese, and ice cream posted significant double-digit growth albeit from a small base for Y/E April 2019 (PBFA 2019).
Cheesy now tops the list of flavors that consumers crave; next is savory, which has led the list for the past few years. It is followed by sweet, buttery, and spicy (Technomic 2019b).
Sales of natural and specialty cheese are projected to exceed $23 billion by 2023 (Packaged Facts 2019c). More restaurants are specifying the type of fromage being used in their menu items. Rather than labeling something as simply blue cheese, for example, menus mention other more upscale forms (e.g., Gorgonzola). The name of the cheesemaker is also becoming more popular on menus (Datassential 2018).
While Italian, Mexican, Chinese, and U.S. regional (e.g., Southern and Tex-Mex) still top the list of favorite cuisines, Asian cuisines are quickly moving center stage. Half of consumers have now tried Japanese cuisine, like it, and think it is unique. In addition, 43% have tried Thai food; 36%, Korean; 34%, Indian; 28%, Vietnamese; 24%, Indonesian; 20%, Filipino; and 12%, Malaysian fare (Technomic 2018b).
Trying new flavors is increasingly aligning with dining in at home as takeout/take-home meals increase. Four in 10 adults find a simple twist to a familiar flavor, a seasonal flavor, or a regional/local flavor unique (Technomic 2019b).
Although one-third of consumers are looking for bolder flavors, half of consumers prefer food that is not spicy. Expect restaurant operators to feature more herbs and milder spices on menus (Technomic 2019b). It’s important to note that only 20% of consumers seek out new flavors all the time; 66% do so from time to time (Technomic 2019b).
Four in 10 consumers eat fresh produce daily; 36% eat fresh fruits/ vegetables three days a week or less often. Dinner, followed by snacks, are the dayparts where Americans are trying to increase their produce consumption; the demand for more fresh produce snacks is up 17% versus 2017 (FMI 2019d).
In descending order, bananas, apples, grapes, strawberries, watermelon, oranges, lemons, blueberries, peaches, and pineapple were the most purchased fresh fruits in 2018. Pineapple moved up into the top 10; honeydew and mango are new additions to the top 20 (Johnson 2019).
Potatoes, onions, tomatoes, carrots, bell peppers, lettuce, broccoli, salad mix, cucumbers, and celery topped the list of the most purchased fruits. Green beans,green onion, and bell peppers moved up significantly among the top 20 (Johnson 2019).
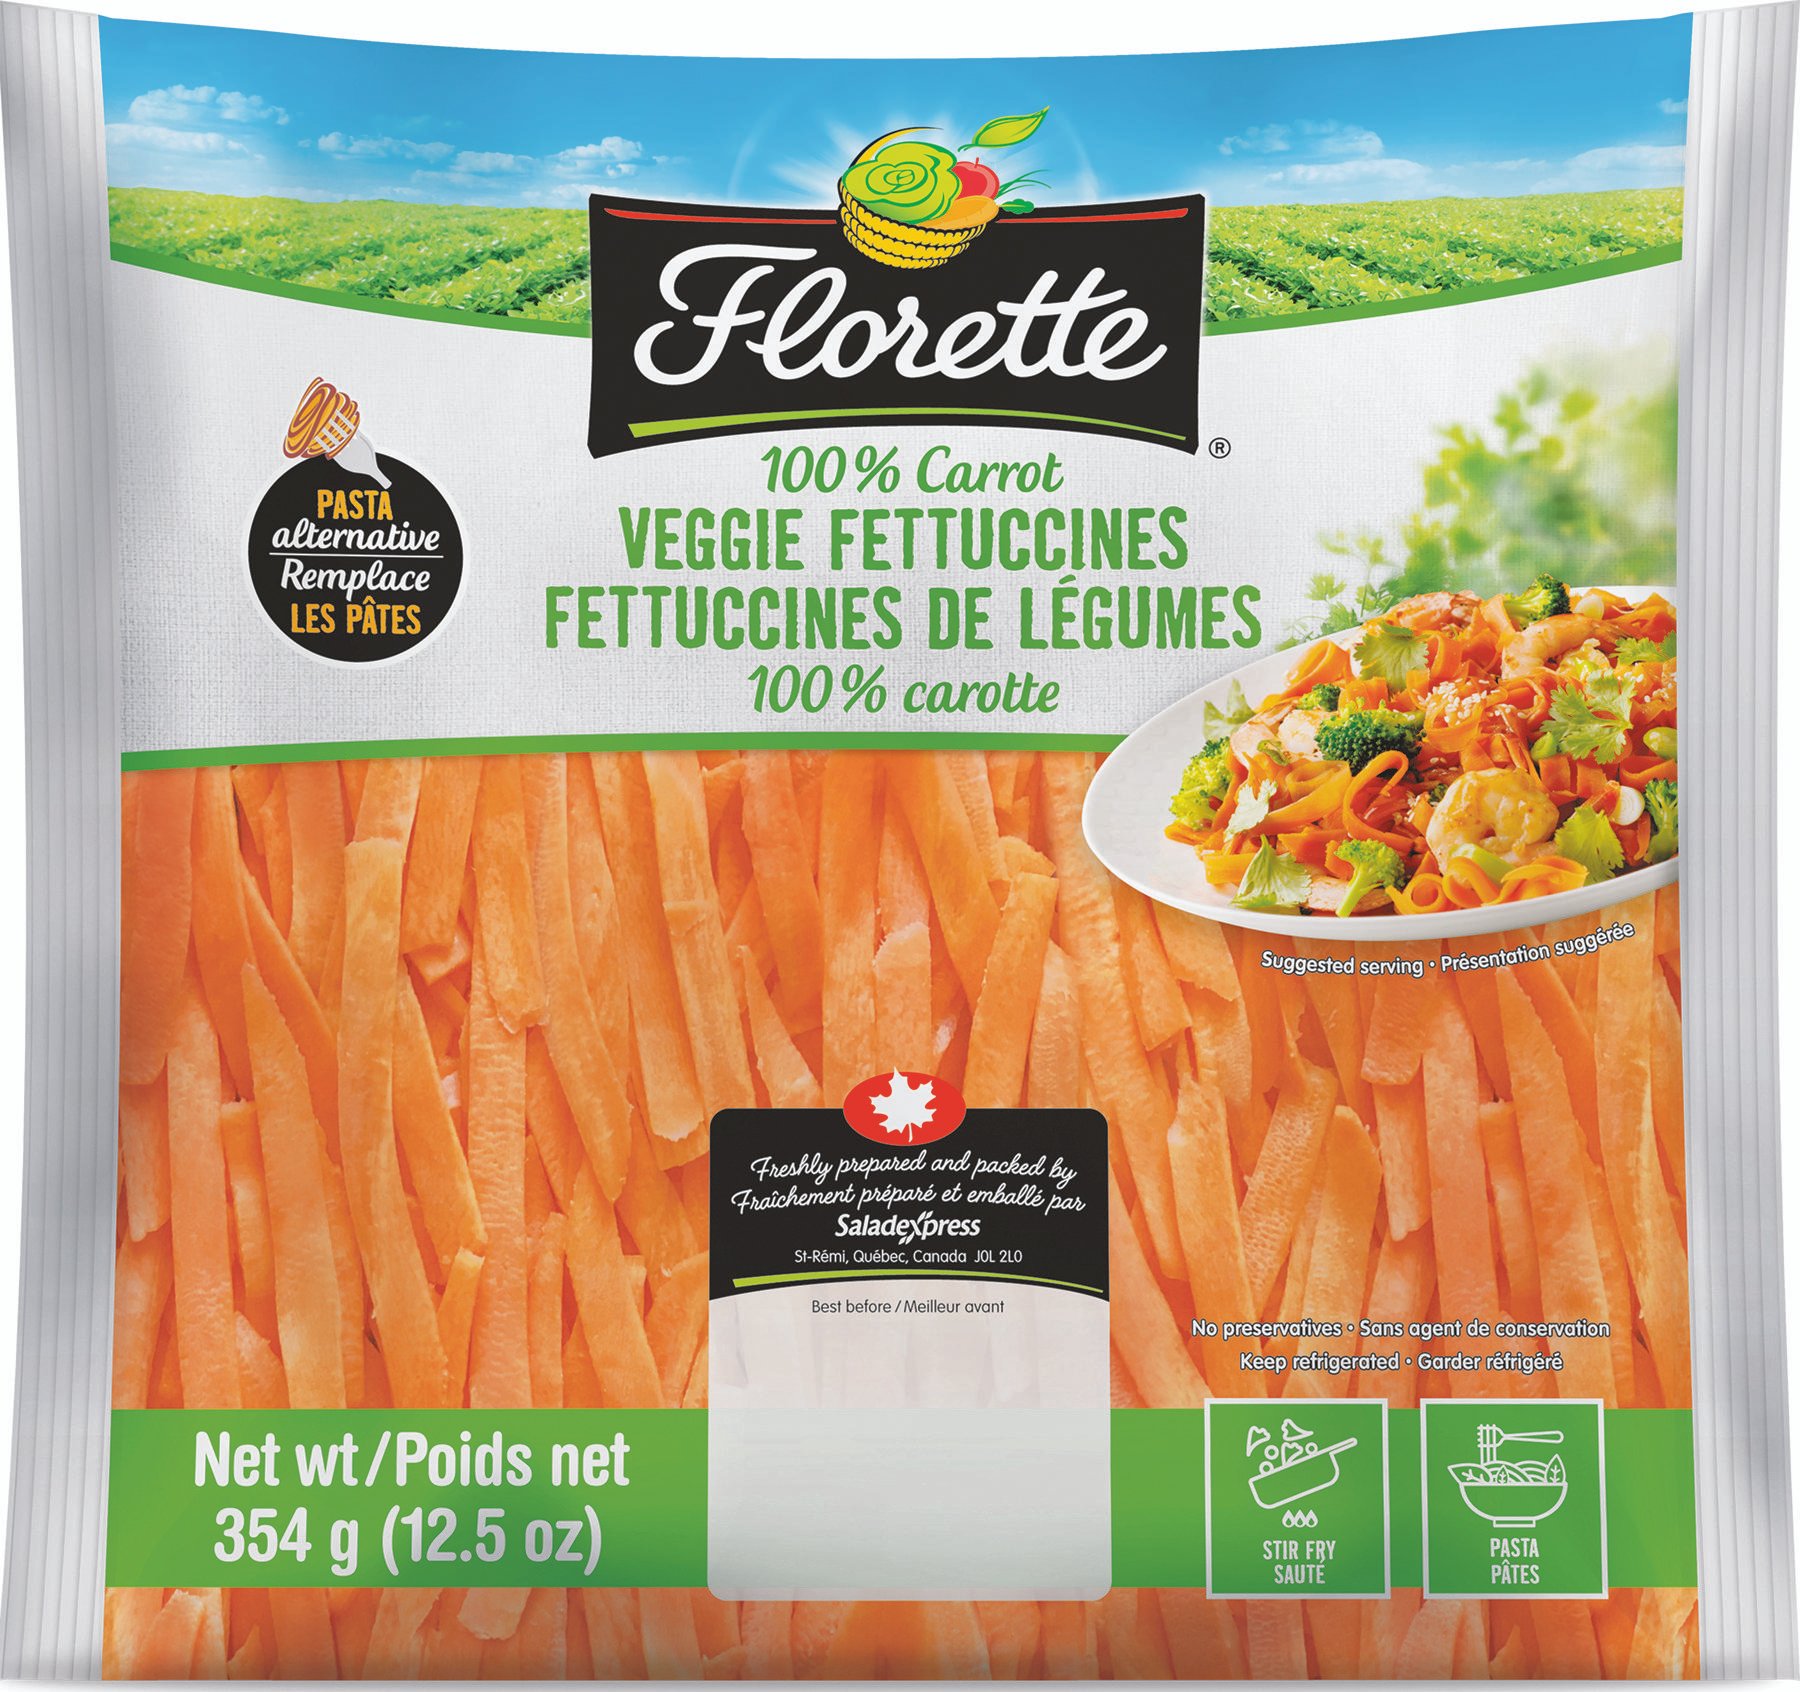
Florette Carrot Veggie Fettuccines are an easy option for consumers seeking to add more vegetables to their diets. Photo courtesy of Florette
While sales of value-added fruit remain flat, sales of value-added vegetables increased 6.6% in dollars and 6.7% in pounds. Organic produce remains the largest organic food category, up 5.6% in 2018 to $17.4 billion (OTA 2019).
Ranch, followed by “other Italian,” Caesar, vinaigrette, Thousand Island, and blue cheese are Americans’ favorite salad dressings; watch for more ethnic flavored dressings (e.g., tzatziki) (Datassential 2018).
Chia, kamut, sorghum, and flaxseed grew more than 50% on menus over the past four years; quinoa was up 33% (Datassential 2018).
Dining by Daypart
Eighty-five percent of young adults aged 18–35 and 92% of teens ate lunch on a typical weekday last year (Ypulse 2018).
Sales of retail fresh prepared refrigerated lunches reached $2.5 billion in 2018. For Y/E March 24, 2019, sales of prepared salads topped $1.8 billion; prepared sandwich sales were $1.7 billion; and deli soup sales were $227 million. Sales of hot sandwiches rose 11% (Dubois et al. 2019a).
Sandwiches top the list of offerings deli managers plan on expanding this year, with 43% planning to do so. Also slated for expansion by deli mangers are catering, side dishes, lunches, dinners, hot/cold bars, daily specials, rotisserie programs, breakfasts, and soup stations (Dudlicek 2019).
Six in 10 consumers order deli sandwiches during a typical month; 56% order subs/heroes; and 53% order wraps. Other popular options are salad sandwiches, mini sandwiches, panini, flatbread sandwiches, and ethnic sandwiches (Technomic 2018c).
The traditional lunchbox staple, peanut butter and jelly, was also the sandwich consumers most often consumed at home last year, followed by ham, turkey, and grilled cheese (NPD 2018). Brioche, naan, and Cuban breads have been among the fastest-growing sandwich carriers on restaurant menus over the past four years (Datassential 2018).
Deli presliced cheese reached nearly $9.9 billion in sales, up 9.9% for Y/E March 24, 2019; presliced meat sales were $3.0 billion, up 7.1%; and specialty cheese sales topped $2.9 billion, up 7.1% (Dubois et al. 2019a).
Sales of refrigerated meat/cheese/ cracker/dessert snack kits grew 8.5% in 2018 and 6.5% in 2019 for Y/E May 18, 2019 (Lyons Wyatt 2019a).
Two-thirds of consumers like to order dessert when eating out (Culinary Visions 2019). Fresh bakery is having a banner year, with dollar sales up 14% and pounds up 8.8% for Y/E March 31, 2019 (Lyons Wyatt 2019b).
In descending order, cookies, breads, cakes/tortes, doughnuts, rolls, celebration cakes, cupcakes, and pies are the best-sellers in the in-store bakery (ABA 2019).
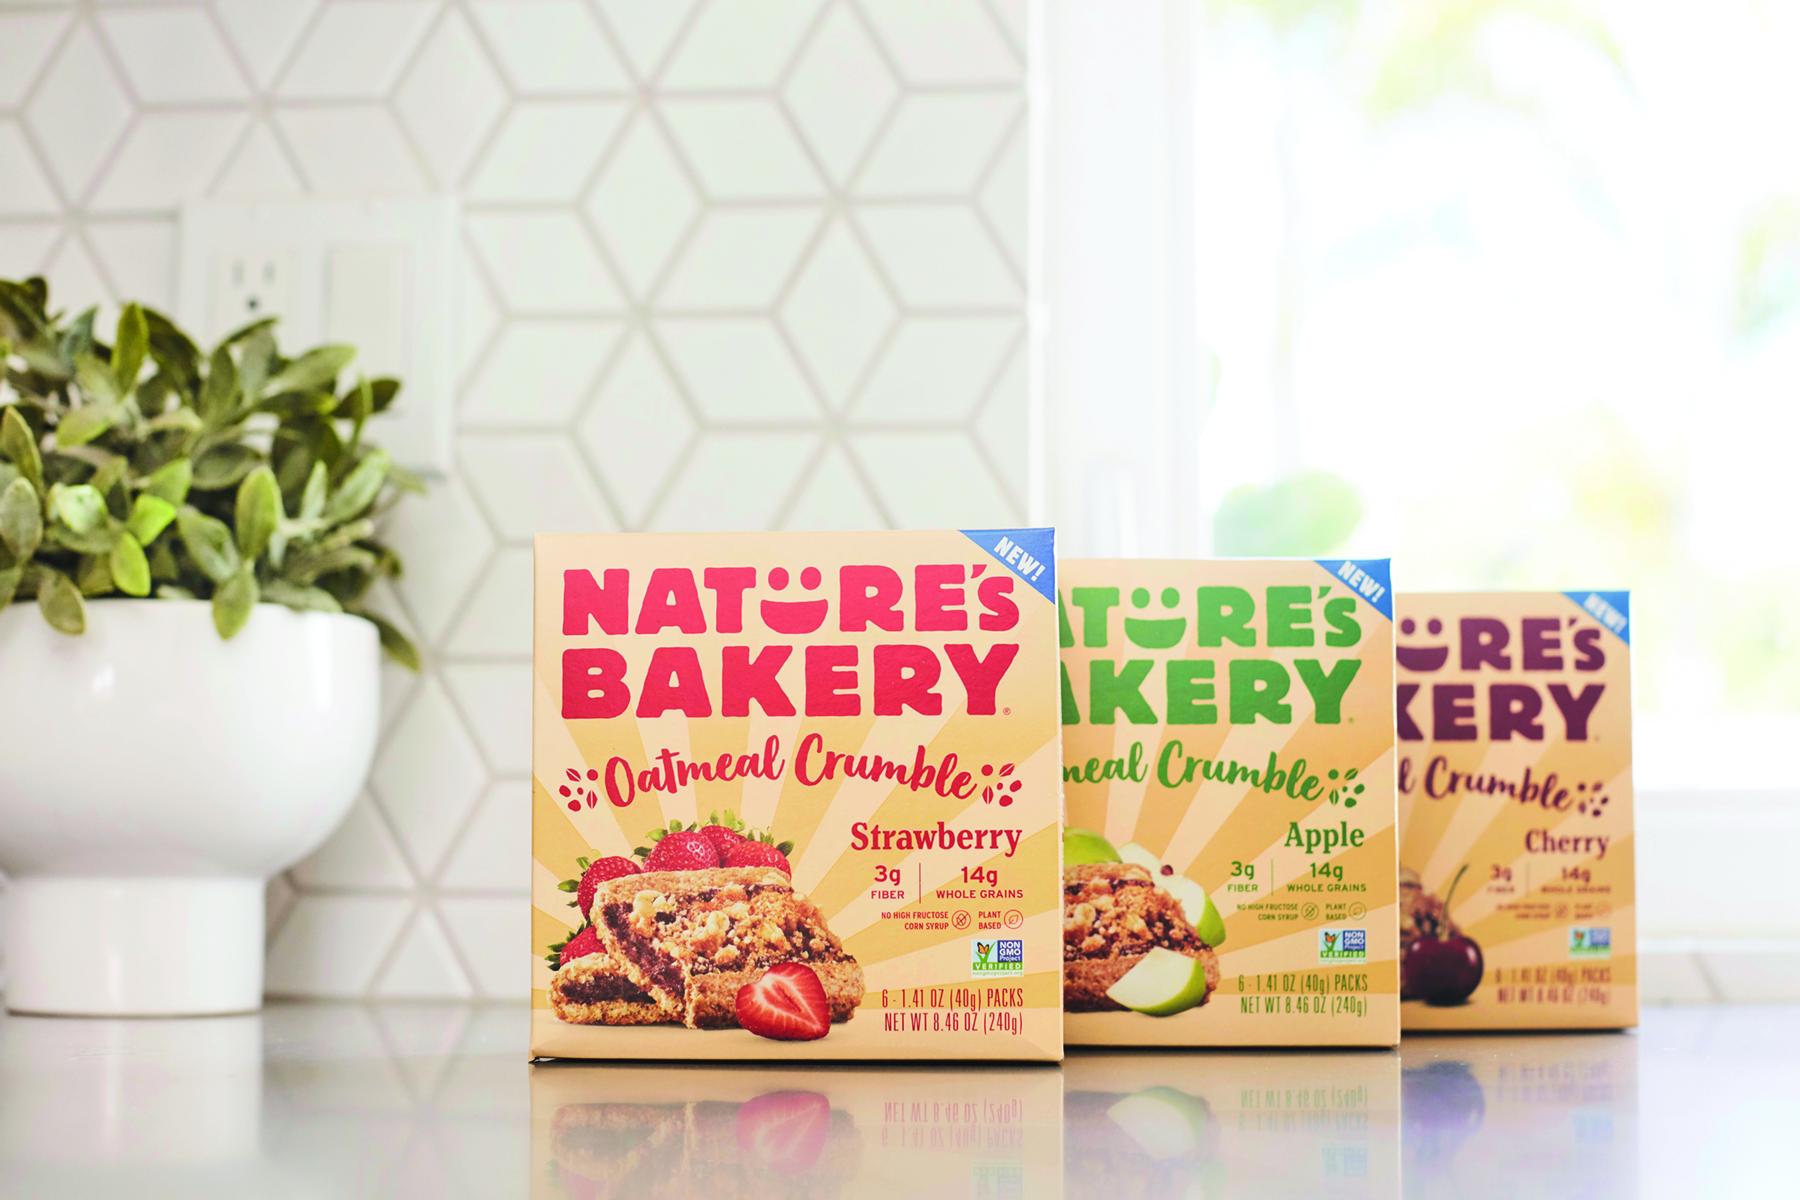
Soft-baked Oatmeal Crumble Bars from Nature’s Bakery contain 14 grams of whole grains and offer a potential breakfast option for breakfast skippers. Photo courtesy of Nature’s Bakery
Eight in 10 operators of in-store bakeries sell gluten-free bakery products; nut-free and egg-free bakery products are also on the rise (Martin 2019).
Within the center-store bakery aisle, dessert brownies, croissants, artisan/ other bread, pastry crust/shells, sweet dessert bars, and tortilla shells were the fastest-growing categories (ABA 2019).
Nibbling …
Nearly half (47%) of adults eat more than three snacks per day. Two-thirds snack in the afternoon, 57% in the evening, 40% in the late evening, 36% at midmorning, and 26% in the early morning (Lyons Wyatt 2019a).
Snacks that are both healthy and indulgent drove growth last year, with sales up 3.9%, followed by traditional indulgent snacks, +2.9%; seriously healthy snacks, +1.6%; and treats, +1.2% (Lyons Wyatt 2019a).
Salty snack sales rose 4.9% to $24.9 billion for Y/E May 19, 2019; potato chips remain the largest category. Sales of pork rinds grew 17%; puffed cheese snacks, +8.2%; other salty snacks, +8%; popcorn, +3.9%; tortilla chips, +3.8%; and corn snacks, +2.8%. Sales of ovenbaked chips and apple chips enjoyed strong gains (Peckenpaugh 2019).
Chocolate candy, other candy, cookies, chips, crackers, tortilla chips, snack nuts, frozen novelties, yogurt, and ice cream are the largest snack categories; only yogurt and ice cream did not post strong growth last year (Lyons Wyatt 2019a).
Two-thirds of adults want more snacks that provide an energy boost; 57% want snacks that contain vitamins/minerals; 50% seek snacks that provide a serving of fruits/vegetables; and onethird want organic snacks (Lyons Wyatt 2019a).
Plant-based snack foods and beverages are other fast-growing sectors. Chickpea salty snacks are projected to grow 35% in the next few years; sales of bean-based snacks are expected to grow by 25% (Lyons Wyatt 2019a).
Frozen novelties, snack/ granola bars, refrigerated olives/peppers/pimentos, frozen cooked foods, snack cakes, refrigerated peanut butter, eggs, fruit snacks, and refrigerated readyto- drink coffee have been posting the largest gains (Lyons Wyatt 2019a).
Sales of snack bars overall grew 2.4% to reach more than $6.3 billion for Y/E March 24, 2019. Granola bars posted a 4.5% sales decline to $1.6 billion (Reilly 2019).
Breakfast/cereal/snack bars grew 7.2% in sales to $1.4 billion; sales of private label bars grew by 26%; and sales of KIND bars shot up 44% (Reilly 2019). The total hot/cold cereal market reached $11 billion in 2018 and is projected to decline by a CAGR of 1.4% between 2018 and 2023 (Packaged Facts 2019c).
Two-thirds of adults frequently have a beverage as a snack (Lyons Wyatt 2019a). Three-quarters of Millennials, 63% of Gen X, and 58% of Boomers say they always have a beverage close at hand. Millennials regularly consume products from 10 beverage categories, Gen Xers consume products from 8.3 beverage categories, and Boomers consume products from 7.1 categories (Hartman 2019b).
Half of all drinking occasions are alone. Categorized by need state, 51% are for refreshment, 50% are for energy, 48% are considered fuel/fill, 47% are for health, and 45% are for pleasure/indulgence (Hartman 2019b)
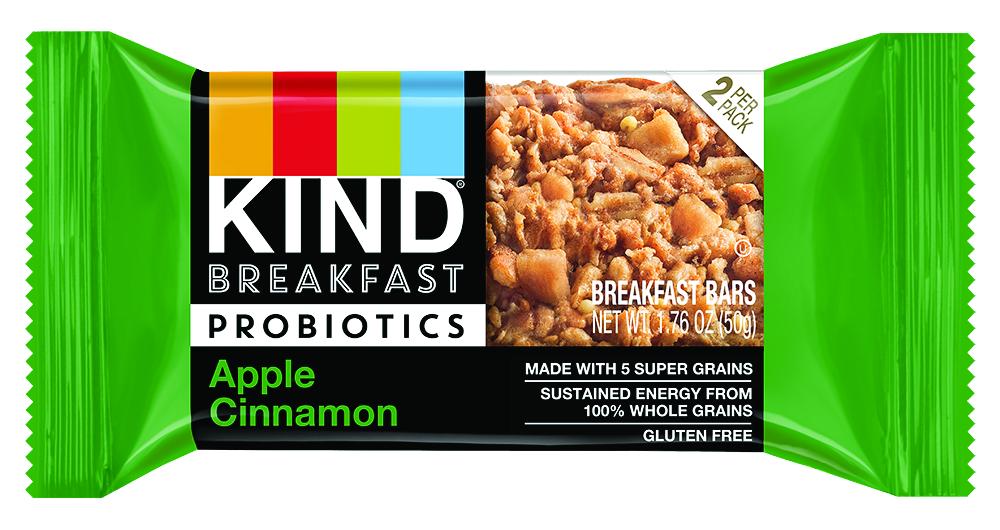
Gluten-free KIND Breakfast Bars are made with 100% whole grains and contain 500 million CFU probiotic cultures per serving, the company says. Photo courtesy of KIND
Mostly due to its use in water, hibiscus is the fastest-growing beverage flavor at lunch and dinner, up 32% over the past two years. It is followed by Mexican flavors, up 17%; honey, +14%; lemon, +13%; cucumber, +12%; watermelon, +8%; and pineapple and blueberry, each up 6% (Technomic 2019b).
Half of consumers are very concerned about the calories in their beverages, and 45% of consumers would like their drinks to do more for them (e.g., provide energy, nutrients, or other benefits) (Hartman 2019a).
Healthy Aspirations
Nearly half of consumers say their diet could be somewhat healthier; 23% say it could be a lot healthier (FMI 2019b). Four in 10 closely monitor what they eat, 43% try to eat healthy but don’t pay close attention, and 9% claim to be on a strict diet (Datassential 2019).
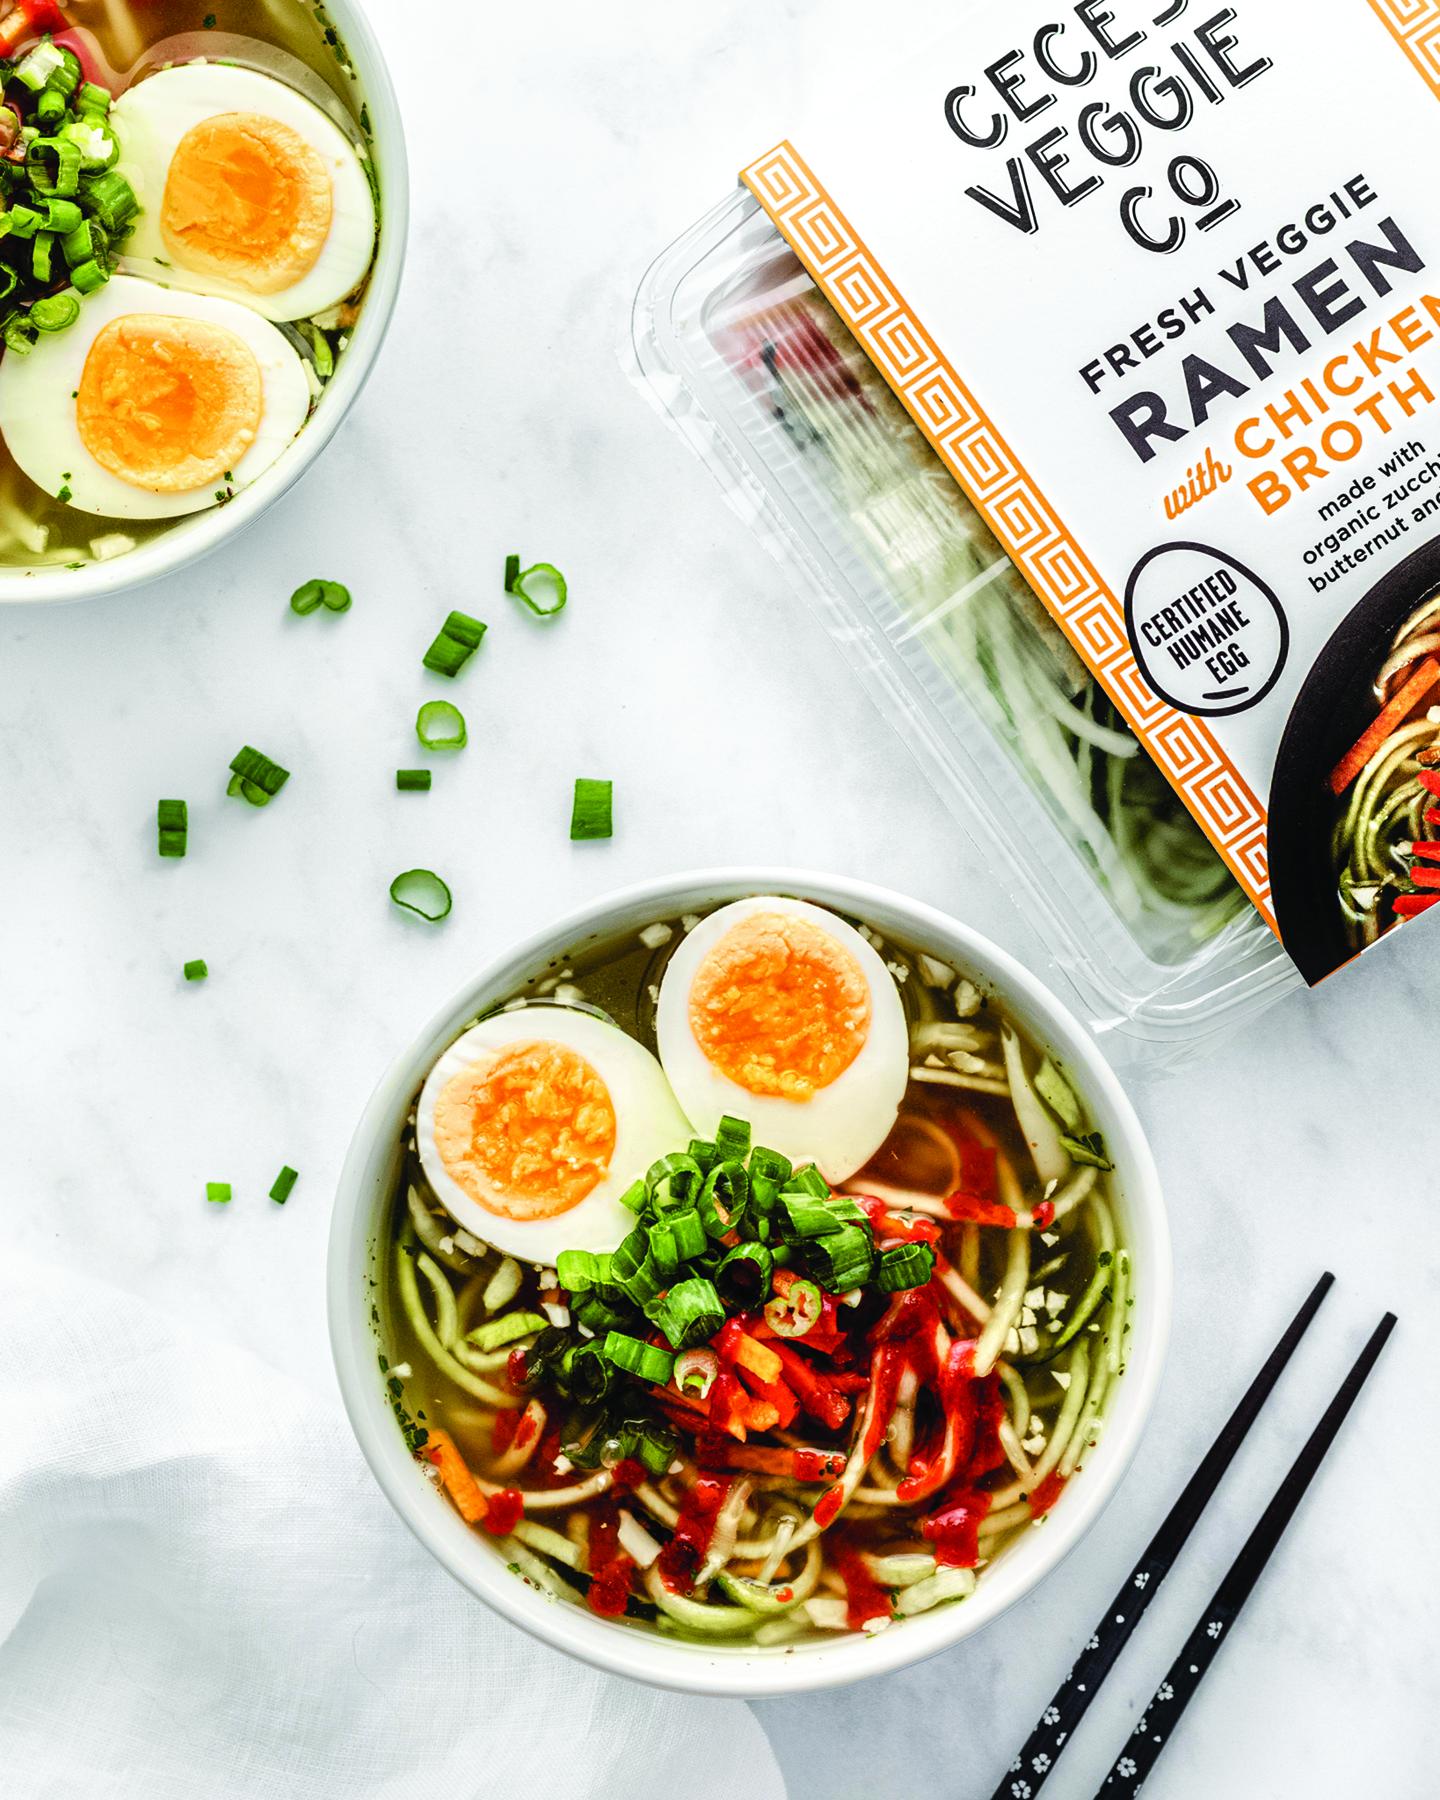
Cece’s Veggie Co. takes ramen well beyond the traditional shelf-stable pack of noodles with its new Fresh Veggie Ramen in two varieties, including this one, which blends chicken broth, ramen noodles made from zucchini, and a boiled, organic, free-range egg. Photo courtesy of Cece’s Veggie Co.
Three-quarters of consumers say they’re trying to include more vegetables; 71% want to eat more fruit; 53%, more nuts/seeds; 48%, more fish; and 44%, more beans, lentils/legumes (Datassential 2019).
Sixty-two percent are adding more fiber to their diet; 60%, more protein; 59%, more vitamin D; 56%, more calcium; 55%, more whole grains; 51%, more olive oil; and 47%, more antioxidants (Hartman 2019a).
Sales of foods/drinks with a protein claim grew 9%. Sales of products with a protein plus no hormones claim were up 15%, the same growth as products with a protein plus no preservatives claim. Other claims and the sales growth associated with them include the following: protein plus a non-GMO claim, +21%; protein plus whole grains, +27; protein plus no antibiotics, +41%; and protein plus probiotics, +69% (Dubois et al. 2019b).
Over two-thirds of grocery shoppers look for avoidance claims on food packages; leading avoidance claims are about sugar, sodium, and no homones/ antibiotics. Six in 10 consumers look for minimal processing claims, of which no artificial ingredients/preservatives and non-GMOs are most important. Free-range and grass-fed are the most sought-after ethical claims on foods (FMI 2019b).
Heart health has fallen to fourth place as the benefit consumers are most often trying to get from foods; weight management, followed by energy, and digestive benefits, now top the list (IFIC 2019).
Although nearly six in 10 consumers say they’re eating more plant-based foods than two years ago, consumption of fruits/vegetables and meat have not changed accordingly (USDA 2019; HealthFocus 2019).
Those under age 39, those with kids in the household, women, Asians, and those of upper income and higher levels of education are most likely to say they’re eating more plant-based foods (HealthFocus 2019).
Half of adults (50%) have tried a new diet or eating approach in the past year, up from 40% in 2017 (Hartman 2019a). Among the 50% who have experimented with a diet/eating plan during the past year, 12% have tried a low-carbohydrate regimen; 9% each have tried a dairy-free/lactose-free diet, intermittent fasting, or a glutenfree plan; 8%, the Mediterranean diet; 7%, the Whole30 diet or a juice/detox cleanse; 6%, Weight Watchers; and 5% each, the elimination, ketogenic, or paleo diet (Hartman 2019a).
But what is different from previous dieting behaviors is that only 3% of those who tried a diet stayed on a specific diet/eating plan exclusively. Nearly two-thirds of adults are simply “not interested” in the keto, paleo, Whole30, or Atkin’s diet (Datassential 2019).
R E F E R E N C E S
ABA. 2019. The Power of Bakery. American Bakers Assoc., Washington, D.C. americanbakers.org.
AFFI. 2019. The Power of Frozen. American Frozen Food Institute, Arlington, Va. affi.org.
Beyond Meat. 2019. Investor Prospectus 2019. Nov.21.
Culinary Visions. 2019. Global Indulgence Survey. Culinary Visions Panel, Chicago. culinaryvisions.org.
Datassential. 2018. Datassential’s Menu Adoption Cycle Projections. Aug. Datassential, Los Angeles. datassential.com.
Datassential. 2019. The New Healthy. June.
Dubois, C., J. Parker, and P. Swanson. 2019a. “The State of Deli & Prepared Foods.” Top Trends in Fresh— Webinar Series. June. Information Resources Inc., Chicago. iriworldwide.com.
Dubois, C., J. Parker, and P. Swanson. 2019b. “The State of Meat 2019.” Top Trends in Fresh—Webinar Series. April. Information Resources Inc.
Dudlicek, J. 2019. “2019 Retail Deli Review: When It Comes to Grocery Sales, Deli Continues to Deliver. Progressive Grocer, May 30. progressivegrocer.com.
FMI. 2019a. The Power of Foodservice at Retail. Food Marketing Institute, Arlington, Va. fmi.org.
FMI. 2019b. U.S. Grocery Shopper Trends 2019.
FMI. 2019c. The Power of Meat.
FMI. 2019d. The Power of Produce.
Hartman. 2018a. Compass Database. The Hartman Group, Bellevue, Wash. hartman-group.com
Hartman. 2018b. Organic & Natural Report 2018.
Hartman. 2019a. Health + Wellness 2019: From Moderation to Mindfulness.
Hartman. 2019b. Modern Beverage Culture.
HealthFocus. 2019. U.S. Consumer Health Survey.
HealthFocus Intl., St. Petersburg, Fla. healthfocus. com.
IFIC. 2019. IFIC Food & Health Survey. International Food Information Council, Washington, D.C. foodinsight.com.
Johnson, G. 2019. “The Young & Trendy Aren’t Always Healthy Eaters. Fresh Trends Survey 2018.” The Packer.
Lyons Wyatt, S. 2019a. “How America Eats: The State of the Snack Food Industry.” IRI webinar, April 9. Information Resources Inc.
Lyons Wyatt, S., 2019b. “Stirring the U.S. Melting Pot for Growth.” IRI webinar, June 5. Information Resources Inc.
Lyons Wyatt, S. and J. Parker. 2019a. “Balancing the Cross-Aisle Pendulum. IRI’s 2019 Fresh Trends Educational Plan.” Webinar #4, Oct. 24. Information Resources Inc.
Lyons Wyatt, S. and J. Parker. 2019b. “Balancing the Consumer Pendulum.” Top Trends in Fresh Webinar Series. Webinar #1, March 15. Information Resources Inc.
Martin, K. 2019. “Bakery Review: In-Store Bakeries Still Play Vital Role in Grocers’ Freshness Image.” Progressive Grocer, July 3.
NFI. 2019. Top 10 List of Americans’ Favorite Seafood. National Fisheries Institute. Nov. seafoodsource. com.
NPD. 2018. National Eating Trends Survey. NPD Group, Port Washington, N.Y. npd.com.
NPD. 2019. “Quick Service Burger Buyers Mix It Up Between Plant-based and Beef.” Press Release, July 17.
NRA. 2019. The State-of-the-Restaurant Industry. National Restaurant Assoc., Washington, D.C. restaurant.org.
OTA. 2019. “U.S. organic sales break through $50 billion mark in 2018.” Press Release, May 17. ota.org.
Packaged Facts. 2019a. Eating Trends: Restaurant Use. Nov. Packaged Facts, Rockville, Md. packagedfacts. com.
Packaged Facts. 2019b. Eating Trends: Meat, Dairy, Vegetarian, and Vegan. Sept.
Packaged Facts. 2019c. U.S. Food Outlook 2019. Feb.
PBFA. 2019. “U.S. Plant-Based Retail Market Worth $4.5 Billion, Growing at 5X Total Food Sales.” Press release, July 12. plantbasedfoods.org.
Peckenpaugh, D. 2019. “State-of-the-Industry: Bakery 2019.” Snack Food & Wholesale Bakery, June 11. snackandbakery.com.
Reilly, M. 2019. “State of the Industry 2019: Bars Continue to Innovate.” Snack Food & Wholesale Bakery, June 1.
SFA. 2019. The State of the Specialty Food Industry. Specialty Food Assoc., New York, N.Y. specialtyfood. com.
Technomic. 2018a. Generational Consumer Trend Report. Technomic, Chicago. technomic.com.
Technomic. 2018b. The Ethnic Food and Beverage Consumer Trend Report.
Technomic. 2018c. The Consumer Sandwich Trend Report.
Technomic. 2019a. The Top 500 Chain Restaurant Advance Report.
Technomic. 2019b. The Consumer Flavor Trend Report.
USDA. 2019. Livestock & Meat Domestic Data. U.S. Department of Agriculture, Agricultural Research Service. Nov. 27. USDA-ARS.gov.
Ypulse. 2018. Food & Cooking Survey. March. Ypulse, New York, N.Y. ypulse.com.
Hero Image: 2018
Authors
-
A. Elizabeth Sloan President
A. Elizabeth Sloan, PhD, is CEO and president of consumer trends consultancy Sloan Trends Inc. and a longtime contributing editor of Food Technology magazine. A veteran of work in industry, media, and public relations, Sloan received a PhD in food science and technology from the University of Minnesota.
Categories
-
Food Business Trends
-
Foodservice
-
Food Health Nutrition
-
Consumer and Marketplace Trends
-
Food Categories
-
Snacks
-
Diet and Health
-
Food Technology Magazine