Roughly 40% of all food production is lost or wasted. Closing that gap is critical to addressing food insecurity. Yet even defining and consistently measuring the problem remains a challenge. In the first of a four-part series, we break down the basics.<br class="t-last-br" />
Facing the Food Waste Crisis

 Kelly Hensel
Food Technology Magazine
According to the United Nations Environment Programme (UNEP), household food waste—those random, expired, or spoiled items lurking in cabinets or deep within refrigerators—totals nearly 570 million tons every year—11% of global food production.
Add in 8% of food lost at or around harvest/slaughter, 14% that is lost en route to the retail market (e.g., in transit, storage, or processing), and 7% that is wasted at the retail and foodservice level, and the true scope of a massive, global problem comes into sharp focus: nearly 40% of all food produced never makes it into mouths that need it (Figure 1).
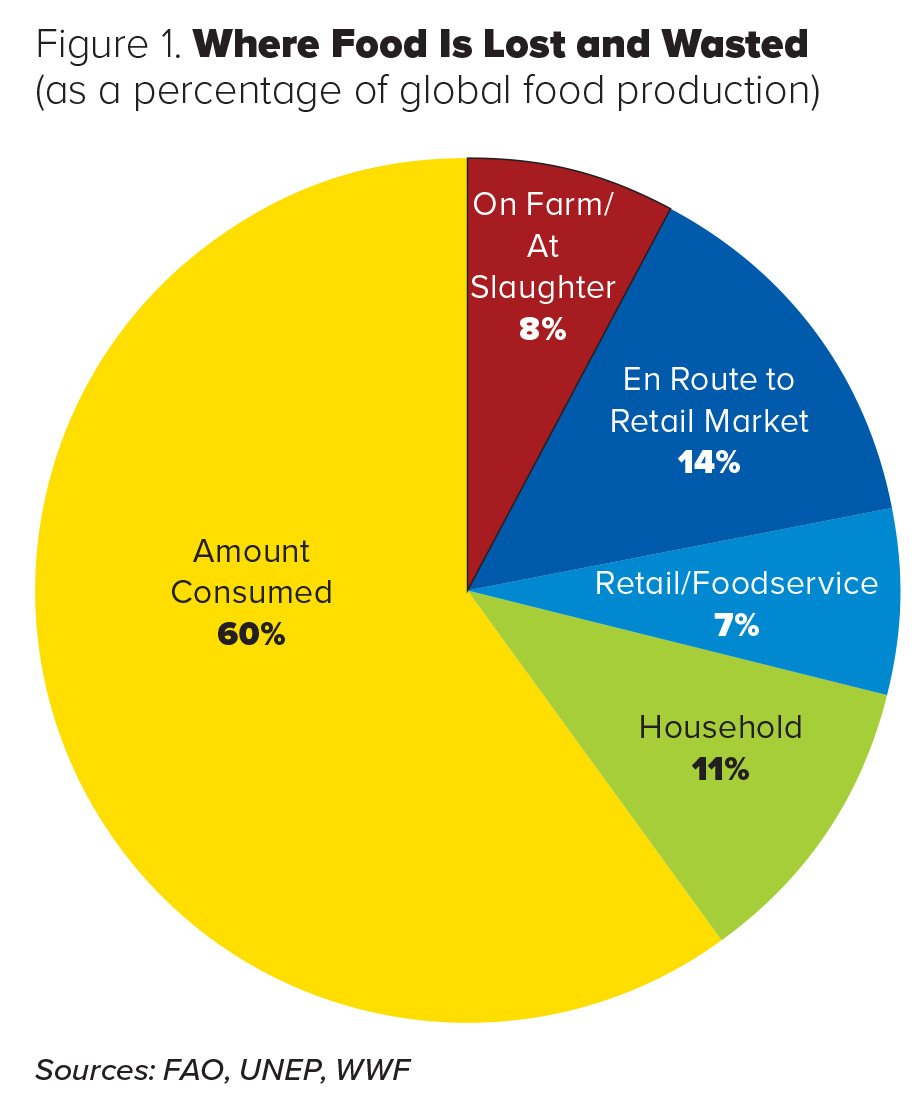
Figure 1. Where Food Is Lost and Wasted (as a percentage of global food production) Sources: FAO, UNEP, WWF
At the same time, “three billion people can’t afford a healthy meal,” said Ertharin Cousin, founder and CEO of impact investment fund Food Systems for the Future, during her keynote at IFT’s FIRST event last July. “And 250 million people are acutely hungry, living on the verge of starvation.”
While the global food system has succeeded in feeding a population that has exploded over the past 100-plus years—from 1.6 billion in 1900 to nearly 8 billion in 2020—the practices used to reach that milestone are no longer sustainable.
“It is a travesty that we lose or waste around a third of the food that is produced and at the same time, one in 10 people go to bed hungry every day,” says Liz Goodwin, senior fellow and director of Food Loss and Waste at World Resources Institute (WRI). “We must transform the food system to make it more sustainable so we can feed people with nutritious diets whilst living within planetary boundaries. Tackling food loss and waste is a key part of that.”
In 2022, Food Technology will explore various aspects of the problem—from the farm through processing to the consumer—through a series of in-depth articles that seek out expert opinions, highlight novel technologies, and present strategies and solutions. But solving any problem requires defining the scope and identifying the variables. What’s the difference between food loss and waste? What are the challenges that governments, businesses, and consumers face in reducing food loss and waste?
The Goal
In 2015, UN member states adopted the 2030 Agenda for Sustainable Development consisting of 17 Sustainable Development Goals (SDGs) to guide the transformation to a healthier population and a more sustainable planet. One of the goals (SDG 12.3) specifically targets cutting food waste at retail and consumer levels by 50% and reducing food losses across supply chains.
Progress toward SDG 12.3 is measured by two indicators—the Food Loss Index and the Food Waste Index—and helmed separately by the UN Food and Agriculture Organization (FAO) and UNEP, respectively. The measurement protocols for each differ in that the Food Loss Index determines the losses for the top 10 commodities by economic value for each country, while the Food Waste Index calculates total food waste by weight on a country-wide level (see Glossary sidebar).
The Current State
Food Loss. A broad estimate of food loss and waste prepared by the FAO in 2011 projected that about a third of the world’s food is lost or wasted every year. Data collected since 2011 have enabled experts to refine their calculations and revealed the problem to be even worse than previously estimated. The FAO’s first Food Loss Index estimate, published in The State of Food and Agriculture 2019 report, concluded that about 14% of the world’s food is lost between the farm/slaughter facility and the retail level. The amount lost varies across countries, ranging from as little as 5% in Australia and New Zealand to more than 20% in Central and Southern Asia (Figure 2).
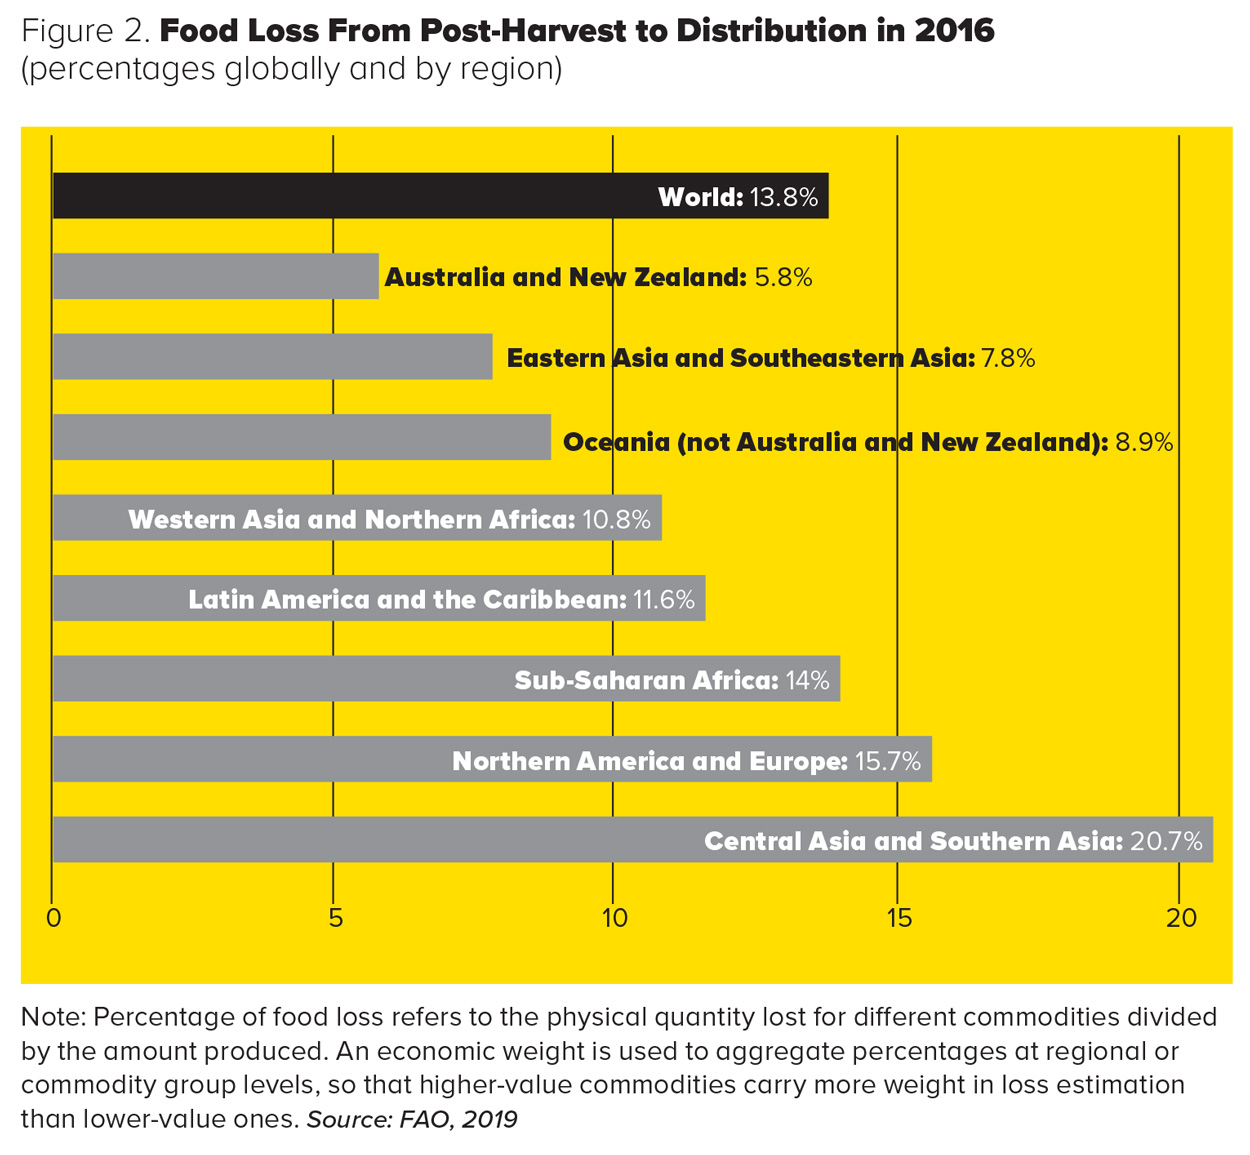
Figure 2. Food Loss From Post-Harvest to Distribution in 2016 (percentages globally and by region) Note: Percentage of food loss refers to the physical quantity lost for different commodities divided by the amount produced. An economic weight is used to aggregate percentages at regional or commodity group levels, so that higher-value commodities carry more weight in loss estimation than lower-value ones. Source: FAO, 2019
The Food Loss Index estimates are based on total harvest weight, and for that reason, food that remains unharvested due to various factors is not included in the Food Loss Index. To account for these harvest-associated losses (e.g., anything left in the field or at the slaughterhouse), the World Wide Fund for Nature (WWF) used farm-stage food loss and waste data points for different commodities and regions collected from online databases and literature reviews. It concluded that 8.3% of food is wasted at or around harvest/slaughter. One key finding from the report is that food lost at harvest/slaughter is a problem for all countries—not just low-income countries that might not have the technology and resources to reduce losses (see Myths Dispelled sidebar).
Food Waste. In its Food Waste Index Report 2021, the UNEP estimates that about 931 million tons of global food waste was generated in 2019, 61% of which came from households, 26% from foodservice, and 13% from retail. This suggests that 17% of total global food production may be wasted (11% in households, 5% in foodservice, and 2% in retail).
The most robust data set came from household food waste. Data for foodservice and retail sectors were much more limited, with the majority coming from high- income countries. While there is still not enough data to estimate food waste (on any level) for low-income countries, the range of household food waste for high- income, upper middle-income, and lower middle-income countries was much more similar than originally expected (Table 1).
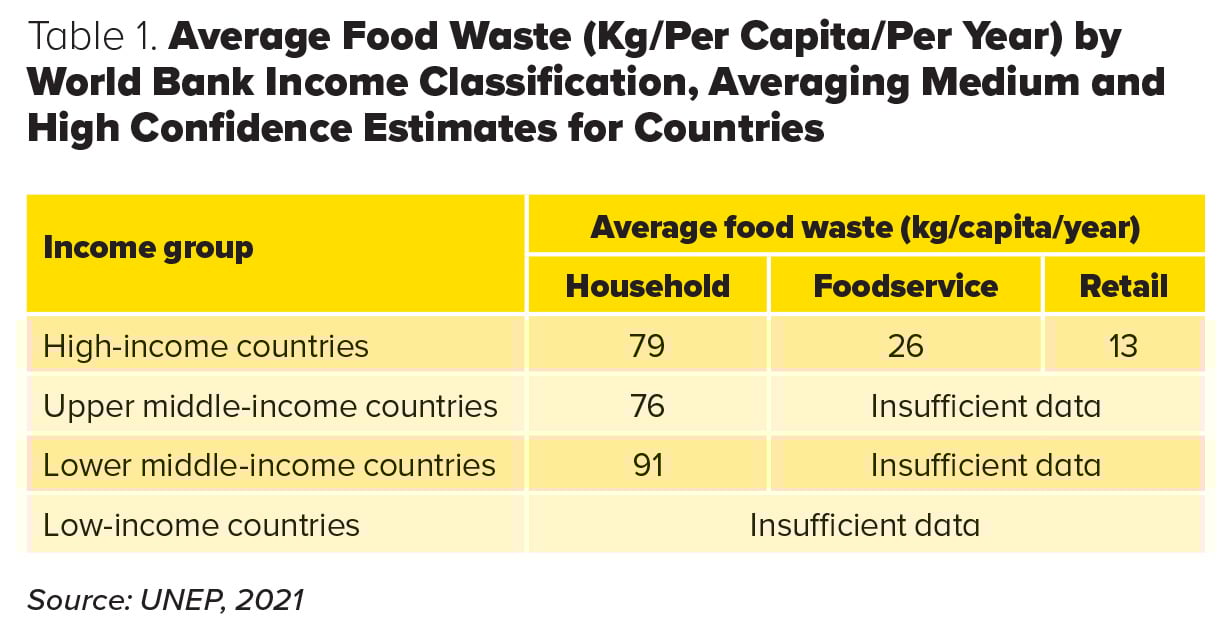
Table 1. Average Food Waste (Kg/Per Capita/Per Year) by World Bank Income Classification, Averaging Medium and High Confidence Estimates for Countries Source: UNEP, 2021
“Lower-income countries haven’t had an incentive to measure or reduce food waste until now, because the global narrative has been that household food waste is a ‘rich country problem,’” says Clementine O’Connor, program officer - Sustainable Food Systems at UNEP, and co-author of the Food Waste Index Report 2021. “And now we are beginning to recognize that things like lack of access to refrigeration or even things like consuming more of your meals at home means that you are going to create more household food waste.”
Measurement Is Key
It’s important to stress that all these estimates suffer from large gaps in data. “Globally, the state of food waste data availability is relatively poor,” says O’Connor. “It’s improving now quite rapidly, but we don’t yet have any time series data. So, we can’t say in the last 10 years, or in the last year, there is a trend upwards or downwards.”
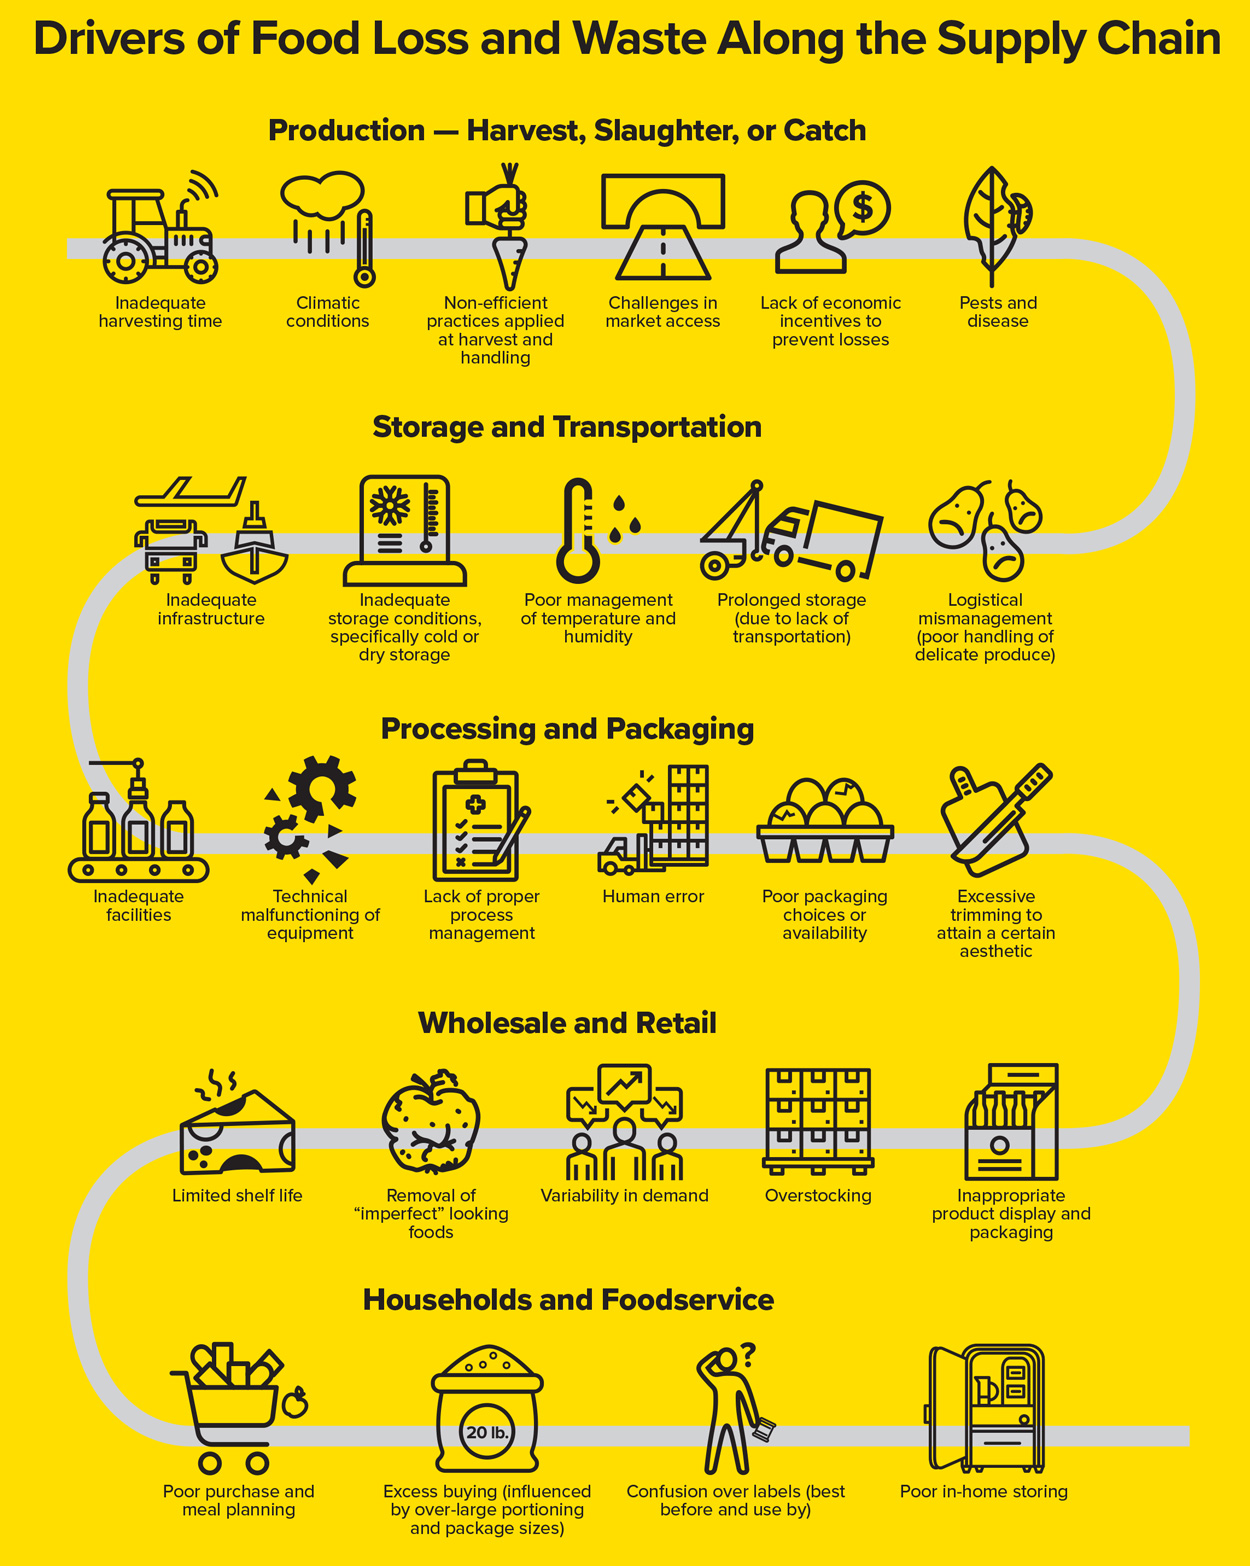
Drivers of Food Loss and Waste Along the Supply Chain
And that is why measurement is vital to reducing food loss and waste. “There’s a saying—you manage what you measure,” says Dana Gunders, executive director at ReFED, a nonprofit dedicated to ending food loss and waste across the U.S. food system.
“Lower-income countries haven’t had an incentive to measure or reduce food waste until now, because the global narrative has been that household food waste is a ‘rich country problem.”
To establish a baseline for the Food Waste Index, the UNEP developed a three-tiered modeling approach using both existing data points from studies measuring food waste inside member states where available, and extrapolations based on the estimates observed in other countries. For the Food Loss Index, the availability of the data on losses varied considerably from country to country, across the 10 commodities tracked, and along the food supply chain. Therefore, the Food Loss Index includes data provided by governments and data produced by nongovernmental organizations, academia, and other institutions.
To ensure the quality and consistency of data collected moving forward, both the UNEP and FAO have developed guidelines and methodologies to measure food loss and waste at the country level. By standardizing the reporting methods, the hope is to switch from modeled estimates to data that is reliable, transparent, and enables meaningful comparisons among countries and over time.
Progress Report
While the SDGs were agreed upon in 2015, in many ways, the journey to reducing food loss and waste has only begun. And with 2030 fast approaching, it begs the question: “Are we on track to meet the deadline?”
Experts at the FAO, UNEP, ReFED, and WRI have mixed opinions on how to answer this question. However, they all agree that to get there, countries and companies need to ramp up their efforts significantly.
“It’s a very ambitious goal,” states Gunders. “We need a huge acceleration in efforts around this to get anywhere near that.”
Shortly after the adoption of the SDGs, a coalition of executives from governments, businesses, international organizations, research institutions, farmer groups, and civil society formed Champions 12.3 to help convert it into reality. The group, through its 10x20x30 initiative, has succeeded in getting nearly 200 companies (retailers and producers) to publicly commit to a 50% reduction of food loss and waste within their supply chains. Many have already begun measuring their food loss and waste, and some have already taken action to achieve the 2030 goal.
“Companies are doing okay,” says WRI’s Goodwin. “They need to do far more, and they need to keep the momentum going, but you have a number of companies that are over halfway [to the goal] and a lot of the very big ones are making a lot of progress.”
Countries, on the other hand, have a long way to go. “I would say it’s too early to respond because most countries at this stage are collecting data for the first time,” notes O’Connor.
One beacon of hope is the United Kingdom. It is the first, and so far, only, G20 member to have reached the halfway mark in meeting the SDG target. The per capita reduction in wasted food in 2018 was 27% against its SDG 12.3 baseline (2007). “The UK is really the leading example because they quantified food waste a lot earlier, so they have more data across time, and having that early data created a case for actions for them,” explains O’Connor.
Despite the COVID-19 pandemic slowing efforts considerably, much progress has been made in the past two years. Publications such as the UNEP’s Food Waste Index Report 2021 and the World Bank’s Addressing Food Loss and Waste report have shed light on the truth about food loss and waste through rigorous data analysis and case studies.
In September 2021, the first-ever United Nations Food Systems Summit took place. As a part of the summit, nearly 60 Solution Clusters, each devoted to a specific aspect of the food system, developed actionable agendas and recommendations. The “Food Is Never Waste” Solution Cluster will support countries in developing a suite of context-specific interventions, ranging from policies and regulations to voluntary initiatives, to reduce their food loss and waste by 2030, building on any existing domestic programs.
What makes the goal so daunting is the sheer scope and complexity of the issue. “It’s a complex set of inefficiencies and design challenges that all happen to be leading to food being wasted,” explains ReFED’s Gunders. “There’s not just one solution because it’s not just one problem.”
“It’s such a diverse and complex area of work that you need stakeholders from a number of different backgrounds to effectively tackle the issues,” says Rosa Rolle, a senior enterprise development officer in FAO’s Nutrition and Food Systems Division. “You need the statisticians for measurement, the post-harvest experts, the plant physiologists, the pathologists, and the food scientists.
“To get us there, there is a need for action at all levels to apply coordinated and integrated evidence-based approaches that address food waste reduction, value addition, and circularity principles,” continues Rolle.
What’s Next?
In September 2021, the UNEP launched regional food waste working groups in Africa, Asia, and South America. “We’re working with 25 countries across those regions to train them in how to quantify and report on food waste, to develop food waste reduction strategies, and to share their experiences with other countries in the region,” says O’Connor. “The idea is to equip countries to report on food waste in the next reporting period, which is the end of 2022.” That’s when the UNEP will send out a questionnaire with the goal to report to the SDG global database by February 2023.
The agency is also working with Champions 12.3 on a “consumer playbook to explain how government, companies, cities, different restaurants, and different types of actors can create enabling conditions and set up the choice architecture that would help consumers to reduce their food waste,” explains O’Connor.
As called for by the European Green Deal’s new Farm to Fork Strategy, the European Commission will propose legally binding targets to reduce food waste across the European Union by the end of 2023. These targets will be defined against a baseline for European Union food waste levels set following the first European Union–wide monitoring of food waste levels.
On the food loss side, the FAO has made available online learning courses on the Food Loss Index and the guidelines for data collection, standard questionnaires, and training material. According to The State of Food and Agriculture 2019, the FAO plans to conduct a round of international training workshops and support data collection in several priority countries.
In the end, it is going to take everyone implementing small and large-scale changes to move the needle on food loss and waste. “It’s not hard to convince people this is a problem,” says Gunders. “Nobody wakes up in the morning wanting to waste food. No business designs their plans around wanting to waste it either.
“It’s a journey,” continues Gunders. “I think we all need to be on it, and we shouldn’t be too intimidated by a giant, ambitious goal. We need to start with what’s in front of us. And I do believe there are some pretty straightforward things we can do today to start making progress.”
Glossary
FOOD LOSS is the decrease in the quantity or quality of food resulting from decisions and actions by food suppliers in the chain, excluding retail, foodservice providers, and consumers.
FOOD WASTE is the decrease in the quantity or quality of food resulting from decisions and actions by retailers, foodservices, and consumers.
FOOD LOSS INDEX measures losses for the top 10 commodities by economic value within five commodity groups (cereals and pulses; fruits and vegetables; roots, tubers, and oil-bearing crops; animal products; fish and fish products) for each country and across the supply chain, from farm gate up to, but not including, food retail. The United Nations Food and Agriculture Organization is its custodian.
FOOD WASTE INDEX measures food waste at the retail and consumer level (households and foodservice) for each country. The index also allows countries to measure and report on food loss generated in manufacturing processes. The United Nations Environment Programme is its custodian.
FOOD SUPPLY CHAIN consists of the following segments: 1) agricultural production and harvest/slaughter/catch; 2) post-harvest/slaughter/catch operations; 3) storage; 4) transportation; 5) processing; 6) wholesale and retail; and 7) consumption by households and foodservices.
FOOD SYSTEM gathers all the elements (environment, people, inputs, processes, infrastructures, institutions, etc.) and activities that relate to the production, processing, distribution, preparation, and consumption of food along with the outputs of these activities, including socioeconomic and environmental outcomes.
Source: The State of Food and Agriculture 2019, FAO
Myths Dispelled
The latest reports on food loss and waste have helped to invalidate some assumptions that had previously guided action or inaction. The following are just a few of the myths countered by what the data corroborate:
Myth: Food loss on farms is largely an issue in less affluent regions with lower levels of industrialization.
Fact: Per capita farm-stage waste levels are generally higher in more affluent regions. Despite having more on-farm mechanization, high- and middle-income countries of Europe, North America, and industrialized Asia, with only 37% of the global population, contribute 58% of global harvest waste (368 million tons).
Myth: Food loss mainly occurs in developing countries due to lack of infrastructure.
Fact: Losses occur in developed countries as well due to aesthetic requirements, labor shortages, and supply chain inefficiencies.
Myth: Household food waste is mainly a problem for developed countries with higher incomes.
Fact: Household food waste per capita is very similar across regions and across country income. Compare high-income countries with household food waste of 79 kg per capita per year with the 91 kg per capita per year of food waste from lower middle-income countries.
Digital Exclusive: How can reducing food loss and waste result in increased food security and a healthier planet? Read more about why reducing food loss and waste matters at iftexclusives.org/food-waste.
Stay Tuned
March 2022: Improving Agricultural Impact
July 2022: Mitigating Processing Inefficiencies
December 2022 / January 2023: Plugging Holes in the Supply and Distribution Chain
Hero Image: ©MassanPH/Moment/getty images
Authors
-
Kelly Hensel Deputy Managing Editor
Kelly Hensel, deputy managing editor, print and digital, leads Food Technology’s digital strategy and web-first publishing initiatives.
Categories
-
Food Waste
-
Sustainability
-
Food Security
-
Food Technology Magazine
