Ultrasonic Spectroscopy in Lipid Food Systems
Use of high-frequency, low-intensity sound waves is a promising new technique for developing, monitoring, and controlling production of high-quality fats for the food industry.
Ultrasonics can be defined as the study and application of sound waves using frequencies higher than those that the human ear can respond to (~16 kHz). Both low- and high-intensity ultrasonic technologies have found a myriad of applications in industry.
Low-intensity applications are those whose primary purpose is to transmit the energy through a medium without changing the state of the medium; i.e., the energy level is so low that the medium remains unchanged from its original state after the wave has passed through it. Propagation characteristics of the ultrasonic wave involve both the velocity of sound and attenuation. The elastic properties and density of a medium control the velocity of sound, while the mechanisms producing losses of energy control the attenuation.
Both velocity and attenuation can be measured by several methods. The method of choice will depend on the nature of the material, its environment, and the accuracy required. Among the different methods used are the interferometer, resonance, “sing-around,” pulse-superposition, and pulse-echo-overlap methods.
Among the low-intensity applications are measurement of gas and liquid flow, measurement of pressure and temperature in elastic materials, quality control inspections of metals and nonmetals, measurement of elastic properties, medical diagnosis, signal processing, and appliance controls such as television-channel selectors.
High-intensity applications are those that produce changes in the medium, or the contents of the medium, through which the waves propagate. Various mechanisms may be activated by the ultrasonic energy to promote the effects, but the mechanisms involved are not always known or understood. Most of the effects probably can be related to heating, stirring, cavitation, chemical effects, mechanical effects, electrolytic effects, diffusion, and vacuum effects and cleansing. The leading commercial high-intensity applications of ultrasonics are cleaning, plastic bonding, and soldering.
Low-Intensity Ultrasonics for Lipid Food Systems
Low-intensity ultrasonic techniques have found special application in the area of fats and oils. Pulse-echo techniques have been applied to the determination of triglyceride composition, dynamic rheology, solid fat content (SFC) of partially crystalline fats, and the size and concentration of droplets in emulsions (Javanaud and Rahalkar, 1988; Gladwell et al., 1985; McClements and Povey, 1988).
Ultrasonic technology has gained the attention of several researchers during the past decade to meet the need for a simple, cheap, and accurate means of measuring SFC in lipid systems. SFC is a measure of the amount of fat crystallized at a particular temperature and is expressed in units of percent. SFC over a range of temperatures is a good indicator of a fat’s functional characteristics. By monitoring and controlling SFC via the relative content of saturated, monounsaturated, and polyunsaturated fatty acids, fats can be tailored to specific applications. SFC and chemical composition are excellent parameters that can be used to monitor and control production of high-quality fats for the food industry.
--- PAGE BREAK ---
The major contemporary methods of measuring SFC are dilatometry (AOCS, 1973), calorimetry (Walker and Bosin, 1971), and pulsed nuclear magnetic resonance, p-NMR (Waddington, 1986). However, both dilatometry and calorimetry techniques are considered indirect methods, and therefore the parameter measured is called solid fat index (Timms, 2005). These techniques are very time consuming and difficult to use for in-line (real-time) applications. p-NMR is a very sensitive and accurate technique used mainly to determine SFC in the margarine industry. Since it requires sampling an aliquot from the crystallizing material, an off-line measurement is obtained. In general, it is difficult to correlate the SFC measured using p-NMR with real-time events.
Margarines, shortenings, emulsions, and confections are examples of food products where precise control over SFC and chemical composition are essential to make products of consistently high and uniform quality.
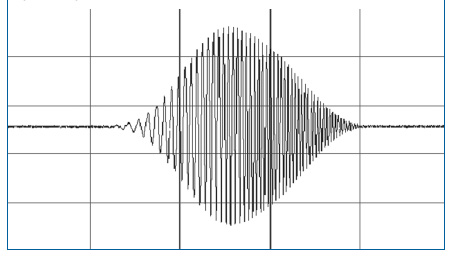
 Recent advances in ultrasonic spectroscopy as applied to fats and oils (Martini et al., 2005a, b, c, d) are creating new opportunities for food manufacturers to improve quality, reduce rework, and eliminate waste by installing real-time ultrasonic monitors in their production lines. This new methodology uses a chirp-shaped ultrasonic signal with a specific frequency range rather than a traditional pulse-echo signal. The chirp is an ultrasonic signal that has a specific duration (microseconds, depending on the application). The frequency, however, is not constant, being very low at the beginning of the signal and gradually increasing as the chirp is generated. Also, the amplitude of the chirp increases until a maximum is reached, then decreases, resulting in the typical wave shape shown in Figure 1. Compared to p-NMR techniques and previous ultrasonic techniques applied in lipid systems, ultrasonic spectroscopy offers high reproducibility, capability to make inline measurements, low attenuation through a wide path length, and capability to determine SFC values as high as 30%.

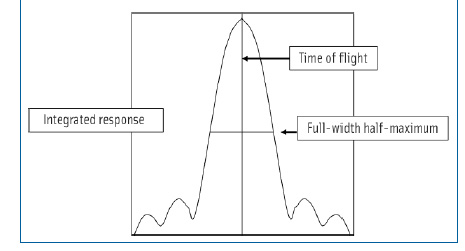
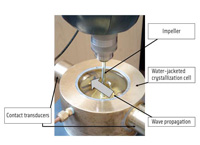
 This novel ultrasonic spectroscopy technology, called Omnis Ultrasonics, was developed by VN Instruments, Ltd., Elizabethtown, Ont., Canada (www.vninstruments.com) and commercialized by Fractec Research & Development Inc., Guelph, Ont., Canada (www.fractec.com), This technology is powerful and flexible and has an enormous dynamic range, as well as sophisticated and accurate measurement capabilities. The system takes care of all the complicated tasks associated with collecting and processing ultrasonic data by generating an integrated signal called synthetic impulse, SI (Figure 2). Two transducers are connected directly to the front of the system. One is used to transmit, the other to receive. No oscilloscopes or data-acquisition cards are needed. The system can be configured to transmit, receive, and analyze the ultrasonic signals. Figure 3 shows the setup used to optimize this technology. The SI generated by the ultrasonic spectrometer is characterized by three parameters (Martini et al. 2005a):
• Integrated response (IR) is a direct measurement of the attenuation of the ultrasonic signal and is measured as the area under the SI curve. The lower the IR value, the greater the attenuation. There are two main causes of attenuation of an ultrasonic signal. One is the scattering due to the presence of particles or bubbles, and the second is the absorption due to phase transitions, as in a solid–liquid transformation (Coupland and Saggin, 2003).
--- PAGE BREAK ---
• Time of flight (TF) is the time needed for an ultrasonic wave to get from one transducer to the other. Therefore, for a known path length, TF is a direct measure of the ultrasonic velocity.
• Full-width half-maximum (FWHM) is the width of the SI signal at half its amplitude and is an estimate of the time resolution of the system. The greater the FWHM value, the wider the SI peak and therefore the worse the resolution of the system. This parameter is determined almost entirely by the bandwidth of the transducers and the shape of the chirp used to drive them. In general, larger bandwidths (generated by transducers of higher frequencies) produce smaller FWHM values and therefore a better time resolution.
Inline, Real-Time Measurements
Recent collaborative work by the Dept. of Food Science at the University of Guelph, Rich Food Products, Fractec Research & Development, and VN Instruments has resulted in the following applications for ultrasonic spectroscopy (Martini et al., 2005d):
• SFC in Fat Systems. Ultrasonic technology has been found useful in measuring SFC in fat systems (McClements and Povey, 1988, 1992; Singh et al. 2002, 2004). Until recently, however, its utility has been limited to low SFC values (below 10%) and to very small amounts of crystallized fat (less than 1 cm of path length). However, most industrial applications require sensitivity beyond 10%, and for inline applications a longer pathway is needed. Ultrasonic spectroscopy has proven to be very accurate and sensitive in determining SFC through at least 8 cm of crystallized fat with up to 25% of SFC (Martini et al., 2005a). A linear relationship between ultrasonic velocity and SFC determined using p-NMR for different fat samples allows the determination of SFC of different systems by measuring the ultrasonic velocity of the system in real time. This is a promising new technique that enables inline process monitoring for SFC and is a valuable tool for product development.
• Emulsions. Ultrasonic spectroscopy has also been found useful for determining the SFC in emulsions up to 30% without any significant attenuation. Martini et al. (2005d) optimized this technology and found a linear relationship between velocity and SFC, with a coefficient value R2 of 0.95–0.98. This method is very useful for inline measurements even at high SFC values (up to 30%) for thick samples (8 cm). Martini et al. (2005b) were able to determine crystallization behavior in emulsions by analyzing the IR variation over time. They showed that attenuation of ultrasonic waves due to crystallization of fats depends not only on the amount of solid fat present in the system (SFC) but also on the crystal size and morphology of the network formed during crystallization.
• Aerated Emulsions. Ultrasonic spectroscopy was also used to measure the IR and ultrasonic velocity in foams. Because of the high air content of these systems, the ultrasonic transducers were placed 2 mm away from each other (instead of 8 cm as the case of bulk fats and emulsions). This new technology was capable of detecting the ideal whipping time of the aerated emulsions. However, further research is needed in this area to decrease the attenuation due to air and therefore increase the path length of the waves to apply the technology inline.
• Ultrasonic Velocity Variation with Chemical Composition. It is widely known that ultrasonic velocity in fats is a function of the chemical composition of the sample (McClements and Povey, 1988). Ultrasonic spectroscopy was used to measure the variation in ultrasonic velocity with chemical composition of fats and oils. As expected, measuring the ultrasonic velocity of oil allows, in principle, the determination of its chemical composition, in terms of saturated/unsaturated fatty acid content. This new technology can be used in a number of applications, from monitoring the hydrogenation process in a plant in real-time to predicting the crystallization behavior of oil without having to crystallize it.
Importance in Food Science
The ultrasonic spectroscopy technology described in this article is a valuable tool for the fats and oil industry and is an ideal complement to p-NMR. It has found application in a wide range of processes, including determination of SFC in real-time in bulk fats such as shortenings and in emulsions. It is very useful in monitoring the chemical composition of oil and measuring the ideal whipping time for whipped toppings. In addition, structural information regarding the crystallization process in emulsions can also be studied. The most significant advance offered by this technology is the potential to monitor material properties inline, in real-time, through large amounts of material without significant attenuation.
by Silvana Martini, Ph.D., a Professional Member of IFT, is Assistant Professor, Dept. of Nutrition and Food Sciences, Utah State University, Logan, UT 84322-8700 ([email protected]).
References
AOCS. 1973. Solid fat index dilatometric method Cd 10-57. In “Official Methods and Recommended Practices of the AOCS.” AOCS, Urbana, Ill.
Coupland, J.N. and Saggin, R. 2003. Ultrasonic sensing for the food industry, Adv. Food Nutr. Res. 42: 102-166.
Gladwell, N.R., Javanaud, C., Peers, K.E., and Rahalkar, R.R. 1985. Ultrasonic behavior of edible oils: Correlation with rheology J. Am. Oil Chem. Soc. 62: 1231-1236.
Javanaud, C. and Rahalkar, R.R. 1988. Velocity of sound in vegetable oils. Fat Sci. Technol. 90: 73-75.
Martini, S., Bertoli, C., Herrera, M.L., Neeson, I., and Marangoni, A.G. 2005a. In-situ monitoring of solid fat content by means of p-NMR and ultrasonics. J. Am. Oil Chem. Soc. 82: 305-312.
Martini, S., Bertoli, C., Herrera, M.L., Neeson, I., and Marangoni, A.G. 2005b. Attenuation of ultrasonic waves: Influence of microstructure and solid fat content. J. Am. Oil Chem. Soc. 82: 319-328.
Martini, S., Herrera, M.L., and Marangoni, A.G. 2005c. New technologies to determine solid fat content on-line. J. Am. Oil Chem. Soc. 82: 313-317.
Martini, S., Piatko, M., Bernet, S., and Marangoni A.G. 2005d. ultrasonic technology applied to edible fats and emulsions. Inform 16: 462-464.
McClements, D.J. and Povey, J.W. 1988. Ultrasonic velocity measurements in some liquid triglycerides and vegetable oils. J. Am. Oil Chem. Soc. 65: 1787-1790.
McClements, D.J. and Povey, J.W. 1992. Ultrasonic analysis of edible fats and oils. Ultrasonics 30: 383-388.
Singh, A.P., McClements, D.J., and Marangoni, A.G. 2002. Comparison of ultrasonic and pulsed NMR techniques for determination of solid fat content. J. Am. Oil Chem. Soc. 79: 431-437.
Singh, A.P., McClements, D.J., and Marangoni, A.G. 2004. Solid fat content determination by ultrasonic velocimetry. Food Res. Intl. 37: 545-555.
Timms, R.E. 2005. SFI or SFC? Why the difference? Inform 16(2): 74-75.
Walker, R.C. and Bosin, W.A. 1971. Comparison of SFI, DSC and NMR methods for determining solid-liquid ratios in fats. J. Am. Oil Chem. Soc. 48: 50-53.
Waddington, D. 1986. Applications of wide-line NMR in the oils and fats industry. In “Analysis of Oils and Fats,” ed. R.J. Hamilton and J.B. Rossel, pp. 341-400. Elsevier Applied Science Publishers Ltd., Essex, England.
