
The Top Ten Functional Food Trends
Specialty nutritional ingredients, the emergence of a health-oriented Hispanic market segment, and consumers’ ongoing interest in protein consumption are driving new opportunities for functional foods and drinks.

Meeting today's health and wellness food/beverage demands has evolved into a complex—often seemingly contradictory—process of delivering health benefits through a combination of core whole/real food nutritional value and added specialty health ingredients.
In 2013, "ingredients added for special health benefits" and "higher in nutrients" (e.g., whole grains, fiber), were the top two attributes that made a food product good for health and wellness, according to one research group (Hartman, 2013a).
Moreover, healthfulness is also now a reflection of a combination of attributes—fresh, real, avoidance of certain substances, inclusion of positives, high quality, close to the farm, and, for some, ethical practices or humane treatment. Wellness is seen as positive, shifting from illness, "have to," and treatment to vitality, "taking care," and fun/indulgence (Hartman, 2013a).
In 2013, 58% of consumers thought a lot about the healthfulness of their foods/beverages, 47% thought a lot about food ingredients, and 40% frequently turned their thoughts to food safety (IFIC, 2013a).
Eight in 10 adults made some effort to eat healthier last year, and one-third (34%) made a lot of effort—behavior patterns that are unchanged over the past six years (FMI, 2013).
Health influenced the food purchase decisions of 64% of consumers, up from 61% in 2012 (IFIC, 2013a). The combination of nutritional benefits, indulgence, and culinary/gourmet excitement is the key to consumers' decisions to try new healthy food products (IRI, 2014). With statistics like the preceding in mind, it's not surprising that seven out of the top 10 best-selling new U.S. foods/beverages introduced in 2013 had a healthier-for-you positioning (IRI, 2014).
Dannon's Light & Fit Greek yogurt, with first-year sales of $144.9 million, was the best-selling new food product of 2013, followed by Yoplait Greek 100 yogurt, $135.1 million; Kellogg's Special K Pastry Crisps snack bars, $100.6 million; Tostitos Cantina Tortilla Chips, $100.3 million; Bud Light Lime Lime-A-Rita, $97.4 million; Müller yogurt, $95.8 million; Eight O'Clock K Cups coffee, $89.8 million; Pepsi NEXT, $83.2 million; Kellogg's Special K Flatbread Breakfast Sandwiches, $77.9 million; and Atkins frozen meals, $74.0 million (IRI, 2014).
--- PAGE BREAK ---
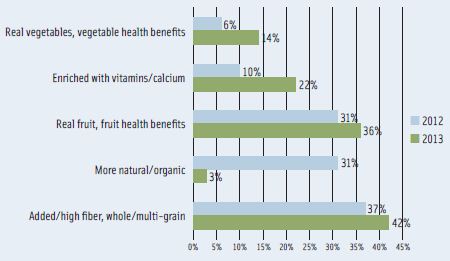
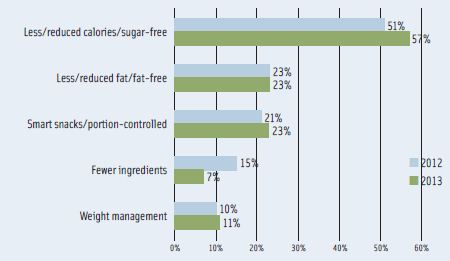
Less/reduced calories and sugar-free were the most frequent health claims touted by the best-selling new better-for-you foods/drinks in 2013 (IRI, 2014). For the first time, added fiber/whole grain, more natural/organic, and real fruit/fruit health benefits, outpaced reduced-fat and fortified nutrient claims (IRI, 2014). See Figure 1 and Figure 2 for a detailed view of how the health claims compare in 2012 and 2013.
The United States is the world's largest functional food market with sales of $43.9 billion in 2012, +6.9% over 2011 (NBJ, 2013a).
Six in 10 U.S. adults consume specially formulated functional foods/beverages at least occasionally. Yogurt for digestive health and cereal for heart health are the most-consumed items, followed by cholesterol-lowering butter/margarine, cholesterol-lowering orange juice, shakes/bars to reduce hunger, orange juice for joint health, immune-boosting dairy beverages, and medicinal teas (MSI, 2012a).
Beverages remain the largest U.S. functional product sector with sales of $27.8 billion in 2012, +9.8% vs 2011. Functional bread/grain posted sales of $6.4 billion, down 3.3%; packaged foods $3.6 billion, +1.4%; snack foods $3.5 billion, +11.7%; dairy $2.2 billion, +6.9%; condiments $172 million, +7.0%; and fruit/vegetables $45 million, +12.2% (NBJ, 2013a).
One in five adults cut back on their use of supplements because they are eating so many fortified foods; 88% regularly consume vitamin- or mineral-fortified foods (MSI, 2012b).
Globally, functional food/beverage sales topped $118 billion in 2012, up 5%. Japan is the second-largest functional food/drink market with sales of $22 billion, +4.4%, followed by the United Kingdom with sales of $8.08 billion and Germany at $6.4 billion (NBJ, 2013b).
With a fast-emerging middle class, more disposable income, and a greater number of working/more educated women in emerging markets, the worldwide potential for functional foods/beverages is unprecedented.
In 2013, China had the highest expenditure on health and wellness retail products, followed by Brazil, the United States, Russia, and Mexico (Euromonitor, 2014).
Globally, general well-being, weight management, digestive health, energy boosting, and endurance were the top five positionings for health/wellness in 2013; energy boosting, food intolerance, general well-being, digestive health, and beauty from within were the fastest-growing (Euromonitor, 2014).
Fortified/functional was the fastest-growing health/wellness food/beverage category worldwide, followed by naturally healthy, organic, and generally better-for-you products (Euromonitor, 2014).
Milk formula, energy drinks, probiotic yogurt, juice drinks, sports drinks, cereal, and biscuits were among the top-performing functional global health and wellness food categories in 2013 (Euromonitor, 2014).
What follows is a breakout of the year's top 10 trends driving the market for functional foods and beverages.
--- PAGE BREAK ---
 1. Specialty Nutritionals
As core supplement users continue to switch from supplements to fortified and functional foods, food marketers must keep pace with the growing demand for specialty nutritional ingredients. New/unique ingredients/formula claims have driven sales of the best-selling new supplements since 2012 (IRI, 2013a).
Specialty nutritional ingredients are now second only to vitamins in terms of consumers' nutrition priorities (MSI, 2011a). Nearly nine in 10 adults (86%) made a strong effort to consume more nutrients in 2012; 78% made an effort to consume more vitamins, 57% specialty nutritional ingredients, 55% minerals, and 45% herbs/botanicals (MSI, 2011a).
One-third (35%) of adults are making a strong effort to get more fish/oil/omega-3s; 27% say they're getting some omega-3s, but not enough to meet their needs (MSI, 2012b; IFIC, 2013b).
While awareness of fish oil is very high (73% in 2012), it has dropped 7% vs 2010; awareness of omega-3s fell 8% to 65%, but awareness of krill oil has grown from 17% to 27% (MSI, 2012b).
Four in 10 adults (38%) say they're getting some antioxidants, but not enough to yield a health benefit; 31% make that statement regarding probiotics (IFIC, 2013b).
With probiotic claims prohibited or under scrutiny around the world, marketers are relying on high vitamin C components (e.g., acerola in Danone's Actimel Powerfruit Yogurt) to support an immunity claim (Innova, 2014).
Prebiotics became a mass market opportunity in 2013 (Sloan, 2014). In 2012, 32% of consumers were aware of prebiotics, and 48% were aware of probiotics (MSI, 2012b). Maintaining a healthy digestive system and immune health were the top health linkages for prebiotics (IFIC, 2013a).
With more than 80% of the U.S. population likely deficient, and its critical roles in brain development in infants and toddlers, pregnancy, cognitive function, and liver health, choline is poised to explode onto the nutritional scene in 2014 (Sloan, 2014).
Resveratrol, carotenoids, and anthocyanins have joined polyphenols and flavonoids as mass market phytochemical opportunities. Lycopene and lutein remain highly marketable in specialty channels and among very health-conscious and condition-specific consumers (Sloan, 2014).
Pterostilbene, astaxanthin, olive extract, hydroxytyrosol, and zeaxanthin are among the up-and-coming, scientifically substantiated group of phytochemicals. However, they have yet to reach mass market status (Sloan, 2014).
Half (49%) of supplement users are aware of amino acids. Other supplements that at least some consumers are familiar with include glucosamine/chondroitin sulfate, melatonin, lycopene, lutein, plant sterols, whey protein, and co-enzyme Q10 (MSI, 2012b).
Supplement sales of spices and botanicals grew 5.5% to $5.6 billion in 2012 (NBJ, 2013a).Cranberry, garlic, and ginkgo are among the top sellers in mass channels; flaxseed oil, grass (wheat and barley), and turmeric/curcumin lead the list in natural products stores (ABC, 2014).
Four in 10 adults (43%) say they made a strong effort to get more vitamin D, 42% to get more calcium, 40% vitamin C, 34% B vitamins, 26% antioxidants, 25% vitamin E, 24% vitamin A, 21% iron, and 13% vitamin K (MSI, 2012a).
With the majority of Americans deficient in potassium and magnesium, delivering these nutrients in foods/beverages is a very big idea (USDA, 2010). Expect magnesium to be the next nutrient to help improve the bioavailability of foods/drinks that promote bone health. Bioavailability has been a strong and growing mass market opportunity for the past six years (Sloan, 2014).
Magnesium, potassium, chromium, choline, docosahexaenoic acid (DHA), eicosapentaenoic acid (EPA) arachidonic acid, fiber (viscous and fermentable), niacin, protein, stearic acid, vitamin B-6, vitamin E, and zinc are among the Institute of Medicine's high-priority nutrients.
--- PAGE BREAK ---
 2. Get Real
In 2012, the term real/100% real exploded into the marketplace, topping the list of health claims driving the best-selling new better-for-you foods/beverages (IRI, 2013a). Right after fresh and made from scratch, real is now the most appealing food descriptor (Mintel, 2013a).
Six in 10 consumers look for ingredients they recognize while shopping for food, 57% search for foods made with simple, real ingredients, and the same percentage seek food made with natural ingredients. In addition, 41% look for a shorter list of ingredients, and 33% want products made with local/seasonal ingredients (Hartman, 2013a).
Unprocessed/less processed is an important food attribute for over half of consumers (Technomic, 2012). Interest in minimally processed foods has grown by 8% since 2010.
Just over half (52%) look for foods absent of artificial ingredients; 50% want products without artificial sweeteners. Also high on the list of ingredients to avoid are high fructose corn syrup, artificial flavors/preservatives, MSG, artificial colors, and growth hormones (Hartman, 2013a).
In 2012, sales of natural foods reached $24.5 billion, +12.7%. Beverages were the largest natural category with sales of $5.9 billion, +10.5%; breads/grains $3.7 billion, +9.6%; packaged/prepared foods $3.9 billion, +9.4%; dairy $3.3 billion, +30.8%; fruits/vegetables $2.6 billion, +10.2%; meat, fish, poultry $2.4 billion, +13.9%; snack foods $1.7 billion, +9.8%; condiments $1.1 billion, +8.7% (NBJ, 2013c).
Organic food sales topped $26.3 billion in 2012. Fruit/vegetables were the largest category with sales of $9.7 billion, + 12.8%; dairy $4.4 billion, +7.0%; packaged/prepared foods $3.2 billion, + 9.9%; breads/grains $2.7 billion, +8.1%; snack foods $1.3 billion, +15.2%; condiments $920 million, +15.5%; and meat, fish, and poultry $820 million, +8.1% (NBJ, 2013c).
Sales of foods/drinks carrying a natural claim are projected to reach $39.1 billion by 2015; organic $39.4 billion (Packaged Facts, 2013a). Global natural and organic sales hit $116 billion in 2012, +10% vs 2011 (NBJ, 2013b).
Just over one-quarter (27%) of adults looked to organic foods/beverages to avoid genetically modified ingredients (GMOs) in 2013; 31% were regular organic users (Packaged Facts, 2013a). Under the U.S. Dept. of Agriculture certified definition of organic, foods and drinks must be GMO-free. Ironically, a slightly smaller portion of consumers believe that natural foods are also GMO-free, which may or may not be the case (Hartman, 2012a).
One in five consumers said they were very worried about GMOs in 2013; 26% were somewhat worried. Urban mothers in their 30s with young children under age 1 with a household income of $50,000 to $75,000 are the most concerned about GMOs (Packaged Facts, 2013a).
Sixty percent of consumers strongly like the idea of getting their nutrition from foods with naturally occurring health benefits vs 21% who like the idea of getting it from fortified products (IFIC, 2013b). Core users continue to cut back on their use of supplements because they believe the nutrients in whole foods are best (Hartman, 2012b).
Eight in 10 consumers prefer to get their whole grains from foods/drinks that naturally contain them; 73% have that approach to fiber, 72% protein, 62% antioxidants, 47% calcium, 44% omega fatty acids, 43% probiotics, and 41% vitamin D (Hartman, 2013a).
In 2012, the biggest gainers in U.S. supplement sales were food-based. Meal replacement supplements reached sales of $3.6 billion, +14.8%; whole food supplements $1.2 billion +12%. Fruit and vegetable supplements sales reached $97 million, +11.9% (NBJ, 2013a).
--- PAGE BREAK ---
 3. Hispanic Health
America's 52 million Hispanics represent an enormous and virtually untapped healthy food and beverage opportunity. In 2012, U.S. Hispanics spent $6.9 billion on functional foods, +7.7% vs 2011. They also spent $9.4 billion on natural/organic foods/drinks, +12.9%, and $2.4 billion on supplements, +7.6% (NBJ, 2013d).
Sixty-one percent of Hispanic women are trying to eat healthier; only 36% consider their diets very healthy (Mintel, 2013b). Forty-two percent of Hispanics are making a strong effort to consume nutrients—in descending order—vitamins C, D, and A, calcium, and potassium (MSI, 2011b).
Hispanics are uniquely focused on energy and performance. Half (53%) are making an effort to eat a nutritious diet or take nutritional supplements to improve physical performance/endurance; 50% seek to get an energy boost/enhancement (MSI, 2011b). Hispanics are the No. 1 users of energy drinks/shots, sports beverages, and 100% juice/juice drinks (Packaged Facts, 2013b).
Young Hispanic men represent an enormous untapped sports nutrition opportunity; 18% of men ages 18–24 and 12% of those ages 25–49 take a sports supplement (MSI, 2011b).
The median age of U.S. Hispanics is 10 years younger than the general population, and they are more likely to have children (U.S. Census, 2010). So it makes sense that Hispanic households are nearly three times more likely to use baby food, kids' cereal, and 100% juice (Nielsen, 2013).
Hispanics are the most likely group to buy nutritional products for their children (Mintel, 2013b). In 2012, there were 14 million Hispanic children in the United States (U.S. Census, 2012).
Those ages 50+ are driving growth in the Hispanic population, and that segment is projected to grow 63% from 2011 to 2021, creating a new condition-specific food/drink opportunity (MSI, 2011b). Hispanics are second only to seniors for use of meal supplements (e.g., Ensure); protein is their top reason for use (Packaged Facts, 2012a).
Backache, high cholesterol, heartburn, high blood pressure, acid reflux disease, overweight, and arthritis are the top doctor-diagnosed health conditions among Hispanics (Mintel, 2013b). Heart disease, cancer, stroke, and diabetes are the top causes of death among Hispanics; other significant conditions include asthma and liver disease (NCHS, 2012).
Four in 10 Hispanics (42%) are watching their diet for health reasons; 53% for weight, 31% cholesterol, 29% blood sugar levels, 20% high blood pressure, and 20% diabetes (Mintel, 2013b).
Hispanics are about twice as likely as the general population to spend whatever it takes to look younger. They're most often first to try a new health food, nutritional product, or diet (Packaged Facts, 2013c).
A positive mental state/mood and getting enough sleep are the most important elements of a healthy lifestyle for two-thirds of Hispanics, followed by exercising regularly, managing stress, and limiting processed foods (Mintel, 2013b).
Lastly, Hispanic women over index for use of functional foods/drinks to relieve symptoms of menopause, for anti-aging, to enhance appearance, and more (Packaged Facts, 2013c).
--- PAGE BREAK ---
 4. The Protein Evolution
The Food Technology 2012 report on functional food trends cited protein as a strong mega trend, and in 2014, the protein market is still center stage and diversifying into a powerful next generation of high potential health opportunities (Sloan, 2012).
In 2013, 57% of consumers made an effort to get more protein, up 9% vs 2012. Those ages 18–34 and those 65+ were the most likely to try to get more protein (IFIC, 2013a).
Forty percent of the best-selling new better-for-you foods/beverages in 2012 carried a high protein claim (IRI, 2013a).
Optimal timing of protein ingestion, appropriate levels for consumption and/or inclusion in product formulation, and the type of protein are all the kinds of topics around which it would make sense to position new marketing messages.
The importance of the amino acid leucine and a full complement of all of the essential amino acids to muscle synthesis is another high potential new product differentiator.
Savvy marketers (e.g., Kashi and GNC) are helping consumers to understand their unique protein requirements with their "know your number" campaigns. Four in 10 adults are already aware that the time of day they get their protein is important (IFIC, 2013a).
Energy is among the largest overlooked opportunities for protein. Two-thirds of adults (64%) think protein helps provide energy throughout the day; 62% that it helps maintain energy levels (IFIC, 2013a).
Half of protein drink users do so to get more energy (Mintel, 2014). Sustainable energy is a highly desired functional food/drink opportunity for 42% of consumers (Hartman, 2012b).
Joint support is another untapped health linkage; 69% of those ages 65+ and 38% of those ages 18–34 believe protein helps maintain healthy bones/joints; 44% and 29%, respectively, believe that it prevents bone loss during aging (DMI, 2012).
One-third of adults think protein strengthens the immune system (MSI, 2012c). Immunity is very important to 26% of shoppers when making food purchases (FMI, 2013).
Muscle strength/tone has been among the top health concerns since 2010 in the United States and Canada (HealthFocus, 2012). Three-quarters of adults believe that protein helps build muscle, 68% say it increases muscle mass, and 68% believe it helps with exercise recovery (IFIC, 2013a).
Building physical strength is a very important consideration when buying foods for 25% of shoppers (FMI, 2012). Worry over mobility (i.e., the ability to continue with normal activities with aging) is the No. 2 U.S. health concern; 65% believe protein prevents muscle loss during aging (HealthFocus, 2012; DMI, 2012).
Addressing the threat of sarcopenia, a prevalent condition among older adults that involves age-related loss of lean body mass, strength, and function is a new and fast-emerging opportunity; 63% of adults think protein helps you stay active as you get older (Sloan, 2014; DMI, 2012). Body toning, body composition, and body fat are now mainstream mass market opportunities (Sloan, 2014).
One-third of moms are making a strong effort to get more protein for their children (MSI, 2012d). One-third of adults believe that protein promotes healthy hair/nails; 29% believe it contributes to skin health and tissue repair (MSI, 2012c).
Only 31% of consumers are currently aware that soy protein enjoys an FDA-approved health claim for reducing the risk of heart disease (USB, 2013). Sales of snacks carrying a high protein claim rose 16.7% in 2012 (Wyatt, 2013). One in five beverage R&D executives cited protein as a "must have" beverage ingredient for 2014 (Jacobsen, 2014).
--- PAGE BREAK ---
 5. Kid-Specific
With 41% of America's 32 million moms saying they always buy healthy foods/drinks for their kids and 88% claiming to do so at least sometimes, a wider range of healthy, convenient, kid-friendly foods/drinks—with nutrient and calorie levels specific to kids—will find a welcome market (Packaged Facts, 2012b).
One-quarter of 2013's best-selling new foods/drinks touting convenience were targeted to children (IRI, 2014). U.S. retail sales of kid-specific foods/beverages reached $23 billion in 2013 and are projected to hit $30 billion by 2018 (Packaged Facts, 2014).
U.S. kids under age 15 are equally distributed by age: 20 million are under age 5; 20 million 5–9; and 21 million 10–14; however, the 12 million moms dubbed very health conscious are most likely to have kids ages 6–11 (Packaged Facts, 2012b).
Dairy products and snacks (salty and sweet) are the largest kid-specific sectors—each with $3.1 billion in sales in 2013, up 13.6% and 30.2%, respectively, over the past five years. Kid-specific frozen food sales reached $1.8 billion, +13.2%; beverages $1.5 billion, +8.9%; cereal $900 million, +4%; shelf-stable meals $870 million, +11.5%; and produce $390 million, +25.8% (Packaged Facts, 2014).
Six in 10 kids under age 12 drink 100% juice (not orange), 53% fruit drinks, 28% smoothies, 24% vegetable/fruit juice blends, 21% powdered fruit drinks, 17% nutritional drink mixes, 13% vitamin water, and 11% nondairy milk (MSI, 2012d).
Fruit, hot/cold cereal, vegetables, cheese, bread/toast, yogurt, crackers, pasta dishes, peanut butter, pancakes, cookies, and sandwiches are the most frequently consumed foods by kids under age 12 (MSI, 2012d).
One-quarter (28%) of kids under age 4, 45% of kids ages 4–6, 59% of those 7–9, and 53% of those ages 10–12 eat frozen entrees/dinners. For frozen snacks/pizza, the figures are, respectively, 29%, 44%, 61%, and 56% (MSI, 2012d).
Fruit bits, cookies, yogurt, and crackers are the snacks consumed more frequently by kids vs two years ago (NPD, 2013). Three-quarters of kids ages 6–11 snack in the afternoon, 30% in the morning, and 33% in the late evening (Mintel, 2013c).
Only 13% of kids use nutrition/energy bars (Mintel, 2013d). Six in 10 households with kids buy trail mixes (Mintel, 2012).
About one-third of moms are making a strong effort to increase fresh/unprocessed foods, vitamins/minerals, whole grains, and calcium in their child's diet; one in three is making that effort with respect to vitamins D and C and dietary fiber, 24% for fish/omega-3s, and one in five for probiotics/prebiotics (MSI, 2012d).
Half of moms are trying to avoid caffeine; one-third are avoiding artificial sweeteners, high fructose corn syrup, MSG, trans fats, and low/no-calorie sweeteners or sugar; one-quarter strive to avoid artificial flavors/colors (MSI, 2012d).
Forty-four percent of children under age 12 consume organic foods/drinks at least once a week (MSI, 2012d). Moms are less likely to seek out organic as their children age (Packaged Facts, 2012b).
After general well-being, immunity is the most sought after health benefit by moms for functional foods, followed by fixing a nutrient shortfall, cognitive development, energy/strength, digestive health, and vision/eye development. One in 10 moms is looking for help with symptoms of ADD/ADHD (MSI, 2012d).
With protection from diseases later in life (e.g., heart disease, diabetes) second only to strong bones/teeth among moms' top health concerns, marketers should develop kid-specific functional foods that naturally promote heart health, healthy joints, and normal body weight for a healthy adult life (HealthFocus, 2012).
Fast food operators rank healthful kids' meals as the second-most-important menu trend for 2014; fruits/vegetable side dishes for kids was No. 4 and low-/no-fat milk/100% juice for kids was No. 8 (NRA, 2014).
--- PAGE BREAK ---
 6. Pharma Foods
Eight in 10 consumers believe that functional foods can help prevent or delay the onset of heart disease, hypertension, osteoporosis, and type 2 diabetes; six in 10 associate it with benefits linked to age-related memory loss, cancer, and Alzheimer's disease (MSI, 2012a).
In 2013, 56% of consumers bought foods or beverages that targeted a specific condition; 62% of very health-conscious consumers did so (Packaged Facts, 2013c).
Cholesterol-lowering foods/drinks were the most purchased condition-specific food or drink, purchased by 29% of consumers; other benefits and the percentage of consumers seeking the benefit include weight control 24%, blood pressure 20%, digestive health 17%, heart/circulatory 14%, diabetes 13%, and bone/joint 11% (Packaged Facts, 2013c).
Continuing with normal activity while aging tops the list of conditions adults are very/extremely concerned about, followed by retaining mental sharpness, bone health/strength, eye health, tiredness/lack of energy, stress, cancer, and heart disease (HealthFocus, 2012).
Stroke, atherosclerosis, blood plaque, and improving circulation are among the new mass market heart opportunities (Sloan, 2014). Two-thirds of adults are very/somewhat concerned about their circulatory health (MSI, 2012e). Natural components that help increase circulation (e.g., cocoa flavanols) will be in high demand.
Lower GI issues are moving center stage. Digestive regularity is more important to consumers than general digestive health (Hartman, 2012b). Children and older adults suffer from these kinds of issues most frequently (NIDDK, 2012).
One-third of consumers would like more ingredients to help balance blood sugar (Molyneaux, 2012). Long-term sustainable energy and weight control are the most marketable mainstream health linkages for blood sugar control, aside from diabetes (Sloan, 2014).
Claims that indicate a product is "suitable for" a specific group (e.g., diabetics, kids, those with gluten/lactose sensitivities) are appearing on products around the world with increasing frequency (Innova, 2014).
Products focused on reducing diabetic risk factors (e.g., insulin resistance and metabolic syndrome) are other untapped opportunities for food formulators and marketers. Marketers have a good opportunity to tap into the glycemic index to market products in the health/specialty food channel (Sloan, 2014).
With the National Eye Institute's Age-Related Eye Disease Study 2 (AREDS2) not supporting roles for lutein, zeaxanthin, or omega-3 fatty acids in relation to macular degeneration, expect nutrients long associated with eye health to regain their ground.
Sleep difficulties affect 50–70 million adults (NCHS, 2012). One-third of adults associate sleep benefits with tea (MSI, 2010). And one-quarter of consumers say they urgently need to improve the amount of energy they have in order to enjoy an active life (Hartman, 2013b).
Liver health is another fast-emerging market opportunity. One-third of adults suffer from nonalcoholic fatty liver disease; one-half of obese men have it. And one in 10 has liver disease (ALF, 2012). Choline plays an important role in liver health.
Medical foods, an FDA regulatory classification, are among the largest untapped condition-specific opportunities and include foods/beverages focused on disease states.
--- PAGE BREAK ---
 7. Alternatives
Eighty percent of households now eat meatless meals—defined as no meat, poultry, or seafood protein—for dinner on occasion. One in five meal preparers serve them regularly; 29% are eating more fish/seafood (FMI, 2014).
Eggs are the most popular alternative for meatless meals, prepared by 82% of consumers, beans/lentils/legumes by 50%, veggie burgers 21%, seeds/nuts 20%, quinoa/other whole grains 18%, and tofu/tempeh (FMI, 2014).
One in five meal preparers (19%) used meatless breakfast alternatives in 2013, 16% used ground crumbles, 15% meatless poultry, deli, or hot dogs. Seven percent of consumers described themselves as "vegetarian" in 2013 (Mintel, 2013e).
Vegetarian appetizers were ranked second and raw meat/fish eighth among the hot restaurant menu trends for 2014. Non-wheat noodles/pasta (e.g., rice, buckwheat, etc.) topped the list of trendy sides, followed by quinoa, black/forbidden rice, red rice, and pickled vegetables (NRA, 2013).
Meatless/vegetarian items are 10th among the top center-of-the-plate culinary trends for 2014; vegan entrees, 16th. Farm/estate branded items, non-wheat flours, natural sweeteners, ethnic flours, and housemade vinegar are other hot ingredient menu trends for 2014 (NRA, 2013).
With home preparation of one-pot meals up 22% vs five years ago and pasta, noodles, and casseroles up 16%, marketers need to deliver more healthier prepared/packaged dinners, dry mixes, and cooking sauces (FMI, 2012).
Dairy-free milks (e.g., soy, rice, almond) ranked fifth and coconut water was eighth among the popular nonalcoholic beverage trends in restaurants for 2014 (NRA, 2013).
In 2013, 29% of consumers bought soymilk, 27% almond milk, 17% a seed or nut milk, 16% grain milk (e.g., rice or oat), and 12% goat's milk. The dairy milk alternative sector is projected to reach $2.9 billion by 2017 (Mintel, 2013f).
In 2013, 19% of U.S. consumers bought lactose-free milk (Mintel, 2013f). In 2011, 5% of consumers claimed to be lactose intolerant, 9% did not use milk, and 4% avoided dairy foods (Packaged Facts, 2012c).
Despite sales of products with a gluten-free label approaching $10.5 billion in 2013, 79% of consumers report that no one in their household intentionally buys gluten-free foods/drinks; 15% of consumers say they're personally on a gluten-free diet (Mintel, 2013g).
The number of consumers who think gluten-free is generally healthier fell from 46% in 2010 to 35% in 2012, and the number who think it is effective in managing weight fell from 30% to 27% (Packaged Facts, 2013b).
Other dietary components consumers avoided in 2013 include salt, limited by 50%; trans fat 49%; saturated fat 48%; cholesterol 46%; hydrogenated vegetable oils 34%; and caffeine 33% (Hartman, 2013a).
One-third (34%) of consumers bought organic meat/poultry in 2013. The top reason was to avoid hormones, steroids, or antibiotics (FMI, 2014). In 2013, about one in five looked for an endorsement by a health organization they recognized or a non-GMO certified symbol; 16% looked for Fair Trade certification (Hartman, 2013a).
Lastly, use of traditional food forms is offering more trendy alternatives to dietary supplement users. Sales of gummy vitamins increased 35.3%, liquids 7.5%, powders 10.2%, and lozenges 9.6% for the year ended April 13, 2013 (SPINS, 2013).
--- PAGE BREAK ---
 8. Performance Nutrition
The explosive sports nutrition category has morphed into two distinct performance-driven opportunities. While hardcore athletes/body builders will remain a lucrative segment, a new, less intense but much larger mainstream market has taken shape.
This new segment, which has driven sports nutrition sales growth over the past few years, is composed of recreational sports participants, casual athletes and gym exercisers, women who use these products to achieve their fitness/weight goals, Baby Boomers who want to age well, and moms looking for nutrition support for their children (NBJ, 2013e).
Nearly six in 10 adults (58%) used a sports nutrition product in 2012 (MSI, 2012f). Adults who are active in sports are most likely to live in households with incomes of over $100,000 (NSGA, 2013).
In 2012, the combined consumer sales of sports nutrition supplements, nutrition bars, and energy drinks topped $24 billion, +11.2% (NBJ, 2013e). Sales of sports nutrition powders are projected to reach $4.5 billion by 2015; sales of hardcore sports drinks will be an estimated $500 million (NBJ, 2013e).
Sixty percent of Americans reported they were physically active in 2013, on average three to five days per week (IFIC, 2013a).
Ninety-six million are exercise walkers, 66 million jog, 56 million exercise with equipment, 39 million are aerobic exercisers, and 36 million work out at a club (NSGA, 2013).
Globally, walking, swimming, running/jogging, and dancing are the most popular exercise activities. In India, China, and Brazil, more adults exercise at a gym than in the United States (Euromonitor, 2014b).
Sports drinks are the most popular sports nutrition product; they are used by 59% of adults. Meal replacements are used by 39% and protein drinks by 31%. A quarter of adults use sports drinks weekly, and nearly one in five use meal replacement products weekly (Mintel, 2014).
Three-quarters of kids ages 6–11 and 71% of teens ages 12–17 use sports drinks; only 27% of women over age 55 use them (Mintel, 2014). Half of users believe that protein drinks help them perform better during exercise, and 46% believe they help with exercise recovery compared with 40% and 49%, respectively, for sports drinks (Mintel, 2014).
Seventeen percent of adults used energy beverages in 2013; those ages 18–24 remain the heaviest users. Sales of energy drinks were estimated at $12.6 billion (Packaged Facts, 2013b).
Half look for snacks that provide an energy boost; energy snacks were up 20.1% in sales in 2012, with a 14% compound annual growth rate over the past five years (Wyatt, 2013).
Just over one-quarter of adults use meal replacement bars (e.g., Slim-fast, EAS Myoplex); 36% use snack or nutrition protein bars (e.g., Special K Protein); 35% fiber bars (e.g., Fiber One, Fiber Plus); and 22% nutrition bars (e.g., Balance, Luna). A larger number (51%) use regular all-purpose snack bars (e.g., Kashi, Nature Valley) (Mintel, 2013d).
Some Moms are purchasing sports nutrition powders for their children. Interestingly, the number of moms trying to get their kids to gain weight is equal to those encouraging them to lose weight (MSI, 2012d).
With 31 million children involved in organized sports, sports beverages and bars represent a kids' category with strong potential (NSGA, 2013). Only 7% of kids drink energy beverages (MSI, 2012d). Six in 10 parents believe their child should eat lots of high protein food to increase muscle size; 37% believe a high protein diet is best for fueling a child's athletic performance (AND, 2011).
Hardcore users are gravitating to products that have science behind them. Certification is becoming increasingly important. NSF is an independent testing organization that certifies sports nutrition products to ensure that they contain no banned substances. Core users seek products made without artificial ingredients (NBJ, 2013e).
Globally, sports nutrition continues to outpace the overall consumer health industry; interest in the category from nontraditional customers is growing rapidly (Euromonitor, 2014b).
Much of the global innovation in sports nutrition products is coming from creatine, amino acids, carbohydrates, and caffeine-based combination pre-workout mixes (Euromonitor, 2014b).
--- PAGE BREAK ---
 9. Weighing In....
Consumers have taken a dramatic departure from deprivation-style weight loss diets by simply eating healthier and adding specific real food components and/or nutrients. Even commercial weight management programs are focusing on added health-promoting ingredients (e.g., whole grains, good fats, and real sweeteners) vs subtracting them (Hartman, 2013a).
Whole grains, fiber, and vitamin D topped the list of ingredients that two-thirds of those trying to manage their weight added to their diet last year; half included more calcium, protein, antioxidants, or omega-3/fish oil (Hartman, 2013a).
One-third added more iron, oat bran, or flaxseed oil; one-quarter added natural sweeteners other than sugar, prebiotics, complex carbohydrates, and soy protein (Hartman, 2013a).
In 2013, 56% of adults tried to lose weight and 27% to maintain weight (IFIC, 2013a). Boomers ages 45–64 were the most likely to be trying to lose; those 65+ were most likely to be trying to maintain (Packaged Facts, 2013d). More than 155 million adults and 24 million children are overweight or obese (AHA, 2014).
Foods and beverages to promote weight loss are projected to reach $32.8 billion in sales by 2017, up from $29.4 billion in 2012 (Packaged Facts, 2013d). In 2012, high protein and weight control nutrition liquids/powders were the second-fastest-growing U.S. consumer packaged goods products in mass grocery outlets. They were also No. 2 in the healthcare category and in convenience stores (IRI, 2013b).
Sales of diet carbonated soft drinks fell 6% in 2013 as dieters moved to flavored and sparkling no-/low-calorie waters (BMC, 2013). No-/low-/reduced-calorie and slimming claims rose significantly in the alcoholic beverage category (Mintel, 2013h).
While Weight Watchers is America's most popular diet plan, a generic high protein/low-carb diet is second (Consumer Reports, 2013).
Sixty percent of adults believe that protein works for weight loss (IFIC, 2013a). One-third believe that protein boosts metabolism and aids in fat burning (MSI, 2012c). Eight in 10 of those trying to lose weight recognize it is important to consume protein (MSI, 2012g).
Half (48%) of those who use protein drinks do so because they help to curb hunger cravings and promote satiety; 39% do so because they are dieting (Mintel, 2014).
Satiety is currently perfectly poised to be a new market in the health food/specialty channels and among very health-conscious individuals. It is far from a mass market opportunity at this time (Sloan, 2014).
Weight management is the driving force for recent interest in blood sugar control (Sloan, 2014). Curbing cravings and the sustainable energy achieved through blood sugar control are also of benefit to dieters.
The glycemic index, currently featured in the Nutrisystem diet plan, reached mass market awareness levels in 2013, and there is potential for product developers and marketers to capitalize on that awareness (Sloan, 2014).
One-third of those who are trying/have tried to lose weight have done so to lower blood pressure; among those ages 55+, the total increases to half; one-quarter dieted to prevent/control diabetes, and a similar number of consumers did so to address heart disease (Mintel, 2013a).
Only 29% often think of the calories they consume; 9% always think about caloric intake (IFIC, 2013a). Lower-calorie menu options are the No. 1 change diners would like to see at fast food restaurants (Mintel, 2013a).
--- PAGE BREAK ---
 10. Gen Zen
Born between 1981 and 2000, Millennials are ages 14–33 in 2014 and total 85 million; 25% of Millennials are in the workforce (U.S. Census, 2010; BLS, 2012).
Millennials view their food choices as healthier, more expensive, more natural/organic, less processed, and better-tasting than those of their Baby Boomer parents (Hartman, 2011). Fresh is their most important food criteria (Hartman, 2013c).
Use of functional foods and beverages is highest among the youngest consumers and decreases with age (Mintel, 2009). Millennials are the most likely to believe that functional foods/beverages can be used in place of some medicines (NMI, 2012).
Tiredness/lack of energy, retaining mental sharpness with aging, stress, maintaining the ability to continue with normal activities with aging, and eye health are the top health concerns of Millennials ages 18–29 (HealthFocus, 2012).
Just over half of Millennials (53%) are concerned about anxiety or stress, 49% aches/pains, 45% fatigue, 43% high cholesterol, and 36% sleep disorders (Hartman, 2013a). Millennials are the most likely group to use food to address anxiety and sleep disorders, 21% and 13%, respectively (Hartman, 2013c).
Millennials are the most likely generation to have adopted a special diet; 45% have tried/adopted a special diet vs 24% of Boomers. Almost half (46%) of Millennials use gluten-free for overall health and wellness; 29% have food allergies or sensitivities vs 16% of Boomers (Hartman, 2013c).
Over half of Millennials (56%) wanted something healthy for their last snack. Fifty-four percent of Millennials snack alone; 40% eat alone (Hartman, 2013c).
More than half (55%) say they're managing their weight through foods; 36% deliberately add probiotics to their diet (Hartman, 2013c).
Millennials are the most likely to very often/often choose a restaurant for the healthfulness of its menu. More than half of Millennials (55%) want restaurants to offer better-for-you options and alternatives to indulgent foods (Technomic, 2012).
Millennials were much more likely to be negatively influenced by calorie counts on menus; 41% of Millennials vs 22% of older cohorts have changed their order as a result of calorie information (Technomic, 2012).
Calories will likely remain on the front burner with Millennials as they age. While the majority of consumers define a low calorie meal as being between 400 and 600 calories, those ages 18–34 are most likely to cite a range of 200–399 (Mintel, 2013a).
About two-thirds of Millennials and Gen Xers read nutrition labels (IFIC, 2013a). Younger adults are more likely to look for calories (59%), vitamins/minerals (29%), serving size (26%), and protein (23%) than their older counterparts (Hartman, 2011).
Millennials drink a much wider range of beverages than other generations. Juice, sports drinks, energy drinks, hot cocoa, flavored milk, powdered drinks, ready-to-drink coffee, and sparkling drinks top the list (Hartman, 2011).
Finally, 6% of Millennials are "faithful vegetarians." Vegetarian practices have increased 29% among Gen Xers and 19% among Millennials over the past five years (Packaged Facts, 2012a).
 A. Elizabeth Sloan, Ph.D.,
a Professional Member of IFT and Contributing Editor of Food Technology, is President, Sloan Trends Inc., 2958 Sunset Hills, Suite 202, Escondido, CA 92025 ([email protected]).
References
ABC. 2014. American Botanical Council, Austin, Texas. www.herbalgram.org.
AHA. 2014. Heart and stroke statistics. American Heart Assn., Dallas, Texas. www.heart.org.
ALF. 2012. American Liver Foundation. San Diego, Calif. www.liverfoundation.org.
AND. 2011. Sports nutrition practice study. Academy of Nutrition and Dietetics, Chicago, Ill. www.eatright.org.
BLS. 2012. Total labor force participation by generation. U.S. Bureau of Labor Statistics. www.bls.gov.
BMC. 2013. The U.S. liquid refreshment beverage market grew by 1.0% in 2012. Press release, March 25. Beverage Marketing Corp., N.Y., N.Y. www.beveragemarketing.com.
Consumer Reports. 2013. Consumer Reports rate the diet survey. Jan. Yonkers, N.Y.
DMI. 2012. Consumer nutrition survey. Dairy Management Inc., Rosemont, Ill. www.dairy.org.
Euromonitor. 2014. Health and wellness performance overview 2013. March 3. London, U.K. www.euromonitor.com.
Euromonitor. 2014b. Sports nutrition preferences around the globe. Jan. 24.
FMI. 2012. Shopping for health. Food Marketing Institute, Arlington, Va. www.fmi.org.
FMI. 2013. Shopping for health.
FMI. 2014. The power of meat.
Hartman. 2011. Culture of millennials. The Hartman Group, Bellevue, Wash. www.hartman-group.com.
Hartman. 2012a. Organic and natural. Autumn.
Hartman. 2012b. Deep dive: health and nutrition.
Hartman. 2013a. Health + wellness: a culture of wellness. Winter.
Hartman. 2013b. Reimagining health & nutrition.
Hartman. 2013c. Millennials in focus: the emerging food culture of the young & restless. Presented at the Culinary Inst. of America’s Worlds of Flavor Conference, Napa Valley, Calif. Nov. 14-16.
HealthFocus. 2012. 2012 HealthFocus U.S. trend study. HealthFocus Intl., St. Petersburg, Fla. www.healthfocus.com.
IFIC. 2013a. 2013 food & health survey. International Food Information Council Foundation, Washington, D.C. www.foodinsights.com.
IFIC. 2013b. 2013 functional foods consumer survey.
Innova. 2014. The Innova Database. Innova Market Insights, Duiven, The Netherlands. www.innovafood.com.
IRI. 2013a. New product pacesetters. Times & Trends. April. Information Resources Inc., Chicago, Ill. www.iriworldwide.com.
IRI. 2013b. The CPG year in review. Feb.
IRI. 2014. New product pacesetters. Times & Trends. March.
Jacobsen, J. 2014. 2013 new product development survey. Beverage Industry. Jan.: 56, 58, 60, 64-65.
Mintel. 2009. Functional foods–U.S. Aug. Mintel Group Ltd., Chicago, Ill. www.mintel.com.
Mintel. 2012. Nuts and dried fruit–U.S. Aug.
Mintel. 2013a. Healthy dining trends–U.S. July.
Mintel. 2013b. Hispanic diet and wellness–U.S. March.
Mintel. 2013c. Parents’ attitudes toward kids’ and teens’ snacking–U.S. Feb.
Mintel. 2013d. Nutritional food and drink–U.S. Jan.
Mintel. 2013e. Meat alternatives–U.S. June.
Mintel. 2013f. Dairy and non-dairy milk–U.S. April.
Mintel. 2013g. Gluten-free foods–U.S. Sept.
Mintel. 2013h. Wine–U.S. Oct.
Mintel. 2014. Nutritional and performance drinks – U.S. Jan.
Molyneaux, M. 2012. Consumer trends: an up-to-date analysis. Presented at Council for Responsible Nutrition Ann. Mtg., Laguna Beach, Calif.
MSI. 2010. The 2010 Gallup study of tea. Multi-sponsor Surveys, Princeton, N.J. www.multisponsor.com.
MSI. 2011a. The 2011 Gallup study of nutrient knowledge & consumption.
MSI. 2011b. The 2011 Gallup study of Hispanic nutrition & supplement use.
MSI. 2012a. The 2012 Gallup study of nutrient knowledge & consumption.
MSI. 2012b. The 2012 Gallup study of the U.S. market for vitamins & other dietary supplements.
MSI. 2012c. The 2012 Gallup study of protein.
MSI. 2012d. The 2012 Gallup study of children’s nutrition & eating habits.
MSI. 2012e. The 2012 circulatory health study.
MSI. 2012f. The 2012 Gallup study of sports nutrition products.
MSI. 2012g. The 2012 Gallup study of weight loss.
NCHS. 2012. National center for health statistics, Atlanta, Ga. www.cdc.gov/nchs.
NBJ. 2013a. Supplement market grows to $32.5 billion. Nutrition Business Journal. XVIII(6/7): 1-7.
NBJ. 2013b. Global nutrition. XVIII(11/12): 1-9.
NBJ. 2013c. Has the moment arrived? XVIII(9): 1-7.
NBJ. 2013d. U.S. nutrition & Hispanic consumer report.
NBJ. 2013e. Sports, nutrition and weight loss. XVIII(3): 1-23.
NIDDK. 2012. National Institute of Diabetes and Digestive and Kidney Diseases, Bethesda, Md. www.niddk.nih.gov.
Nielsen. 2013. Nielsen’s Hispanic facts. The Nielsen Co., Schaumburg, Ill. www.nielsen.com.
NMI. 2012. Health and wellness database. The Natural Marketing Institute, Harleysville, Pa. www.nmisolutions.com.
NPD. 2013. Snacking in America Report. Jan. The NPD Group, Port Washington, N.Y. www.npd.com.
NRA. 2013. What’s hot chef survey. Oct. National Restaurant Assn., Washington, D.C. www.restaurant.org.
NRA. 2014. Forecast 2014.
NSGA. 2013. Statistics: sports and exercise 2013. National Sporting Goods Assn., N. Palm Beach, Fla. www.nsga.org.
Packaged Facts. 2012a. Targeted health and wellness foods and beverages. Feb. Packaged Facts, Rockville, Md. www.packagedfacts.com.
Packaged Facts. 2012b. Moms as food shoppers. Nov.
Packaged Facts. 2012c. Dairy alternative beverages in the U.S. Jan.
Packaged Facts. 2013a. Non-GMO foods: U.S. market perspective. Sept.
Packaged Facts. 2013b. Energy drinks and shots in the U.S. Jan.
Packaged Facts. 2013c. Experian/Packaged Facts Spring 2013 consumer surveys. Spring.
Packaged Facts. 2013d. Weight management trends in the U.S.
Packaged Facts. 2014. The kids food and beverage market in the U.S. Jan.
Sloan, A.E. 2012. Top 10 functional food trends. Food Technol. 66(4): 24, 26, 28, 30-32, 36-41.
Sloan, A.E. 2014. TrendSenseTM predictive model report. Sloan Trends Inc., Escondido, Calif. www.sloantrend.com.
SPINS. 2013. Combined channel sales: mass & natural, dietary supplements by form. Year ended April 13, 2013. www.spins.com.
Technomic. 2012. The healthy consumer trend report. www.technomic.com.
U.S. Census. 2012. U.S. Census Bureau, Washington, D.C. www.census.gov.
USDA and HHS. 2010. Dietary guidelines for Americans 2010. 7th ed. Dec. U.S. Dept. of Agriculture and U.S. Dept. of Health and Human Services, U.S. Government Printing Office, Washington, D.C. www.dietaryguidelines.gov.
USB. 2013. Consumer attitudes about nutrition. United Soybean Board, Chesterfield, Mo. www.soybean.org.
Wyatt, Lyons, S. 2013. The state of the snack food industry. Presented at SNAXPO, Snack Food Assn. Ann. Mtg., Tampa, Fla. March 16-19.