Menu Mania
New Generation Z diners, cook-at-home restaurant meals, even cleaner menus, and unprecedented culinary expectations are reshaping the $783 billion foodservice sector.

Although the commercial restaurant industry in the United States is projected to enjoy its seventh year of consecutive growth in 2016, with sales reaching $783 billion, up 5.0% over 2015 and 2.1% in inflation-adjusted gains, it will continue to be challenged by slow economic growth, an incomparable reduction in retail food costs versus menu price increases, higher labor costs, and regulatory/food safety issues (NRA 2016). At the same time, restaurant operators are scrambling to offer menu items that appeal to today’s culinary aware, super savvy customers, who pay more attention to everything—from global cuisines and diet-specific food to sustainability, food origins, and healthier children’s fare.
Sales in quick-service restaurants (QSRs), which include fast casual eateries, are expected to rise 5.9% in 2016, outpacing their full-service counterparts, which will have an anticipated increase of 4.9%. Snack/beverage bars will lead foodservice growth, with sales up 6.8%, followed by QSRs, retail host restaurants, hospitals/nursing homes, hotel restaurants, transportation (e.g., airlines), and community centers, each up more than 5% (NRA 2016).
Restaurant sales are projected to grow fastest in the Southeast and Western United States. Florida is projected to enjoy the largest sales gains in 2016, +7.4% over 2015, followed by Nevada, +7.3%, and the state of Washington, +7.0% (NRA 2016).
Although there were 61.3 billion visits to restaurant from June 2015 to June 2016, restaurant traffic for the first half of 2016 remains flat. QSR visits, which account for 80% of total industry traffic, also posted zero growth after being up 1% in the first quarter of 2016 (NPD 2016a).
After an explosive 11% increase in traffic in 2015, visits to fast casual restaurants were also flat in the year ending in June 2016, with losses attributable to Chipotle Mexican Grill and its food safety issues. With Chipotle not taken into consideration, fast casual visits were up 2% in the second quarter. With Chipotle factored in, visits were down 3% (NPD 2016a).
The casual dining and midscale/family dining full-service segments continued to suffer traffic declines in the second quarter of 2016 (NPD 2016a). Full-service chains are also still struggling (Technomic 2016a).
Lunch traffic, which represents one-third of all daypart visits, declined by 4% in the second quarter of 2016 versus the same period in 2015. Dinner, which accounts for 30% of all daypart visits, fell 1%. And morning meal traffic, accounting for 22% of all daypart visits, increased 1% (NPD 2016a).
While Boomers (now aged 52–70) and their older counterparts continue to account for the largest share of restaurant traffic (38%), a new generation of diners—Generation Z—has stepped into the spotlight and now contributes 22% of visits versus Millennials and Gen Xers, each at 21% (Glazer 2016).
Gen Zers (teens and tweens) are born foodies, growing up on a wide diversity of ethnic cuisines. They tend to visit restaurants with others (the average Millennial party size is 2.4) and share their orders. They look for the opportunity to customize orders, speed of service, and healthy menu options. They favor QSRs more than any other segments and have a particular tendency to frequent specialized snack concepts (e.g, Jamba Juice) (Technomic 2016a).
Hispanics remain a strong growth target for restaurants, making 10.5 billion visits to foodservice outlets in 2015, up 1% for the year. Hispanics dined with their children on 41% of visits versus 30% of non-Hispanic restaurant goers whose children joined them (NPD 2016b).
U.S. Hispanics favor major chains, visiting them 74% of the time versus 60% of non-Hispanics who do so; QSRs are their outlet of choice. Applebee’s advertised heavily to Hispanics in 2015 and grew visits by 7%; one in four visitors to the chain is now Hispanic (NPD 2016b).
--- PAGE BREAK ---
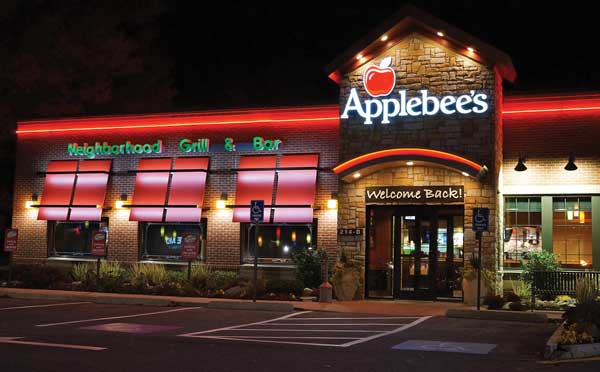 Restaurant visits on a deal also grew, up 2% for the total industry. Combo meal visits to QSRs were up 2% and helped improve sales in burger chains (NPD 2016c). Panera Bread, with its “eating clean” platform, ousted Applebee’s as the tenth-largest U.S.–based restaurant chain in 2015. All of the top 10 chains are now limited-service restaurants (Technomic 2016b).
McDonald’s returned to positive sales in the United States in 2015, fueled in part by the introduction of all-day breakfast. Starbucks posted the strongest gains among the top 10 chains, +12.8% in 2015, followed by Taco Bell at +8.2%. Taco Bell leapfrogged both Burger King and Wendy’s and now ranks No. 4 among the largest chains. Although Subway is holding steady at No. 3, its sales have slipped for the past two years (Technomic 2016b).
Asian noodle restaurants, +10%; coffee cafés, also +10%; and restaurants that specialize in chicken, +9%, posted the highest menu category growth among limited-service eateries in 2015. Steak-focused full-service concepts, sports bars, wing-centric eateries, and breakfast-focused midscale chains (e.g., Another Broken Egg Café) were other winning segments (Technomic 2016b).
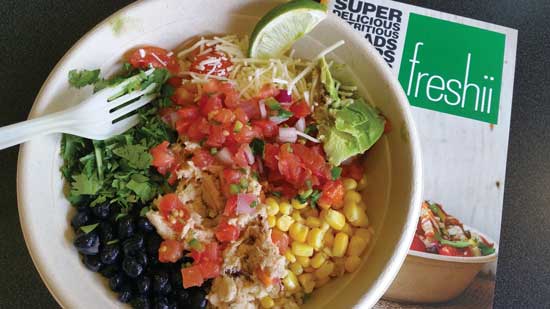
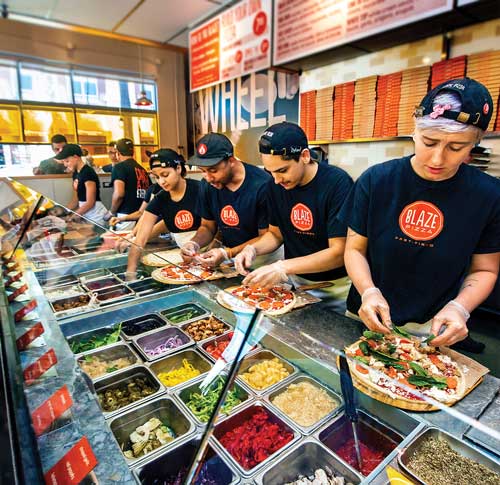 Three fast casual pizza concepts—Blaze Pizza, MOD Pizza, and Pieology pizzeria—were among the five fastest-growing U.S. chains in 2015, bolstered by build-your-own concepts. BurgerFi and PDQ rounded out the “top 5” list. BBQ, ethnic, and health-focused restaurants such as Freshii also had a very good year (Technomic 2016b).
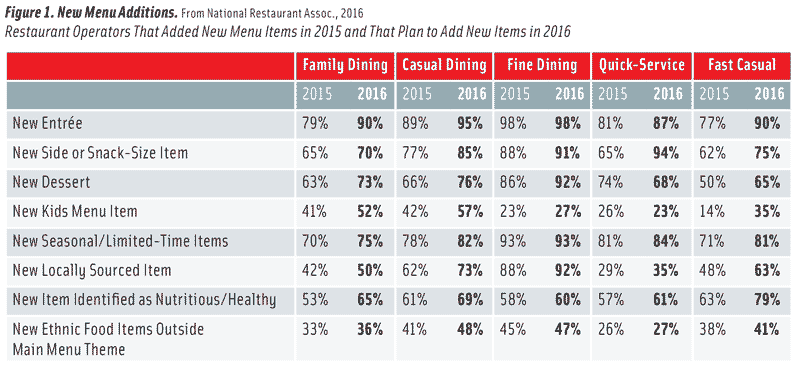
The future for more exciting culinary opportunities—for both diners and suppliers—looks even brighter. Nine in 10 fine dining restaurants planned to add a new side dish or snack in 2016, 60% of QSRs will introduce healthier menu items, and nearly two-thirds of fast casual eateries expect to unveil a new dessert (NRA 2016, Figure 1).
Movable Feasts
More so than ever, consumers want to eat whatever food they crave, whenever they feel like it, and wherever they are—and pay for it with the click of their phone. Half (48%) of dinner meals purchased from a restaurant in 2015 were eaten at home as take-out (NPD 2016d). Two-thirds of Millennials say they’re likely to use curbside takeout from a tableservice restaurant this year (NRA 2016).
Over the past four years, delivery from restaurants has grown by 69 million visits (orders) while drive-through traffic fell by 128 million visits from May 2012 to May 2016. Non-pizza delivery traffic is up 33%; pizza delivery fell by 35%. Asian, Italian, and sandwich concepts are the most popular source of non-pizza restaurant-delivered meals (NPD 2016e).
Home delivery accounts for one-fifth of Millennial foodservice occasions; for Baby Boomers, the figure is one-tenth. Families with children accounted for 46% of all growth in restaurant delivery in 2015. Delivery checks average 63% higher than the average restaurant order (before tip). Four in 10 Millennials (39%), 37% of Gen Xers, and 25% of those over age 70 say they will take increased advantage of delivery of non-pizza restaurant meals this year (Jennings 2016). Panera Bread, Chipotle, and Burger King are offering delivery service; Dunkin’ Donuts, Taco Bell, and Starbucks have conducted trials (Jennings 2016).
Third-party meal delivery (e.g., UberEATS, GrubHub) is generating significant additional business for restaurants that normally don’t deliver; 31% of third-party users ordered from a casual dining eatery; 14% ordered from a family-style restaurant (Technomic 2016c).
Grocerants—grocery and restaurant hybrids that provide restaurant quality, fresh-prepared foods for take-out or in-store dining—are another explosive foodservice-on-demand trend. In-store dining and take-out prepared foods sales topped $10 billion in 2015, up 9.8% versus 2014 and accounted for 2.4 billion foodservice visits. More than 40% of adults buy prepared items from grocery stores (NPD 2016f).
With sales up 10.1% to $4 billion in 2015, entrées were the most purchased grocery foodservice item, followed by appetizers and salads, each with sales of $1.5 billion and each up 9%. Sales of dips/sauces jumped 35% to $210 million, fresh soups climbed 23% to $74 million, and sides were up 9% to $384 million (IRI 2016). Meatloaf sales grew 66%; fresh guacamole, 51%; barbecue chicken, 37%; pulled pork, 32%; pasta entrées, 24%; breakfast entrees, 14%; and Mexican entrees, 10% (IRI 2016).
Fresh signature meal kits or pre-prepared fresh meal components from restaurants represent another fast-emerging trend, although it is still in its infancy. Only 3% of U.S. consumers have used restaurant food kits (NPD 2016g).
Although 17% of fine dining restaurants say they currently offer meal kits, 40% of fine dining restaurant operators, one-third of family dining restaurant operators, and one-quarter of fast casual operators believe signature meal kits will grow in popularity and potential (NRA 2016).
Half (47%) of adults say they would be interested in buying fresh signature meal kits from restaurants; those aged 18–34 are the most interested (60%). Among those aged 45–54, 50% are interested, and 47% of those aged 35–44 are interested. Half of households with kids under age 18 at home say they would use them, with men slightly more interested than women (50% versus 43%) (NRA 2015a). Packaged Facts (2016a) projects food kits will reach $1.6 billion in sales in 2016 and will double in sales within the next few years.
While fewer than one in 10 bricks-and-mortar restaurants currently operate a food truck, 60% of fast casual and 52% of casual dining operators think they are a good way to expand business (NRA 2016).
Lastly, social catering remains a strong industry segment, projected to post sales of $8.1 billion in 2016, up 4.9% (NRA 2016). Food halls are another fast-emerging U.S. foodservice opportunity.
--- PAGE BREAK ---
 The Daypart Dilemma
Since the recession, restaurants have lost dinner meal share to home-prepared meals. In 2015, 20% of dinner meals were purchased at a restaurant, down from 23% in 2007. On a per capita basis, this translates to a drop of 7.5 visits per person and a loss to the foodservice industry of $23 billion dollars on dinner alone over the past eight years (NPD 2016h).
QSRs are the top venue for restaurant traffic, and a fast breakfast is the top reason to go, followed by on-the-go lunches and adult snacks (NPD 2016i). Breakfast sandwiches are the top breakfast food choice at QSRs, followed by doughnuts, hash browns/home fries, bagels, and breakfast wraps/burritos (NPD 2016d).
Pepper bacon, salami, Angus beef, salmon, chorizo, sirloin, and whitefish top the list of the fastest-growing proteins on restaurant breakfast handhelds; feta, pepper jack, provolone, and white cheddar are among the top 10 cheeses (Technomic 2015a).
Ethnic-inspired breakfast items, traditional ethnic recipes, and regional gravies top the list of hot breakfast culinary trends for 2016 (NRA 2015b). Two-thirds of those aged 25–44, 49% of those aged 18–24, and 33% of those aged 55-plus would like to see more ethnic items/flavors on breakfast menus (Technomic 2015b).
About 40% of U.S. adults regularly eat breakfast pastries, 30% have muffins, and 19% eat croissants for breakfast, so it is clear that upscaling breakfast bakery foods is a big opportunity (IDDBA 2016). One in five adults order a bakery item as a main entrée at a restaurant for breakfast, 21% as a breakfast side, and 26% to take with them as a snack (IDDBA 2016, Technomic 2015c).
In restaurants, 38% would consider ordering nut-based offerings at breakfast; walnut, almond, pecan, and hazelnut were the top nuts on breakfast menus. Chipotle, tomatillo, hot sauce, mayonnaise, and basil pesto were the fastest-growing toppings on breakfast menus at independent foodservice outlets (Technomic 2015 b, d).
Foods that are high in protein remain popular choices among those dining out. Thirty-six percent of diners say they would order a protein bar for breakfast at a restaurant; 34%, protein shakes; 32%, beans; and 30%, grain-based protein sides (Technomic 2015d).
Banana, strawberry, mango, and pineapple are the top breakfast smoothie flavors in restaurants; carrot, ginger, date, mint, cinnamon, avocado, and coffee are the fastest-growing. Mint, green apple, cucumber, blueberry, and ginger are the fastest-growing breakfast juice flavors; cinnamon, almond, spiced, mint, and coconut are among the top 10 coffee flavors on breakfast menus (Technomic 2015e).
Turkey, ham, chicken, sub sandwiches, and deli salad sandwiches (i.e., chicken salad, tuna salad) are America’s top five favorite luncheon sandwiches. All-natural chicken has jumped 170% on restaurant menus from 2010 to 2014. Six of the top 10 fastest-growing proteins on menus are pork. Pulled pork, Canadian bacon, Mexican carnitas, country/smoked ham, and slow-roasted pork are the top pork menu gainers. Seafood is increasingly popular on sandwich menus (Packaged Facts 2015).
White and sharp cheddar, Gruyere, goat cheese, aged cheddar, queso, Gouda, and fontina are the cheeses that posted the largest gains in restaurant sandwich sales from 2010 to 2014 (Packaged Facts 2015).
Over the past two years, bread has inched out protein as the most important part of the sandwich. Consumers are more likely to experiment with bread than any other sandwich ingredient (Datassential 2014). While breads, rolls, and wraps remain the top sandwich carriers on restaurant menus, their presence has been declining from 2010 to 2014; pretzel, brioche, artisan, and ciabatta breads posted the biggest gains. Unique flatbreads, Mexican torta, sprouted/ancient grain, herbal, cheese, and vegetable breads are grabbing customer attention as well (Packaged Facts 2015).
Lastly, the late evening snack is the only eating occasion where visits have increased 2% over the past year (NPD 2016i).
Food Matters
More than eight of 10 consumers (84%) say their No. 1 priority when they pick a table-service restaurant is the opportunity to order their favorite food. For 69%, healthy menu items matter most (NRA 2016, Figure 2).
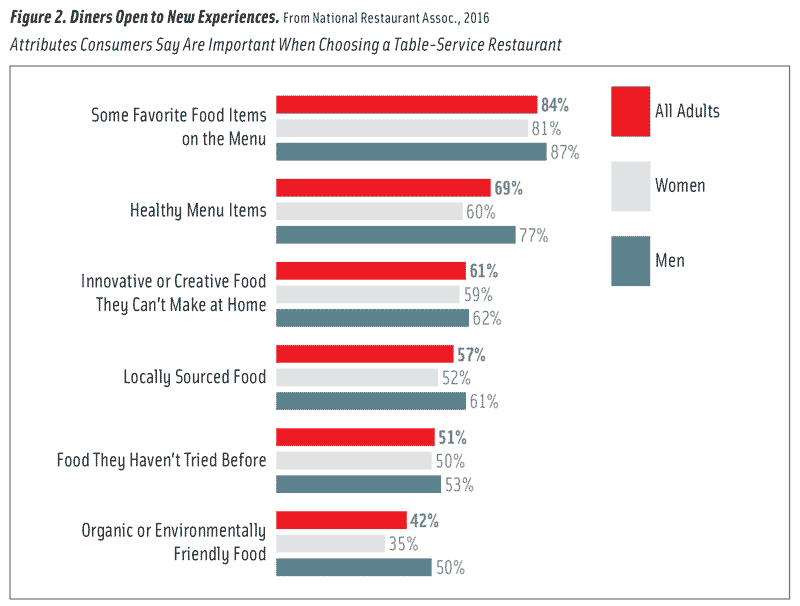
Nine in 10 restaurant operators say their guests are more adventurous, more knowledgeable about food, and more focused on food quality, and they expect a more sophisticated food experience than they did just two years ago (NRA 2016).
NPD reports that french fries were the fastest-growing menu item in terms of the number of incremental servings for the year ended in September 2015, up 2%, followed in descending order by chicken nuggets, +9%; total Mexican, including nachos, +3%; breakfast sandwiches, +3%; doughnuts, +6%; biscuits, +8%; salty snacks, +2%; hash browns/home fries, +3%; pizza, +1%; and yogurt (non-frozen) +16% (Glazer 2015).
In the past two years, the number of items offered on the top 500 chain menus has dropped 3.2%; starters and desserts decreased in number by more than 5%. Cutbacks occurred in every major entrée category with the exception of rice dishes (Technomic 2015f).
Garlic bread, wings, french fries, shrimp cocktail, fried cheese sticks/slices, chicken strips/bites, and potato skins are Americans’ favorite appetizers. Among the most prevalent appetizer dishes offered on menus, lettuce wraps, ahi tuna, hummus, meatballs, and flatbreads are the fastest-growing (Datassential 2015).
The top appetizer trends for 2015 include fresh/house-made sausages, charcuterie (including seafood), ethnic, street-inspired, and vegetarian (NRA 2015b). Loaded and seasoned fries are currently in the spotlight as appetizers and sides. McDonald’s is testing garlic-coated fries.
Giardiniera, harissa, wine reduction, and cider are among the fastest-growing appetizer sauces/flavors. Taleggio, burrata, Cotija, chevre, and beer-flavored are leading appetizer cheeses. Ribeye, porchetta, and bratwurst are increasingly being served as appetizers along with grits, bao buns, brioche, and linguine (Datassential 2015).
Appetizers carrying a vegan claim jumped 61% on menus last year; other claims that are turning up with increasing frequency include heirloom, +49%; tart, +35%; and build-your-own, +28% (Datassential 2015).
--- PAGE BREAK ---
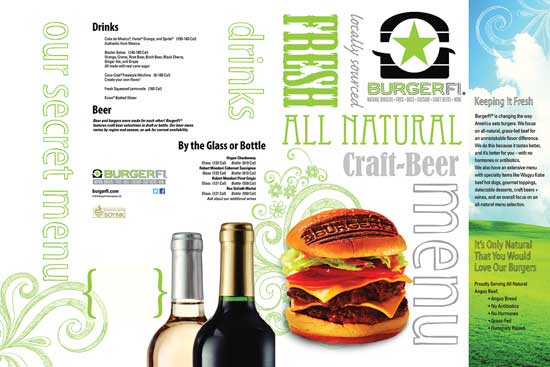 From Nashville hot fried chicken, whole fish dishes, and stuffed burgers to poke and bowl meals, the center of the plate remains a top attraction. New cuts of meat (e.g, pork T-bone chops), free-range pork/poultry, grass-fed beef, underutilized cuts of meat (e.g, shoulder), and trash fish are strong culinary trends. Burger King has enjoyed great success with its Classic and Grilled Chili Dogs.
“Prime” is the most appealing steak/beef entrée descriptor, cited by 57% of diners, followed by Angus, mentioned by 44%; lean, 39%; choice, 34%; aged, 21%; and Kobe/Wagyu, 12%. Thirty-one percent of restaurant diners who order meat/poultry say that “all natural” is very important to them; 36% mention no hormones (Packaged Facts 2016b).
Vegetarian/meatless entrees ranked eighth among center-of-the-plate hot culinary trends for 2016; vegan entrees were ninth (NRA 2015b). White Castle even offers vegetarian sliders.
Pickling, fermenting, smoking, sous vide, and fire-roasting are among the trendy preparation techniques for 2016; popular flavors include burnt, charred, smoked, and wood-based (e.g., hickory) (NRA 2015b).
Ethnic condiments/flavors ranked among the top 20 overall hot culinary trends for 2016, along with authentic ethnic cuisines. African and Latin American flavors and ethnic fusion cuisines were also among the top five hot ethnic food trends for this year (NRA 2015b).
Italian, Mexican, and Chinese cuisines reign supreme in terms of familiarity, trial, and frequency. Consumers are least familiar with Ethiopian, Brazilian, Argentinian, Peruvian, and Korean cuisines. Seventeen percent of adults say they eat Mediterranean cuisine at least once a month; 13%, sushi/sashimi, and/or other Japanese or ethnic fusion foods; and 11%, regional ethnic cuisines (NRA 2015c).
The most common ethnic foods eaten in restaurants are sushi, Thai, Vietnamese, Brazilian, Argentinian, Greek, and Southeast Asian. Chinese is by far the most common cuisine for restaurant takeout and delivery, followed by Mexican and Italian (not including pizza) (NRA 2015c).
Ethnic cheeses and flours remain strong ethnic culinary trends for 2016 (NRA 2015b). Pistou, Romesco, shiso, espelette, berebere, peri peri, and gochujang are ethnic sauces and seasonings to watch. Feta, bleu, Gorgonzola, pecorino, and Asiago now rank among the top 15 pizza cheeses in restaurants (Packaged Facts 2015).
Ancient grains continue to hold the No. 1 spot among the hot side dish trends for 2016, followed by non-wheat noodles, black/forbidden rice, pickled vegetables, Asian noodles, and fingerling potatoes (NRA 2015b).
Chia posted the largest “grain” gains on menus from 2014 to 2015, followed by sorghum, millet, quinoa, amaranth, flax, and bulgur (Thorn 2016a). Heirloom, hybrid, and exotic fruits/vegetables, unusual/uncommon herbs (e.g., chervil, lemon balm), extra hot peppers, and dark greens remain strong culinary produce trends (NRA 2015b).
Consumers are ordering slightly more desserts, with orders up 1.9% for the yearlong period ending in January 2016. Rhubarb, chocolate hazelnut, mint chocolate, shortbread, buttermilk, marshmallow, butterscotch, cream cheese frosting, and butter pecan were among the fastest-growing dessert ingredients and flavors, per Datassential (Thorn 2016b). House-made ice cream, mini products, savory treats, hybrids, smoked desserts, and those made with vegetable ingredients are among the hot dessert culinary trends for 2016 (NRA 2015b).
House-made/artisan soft drinks, gourmet lemonade, specialty iced teas, mocktails, and coconut water are among the beverage trends for 2016 (NRA 2015b). Green juices, vitamin superfood supplement drinks, Mexican hot chocolate, Latin beverages (e.g., agua fresca), cold brewed coffee, and hot drinking bouillon are other up-and-coming beverage trends.
Healthy, Sustainable, and Fair
Four in 10 diners report they are ordering healthier food for their children more often at restaurants than they did last year; 29% are ordering more menu items with fruits/vegetables; 27% replace unhealthy sides/preparation methods with healthier options; 25% look for nutritional claims on menus; and 22% order smaller portions (Mintel 2016).
Healthful kids meals rank seventh among the overall hot culinary trends for 2016; fruit/vegetables sides, whole grain products, entrée salads, and gourmet items round out the top culinary trends on menus for kids in 2016 (NRA 2015b).
One in five diners are ordering more whole grain menu items; 18% are ordering more organic products; 14%, more gluten-free; and 12%, more meat alternatives (Mintel 2016).
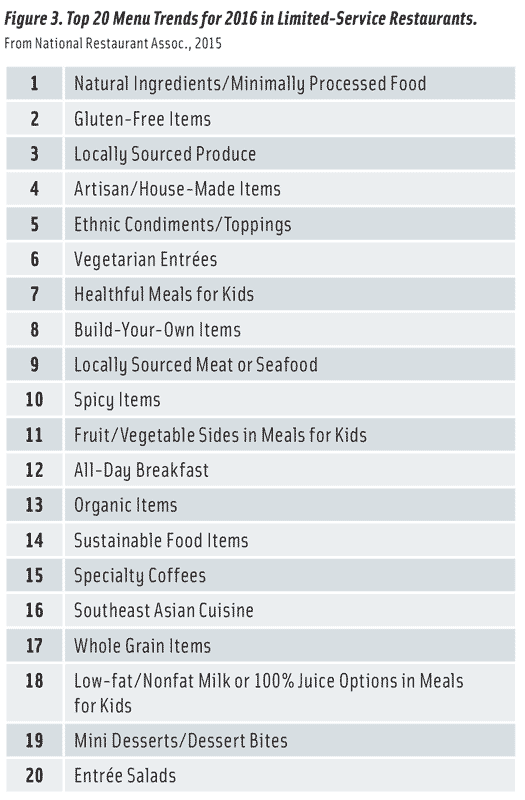
Natural ingredients/minimally processed foods top the list of “hot” culinary trends for 2016 in limited-service restaurants, followed by gluten-free offerings, locally sourced produce, artisan/house-made items, ethnic condiments/toppings, vegetarian entrées, and healthful kids meals (NRA 2016, Figure 3).
In restaurants, diners are most willing to pay for items that are antibiotic-free and high in protein (Mintel 2016). Four in 10 diners want to see more 100% natural beverages on menus; 34% want more fresh-made juices; 31%, more iced tea options; 25%, flavored waters; 24%, beverages with health benefits; and 21%, vegetable juices. One-quarter prefer to order diet soft drinks; 15% would pay more for organic beverages (Mintel 2016).
Half of consumers are interested in superfoods. Three quarters of diners are aware of them; 33% say the term helps them to select healthier foods (Datassential 2016).
Seven in 10 consumers say they’re more likely to visit a restaurant that sources locally; those aged 55–64, the heaviest users of restaurants, are most likely to say so. Local foods are most prominent in fine dining, followed by casual dining, with 92% and 60%, respectively, offering them (NRA 2016).
Locally sourced meats/seafood are the top overall hot culinary trend for 2016. Locally grown produce ranks No. 3; hyper-local sourcing, No. 4; natural ingredients/minimally processed food, No. 5; environmental sustainability, No. 6; sustainable seafood, No. 9; farm/estate branded items, No. 13; and food waste reduction/management, No. 19 (NRA 2015b).
Two-thirds of consumers want to buy from companies that support humane treatment of animals (Hartman 2015). McDonald’s now offers free-range eggs and cage-free pork. Six in 10 diners say they are more likely to make a restaurant choice based on its eco-friendly practices, (e.g., water conservation and recycling); 40% are influenced by organic menu content and sustainable sourcing (e.g., wild-caught fish) (NRA 2016).
Artisan and house-made menu items continue their popularity. Artisan butchery ranks 14th among the overall hot culinary trends for 2016; house/artisan soft drinks are the top nonalcoholic beverage trend. Artisan pickles, house-made condiments, and specialty bacon continue to have strong appeal.
In summary, the top 10 most important practices at foodservice eateries include the following in descending order: fair treatment of employees; sourcing the freshest ingredients; supporting the U.S. economy; partnering with local businesses; responsibly sourced fish/seafood; local ingredients; country-of-origin transparency; humanely raised meat, poultry, and dairy; sourcing seasonal ingredients; and farm-to-table transparency (Hartman 2015).
A. Elizabeth Sloan, PhD, a professional member of IFT and contributing editor of Food Technology, is president, Sloan Trends Inc., Escondido, Calif. ([email protected]).
References
Datassential. 2014. The Keynote Report: Sandwiches. Sept. Datassential, Los Angles, Calif. datassential.com.
Datassential. 2015. The Keynote Report: Appetizers. March.
Datassential. 2016. Menu Trends Keynote Report: The New Healthy.
Glazer, F. 2015. “Menu Innovation a Key Traffic Driver.” NRN 49(12): 58.
Glazer, F. 2016. “Move Over, Millennials.” NRN 50(11): 56.
Hartman. 2015. Sustainability/Transparency. The Hartman Group, Bellevue, Wash. hartman-group.com.
IDDBA. 2016. What’s in Store? International Dairy Deli Bakery Assoc., Madison, Wis. iddba.com.
IRI. 2016. “Top Trends in Fresh Prepared.” Webinar, Feb. 25. Information Resources Inc., Chicago. iriworldwide.com.
Jennings, L. 2016. “Restaurant Delivery’s Volatile Landscape.” NRN 50(4): 10, 11, 12, 15.
Mintel. 2016. Healthy Dining Trends—U.S. March. Mintel International, Chicago. mintel.com.
NPD. 2016a. “Restaurant Traffic Remains Stalled in Q2 and Fast Casual Visit Growth Slows.” Press release, Aug. 30. The NPD Group, Port Washington, N.Y. npd.com.
NPD. 2016b. “Hispanics Continue to Grow Restaurant Visits While Non-Hispanic Visits are Flat, Reports NPD.” Press release, April 20.
NPD. 2016c. “Combo Meal Deals Fuel QSR Growth While Fast Casual Traffic Growth Softens.” Press release, June 7.
NPD. 2016d. 31st Annual Report on Eating Patterns in America.
NPD. 2016e. “Foodservice Delivery Grows at the Expense of Restaurant Drive Thru.” Press release, July 21.
NPD. 2016f. “Millennials Are Driving the Rise of the Grocerant.” Press release, June 14.
NPD. 2016g. “Buzz about Meal Kit Delivery Services May be Greater Than Adoption at This Point.” Press release, July 20.
NPD. 2016h. “Eat In or Eat Out—What Drives Dinner Choices?” Foodservice Brief. May.
NPD. 2016i. “Marketing to Visit Situations.” Foodservice Brief. March.
NRA. 2015a. Food and Menu Trends Survey. National Restaurant Assoc., Chicago. restaurant.org.
NRA. 2015b. What’s Hot 2016 Culinary Forecast. American Culinary Federation Chefs. Nov.
NRA. 2015c. Global Flavors.
NRA. 2016. 2016. Restaurant Industry Forecast.
Packaged Facts. 2015. Sandwich: Trends & Opportunities. June. Packaged Facts, Rockville, Md. packagedfacts.com.
Packaged Facts. 2016a. Meal Kit Delivery Services in the U.S. April.
Packaged Facts. 2016b. Meat, Poultry & Seafood: Restaurant Trends and Opportunities. June.
Technomic. 2015a. Smucker’s Foodservice Breakfast Brief: Breakfast Handhelds. Technomic, Chicago. technomic.com.
Technomic. 2015b. Smucker’s Foodservice Breakfast Brief: Condiments, Toppings and Sauces.
Technomic. 2015c. Smucker’s Foodservice Breakfast Brief: Bakery Goods.
Technomic. 2015d. Smucker’s Foodservice Breakfast Brief: Non-Meat Proteins.
Technomic. 2015e. Smucker’s Foodservice Breakfast Brief: Breakfast Beverages.
Technomic. 2015f. “The Incredible Shrinking Menu?” Technomic Blog, April.
Technomic. 2016a. “How to Appeal to Generation Z.” Press release, July 29.
Technomic. 2016b. Top 500 Chain Restaurant Report.
Technomic. 2016c. On Demand Delivery: Disrupting the Future of Foodservice.
Thorn, B. 2016a. “Whole Grains Make Gains on Menus.” NRN 50(5): 64, 66, 68.
Thorn, B. 2016b. “Diners Sweet on Classics with a Twist.” NRN 50(4): 102, 104.
