Generational Demands, Differences, and Diversity

Americans aged 70-plus are now the most likely to cook using a microwave oven (Harris 2016). Last year, for the first time, more men than women bought gourmet foods; 42% of men were the primary grocery shopper for their household (SFA 2016, FMI 2016a). Baby Boomers are the most frequent restaurant visitors (NRA 2017). As the preceding examples illustrate, consumers’ shopping, meal preparation, and consumption patterns are not always what one might expect.
Millennials have reinvented brown-bagging. Young moms are driving explosive interest in alternative/plant-based snacks (Packaged Facts 2017a). African-Americans are among the heaviest users of frozen meals; Asian-Americans are nearly three times more likely than any other group to buy seafood (Packaged Facts 2017b, Nielsen 2017a).
New generational attitudes and lifestyles along with demographic shifts are creating new opportunities for food and beverage manufacturers and reshaping the customer mix.
Editor’s Note: This article presents population projections based on the most recent U.S. Census (2015). However, with a significant decrease in U.S. immigration, which normally would contribute to growth in the younger population segments, generational size estimates should be used only directionally.
Demographic Dynamics
At this point in time, three generations—Millennials, Baby Boomers, and Gen Z (which refers to America’s 74.5 million infants, toddlers, young children, and teens aged 19 and under)—each make up about one-quarter of the U.S. population (U.S. Census 2015).
In 2015, America’s 75.4 million Millennials, who are now aged 20–36, inched past their 74.9 million Baby Boomer parents’ generation—now aged 53–71—to become the largest U.S. adult population cohort. If recent U.S. immigration levels continued, the Millennial segment was projected to grow and peak at 81.1 million in 2028.
Boomers were projected to number 69.0 million in 2020, Gen Xers 60.8 million, and Matures, 20.8 million. Gen Z was anticipated to become the largest generational cohort (U.S. Census 2015).
With one-third (34%) of Millennials still living at home with their parents or in college dormitories, marketers have yet to realize these young adults’ full food/beverage market potential (U.S. Census 2015).
Baby Boomers controlled 70% of all disposable income and spent $230 billion on consumer products in 2016, so it’s likely they will dominate the food/beverage market for several years to come (Nielsen 2017b).
With growth in the female population concentrated between the ages of 24–39 from 2015 to 2020, Millennials will drive a new baby boom (Goldman Sachs 2016). Currently, 28% of U.S. households have children under age 18 at home. Packaged Facts (2016a) projects the kids’ food and beverage market will reach $42 billion by 2019.
With couples with no children at home (accounting for 38% of households) and those living alone (28% of households) remaining the two largest household units, the demand for more single-serve and easily portionable items will continue (U.S. Census 2015).
In 2016, 123.5 million American adults were single; four in 10 were younger than age 30 (FMI 2016a). In nearly half (46%) of all eating occasions last year the person was eating alone; 53% of consumers ate breakfast alone, 45% were alone for lunch, and 24% for dinner (Hartman 2016a).
Globally, single-person households will see the fastest growth from 2013–2030 (+33%), followed by couples with no children at home (+27%), single-parent families (+25%), and couples with children (+16%) (Euromonitor 2017).
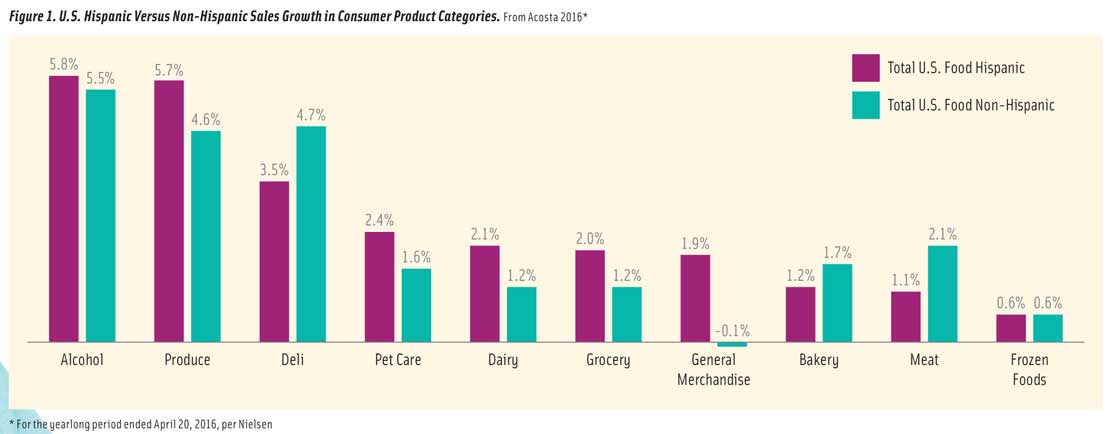
Figure 1. U.S. Hispanic Versus Non-Hispanic Sales Growth in Consumer Product Categories. From Acosta, 2016
Nearly 57 million strong, Hispanics are driving sales growth across several food categories, including produce, dairy, dry grocery, alcoholic beverages, and pet care products (Acosta 2016, Figure 1).
With multicultural consumers now making up 49% of Gen Z, 44% of Millennials, 40% of Gen Xers, and 28% of Baby Boomers, expect greater attention to authentic global culinary fare (Nielsen 2017a).
Watch for new culinary influences from Mexico, China, India, the Philippines, El Salvador, and Vietnam—the top countries of origin for recent U.S. immigration (U.S. Census 2015). With a declining middle class, consumers making more than $100,000 a year will continue to drive food trends and demand more high-quality, premium food experiences; 45.1 million households had annual incomes of more than $100,000 in 2014 (Hartman 2016b).
At the same time, savvy food marketers are better targeting the needs of the 44.4 million lower-income Americans who participate in the U.S. Dept. of Agriculture’s Supplemental Nutrition Assistance Program (food stamps).
As U.S. consumers migrate back to urban living—especially to cities with populations in the range of 500,000 to one million, focusing on the specific needs and preferences of city dwellers is a very smart idea for food and beverage marketers (Nielsen 2016).
What’s Cooking?
More than half of Millennials (54%) say they prepared dinner at home more often last year versus 38% of consumers overall who made that claim. Baby Boomers/Matures made a meal that required preparation five nights per week on average; Millennials did so an average of 4.1 times (FMI 2016a).
Six in 10 Millennials prepared their evening meal using some semiprepared items (e.g., precut vegetables or precooked meat); 29% prepared a meal from scratch (FMI 2016b).
 Four in 10 Millennials are heavy users of prepared side dishes—double any other age group. One in three consumers under age 45 use packaged meals/frozen dinner kits; one in five use refrigerated heat-and-eat potatoes/pasta (Harris 2016).
Three-quarters of Boomers, Gen Xers, and Millennials now consider themselves very knowledgeable about scratch cooking; nine in 10 Matures and 40% of men feel that way (FMI 2016a, Mintel 2017a).
Gen Xers have the highest confidence in their ability to cook healthy meals, Millennials have the highest confidence regarding baking cakes/dessert preparation, and men have the highest confidence in their barbecue skills—81% versus 63% of women (FMI 2016a).
Hispanics, those with children at home, and Millennials are the most likely to say they enjoy cooking. One-third of Millennials use recipes from websites, which is double the number in any other age group; 23% use recipes from a cooking show (Harris 2016).
More than half (56%) of Millennials would try a new meat/poultry item versus 38% of Baby Boomers and 18% of Matures. Households with young kids, Millennials, and Gen Xers are most likely to use heat-and-eat and value-added meats (FMI 2017).
Households with kids are four time more likely than others to use a food processer or blender, three times more likely to cook on the grill or use a slow cooker, and twice as likely to use preprepared side dishes (Harris 2016).
Millennial households are more likely than others to own a blender, panini press, soda maker, pizza oven, or electric rice cooker; they are the most likely to cook on the barbecue grill (NPD 2015).
Just over half (52%) of adults use deli-prepared foods; singles, households with young children, men, Millennials, and urban dwellers are the most likely to do so (FMI 2016b).
One-quarter of prepared food users are interested in more Southern, Japanese/sushi, and Thai/Vietnamese meal offerings; 42% want more salads. Cuisines that draw greater interest from younger shoppers include Japanese/sushi, Thai, Vietnamese, Indian, Middle Eastern, and Korean (FMI 2016b).
Households with kids are the heaviest users of all frozen food categories. African-American households and those that include teens are the most likely to use frozen entrées and frozen snacks (Packaged Facts 2017b).
 Five percent of Millennials have ordered ready-to-prepare meal kits (e.g., Blue Apron); among consumers with incomes of $100,000-plus, 8% have ordered them. Those aged 27–53, Millennial men, and households with kids are the groups that have the highest interest in them (FMI 2017). Sales of meal kits purchased in-store reached $80.6 million (+6.7%) for the year ended (Y/E) March 4, 2017 (Nielsen 2017c).
Millennials are the consumers most likely to brown-bag. Nearly half (48%) prepared breakfast at home but ate it at work or on the go; 54% did so for lunch and 33% for dinner (FMI 2016a).
One in five Millennials and Gen Xers are brown-bagging frozen snacks to work; one in 10 eat in the car. Hispanics are most likely to substitute frozen snacks for meals (Mintel 2016a).
Older consumers are far more likely to eat breakfast than members of other generations; nine in 10 Matures/Baby Boomers prepare and eat breakfast at home versus 74% of Millennials (FMI 2016a).
 Food Preferences
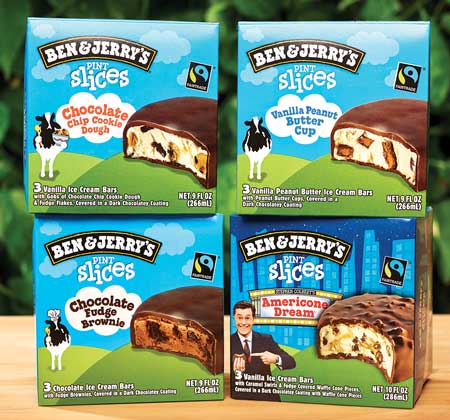
Millennials and Baby Boomers account for nearly two-thirds of the 48% of U.S. adults who describe themselves as foodies (Packaged Facts 2015a).
While those aged 25–44, followed by those aged 18–24, continue to drive purchases in the $127 billion specialty foods category, increased use by other demographic groups has pushed sales up 15% over the past two years (SFA 2017). Parents of young children and Hispanics are among the most frequent specialty food purchasers (SFA 2017).
 Less-affluent consumers (those earning $25,000 to $74,900) now also splurge on specialty cheeses, ice cream, chocolate, coffee/tea, oils/vinegars, desserts, pasta/sauce, and meat/poultry/seafood (SFA 2017).
Millennials are the most frequent purchasers of specialty beverages, gourmet teas, and exotic coffees as well as specialty products in the following categories: meat/poultry/seafood, frozen/chilled meals, pasta/sauces, salty snacks, yogurt, salsas/dips, and nuts/seeds/dried fruit (SFA 2017).
Baby Boomers are most likely to buy specialty ingredients for food preparation as well as gourmet cheese, grains, beans, rice, and oils/vinegars. Snack bars, spreads/desserts, cooking sauces, appetizers, and condiments/dressings are favorites among Gen Xers (SFA 2017).
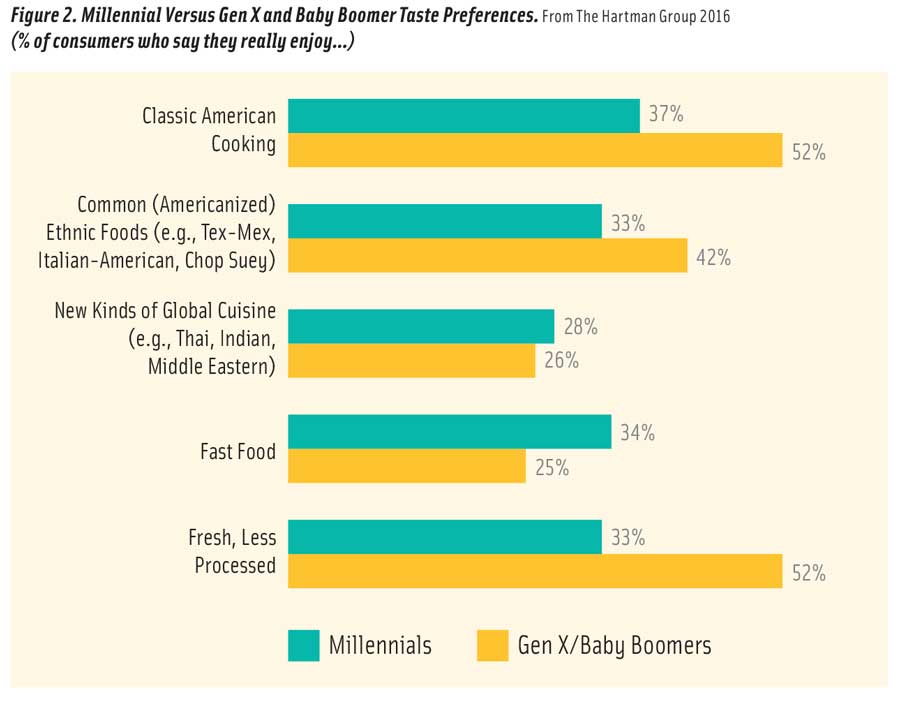
Figure 2. Millennial Versus Gen X and Baby Boomer Taste Preferences. From The Hartman Group 2016.
Older and younger consumers are surprisingly adventuresome in terms of their interest in less-familiar ethnic foods. Older consumers remain the most likely to say they enjoy classic American cooking and more Americanized ethnic foods (Hartman 2016c, Figure 2).
Although Baby Boomers and Millennials are the most frequent fresh department shoppers, younger adults are much more likely to purchase fresh deli items, prepared foods, specialty cheeses, and specialty meats. They also are more likely to shop fresh departments for everyday needs versus for special occasions (IDDBA 2017).
Those living alone are the least likely to shop in fresh departments and represent a huge untapped opportunity for single-portioned items (IDDBA 2017).
More than half (55%) of Baby Boomers regularly choose leaner cuts of meat; 29% of Baby Boomers and 24% of seniors are eating more seafood versus last year. One-quarter of Millennials are eating more meatless meals/meat alternatives; 11% of Boomers are doing so (FMI 2017).
Fresh fruit snacks and juicing/smoothies are some of the fastest-growing fresh areas, of interest to 83% of consumers overall and 34% of households with children (FMI 2016c).
Older Millennials and Gen Xers are driving growth in cheese consumption. Monterey/pepper jack, mozzarella, and feta are of greatest interest to Millennials; cheddar and blue are the top Baby Boomer favorites (Packaged Facts 2016b).
Young adults and households with kids are driving a new early morning snack occasion; 45% of households with kids, 52% of those aged 18–24, and 69% of those aged 25–34 snack in the early morning (IRI 2016).
Meat jerky is especially popular among Millennials, Gen Xers, and Asian-Americans. Consumption of breakfast cereal, granola/snack bars, fruit snacks, and energy/diet bars declines steadily with age; trail mixes are most popular in households with kids (Packaged Facts 2016c, 2017c).
Millennials and Gen Xers as well as households with children are driving interest in alternative snacks; 42% of Millennials had eaten one or more pulse-based snack/s in the past month, but only 10% of Matures had done so, according to recent survey data (Packaged Facts 2017a).
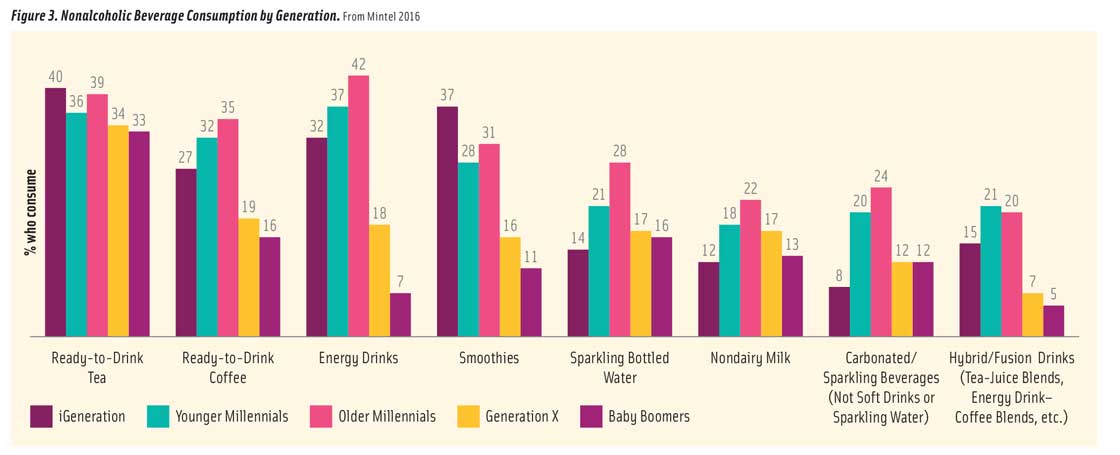
Figure 3. Nonalcoholic Beverage Consumption by Generation. From Mintel 2016
Millennials are driving consumption of the smaller but fastest-growing beverage categories: ready-to-drink tea/coffee, energy beverages, smoothies, nondairy milks, sparkling/flavored waters, and hybrid/fusion drinks (Mintel 2016b, Figure 3).
Four in 10 Millennials drink herbal and/or flavored teas, 30% drink kombucha, and 27% drink functional tea (e.g., energy) (Mintel 2016c). Juice consumption declines with age (Mintel 2016d).
Nearly one-third of Millennial men want functional coffee drinks that provide energy, 29% seek antioxidants, and 23% hope to boost metabolism (Mintel 2016e).
U.S. Hispanics have the highest level of purchase or consumption of dairy alternative beverages formulated with protein (45%), followed by Asian consumers at 42% (Packaged Facts 2016d).
If they could create their own drink, both young and older consumers would select juice and/or tea as the base. Low-/no-calorie would be the most important attribute for older consumers; for younger adults, it is energy and electrolytes (Mintel 2017b).
 No Kidding
Sales of infant formula—the largest health/wellness packaged foods category in the world with 2015 global sales of $47 billion and $4.2 billion in the United States—are projected to grow at a rate of 9.1% annually through 2017 (Euromonitor 2016).
While parents expect teens to eat what the rest of the household eats, kid-specific products are in high demand by parents of those aged 6–12 (Packaged Facts 2016a). In 2016, 42% of all households with kids ate dinner together three night per week or less. Not surprisingly, one in five Millennial parents want more kid-specific meals (Harris 2016).
Healthful kids’ meals, whole grain items, gourmet kids’ meals, kids’ entrée salads, and fruit/vegetable side dishes are among the hot culinary trends for kids’ foods for 2017 (NRA 2016).
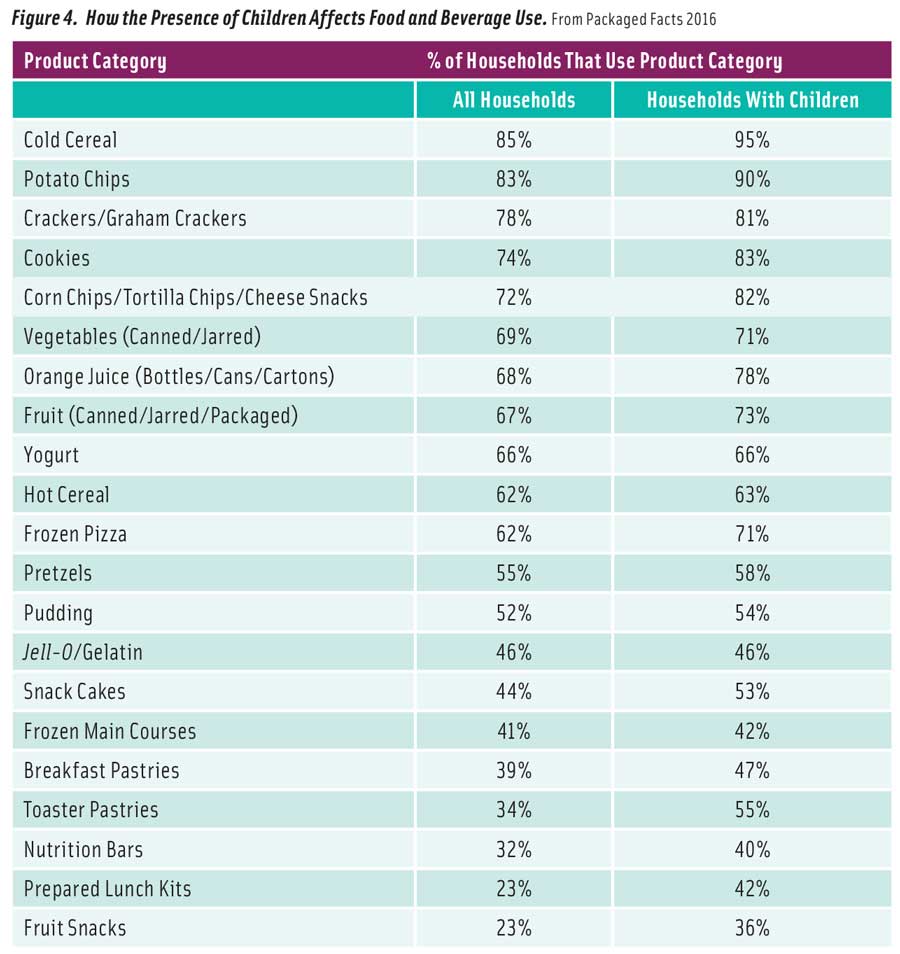
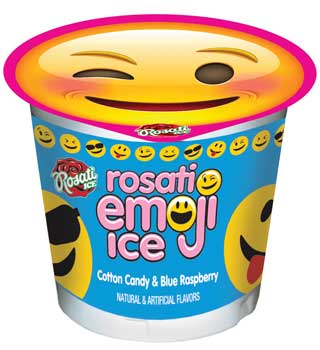
Figure 4. How the Presence of Children Affects Food and Beverage Use. From Packaged Facts 2016
Prepared lunch kits, fruit snacks, toaster pastries, snack cakes, frozen pizza, and orange juice are among the foods used much more frequently in households with kids versus households overall (Packaged Facts 2016a, Figure 4).
Households with kids account for 40% of all snack sales (IRI 2016). Seven in 10 kids under age 11 eat multigrain or whole grain snacks, 58% have snacks made from vegetables, and 45% have snacks made from chickpeas/garbanzos, lentils, beans, or dried peas (Packaged Facts 2017a).
Six in 10 moms with kids under age 6 make a great deal of effort to choose non-GM products, 46% seek organic products, and 33% look for all natural. Among those with kids aged 6–11, 45% look for organic products and 30% for all-natural (Packaged Facts 2016e). One-third of households with kids carry food to school and/or work; 31% buy snacks to consume in transit (Packaged Facts 2016a).
Generational Health
When it comes to health and wellness practices, the gap between the generations appears to be closing (Hartman 2016c). Just over half of Millennials and Baby Boomers say they’re developing healthier eating habits. One-third of each group has made changes to their diet to manage a health condition, and 45% are regularly exercising to reduce stress (Hartman 2016c).
Consumers under age 50 are most likely to be trying to manage conditions that impact their everyday performance (e.g., mental sharpness, strength, energy/tiredness, stress, immunity, and back, neck, or muscle pain) (HealthFocus 2015).
The list of top health concerns among older consumers includes having the ability to continue with normal activities and remain mentally sharp as they age; eye, bone, muscle, and heart health; and medical conditions often associated with aging, such as joint pain/arthritis or diabetes (HealthFocus 2015).
Twenty-five percent of those aged 65-plus have diabetes (ADA 2016). Two-thirds of the 50 million Americans suffering from arthritis are under age 65 (AF 2015).
Forty-five million women and 41 million men have high blood pressure; 52 million women and 42 million men have cholesterol levels greater than 200 mg/dL. Blacks are the most likely to have high blood pressure; white women and Hispanic men are the most likely to have high cholesterol (AHA 2017).
Millennials are the most likely to report digestive issues such as indigestion, gas, bloating, diarrhea, constipation, heartburn, and nausea (Mintel 2016f).
 Twenty-eight percent of U.S. households currently have a member actively trying to lose weight, 20% include someone with diabetes, 8% include someone with lactose intolerance, and 3% include someone with gluten issues (Nielsen 2017d). Stroke prevention, circulation, mobility, sarcopenia, diverticulitis, regularity, and blood sugar control are very real concerns for Boomers/Matures.
The $37 billion sports nutrition market continues to move mainstream, and many Americans recognize the benefit of staying active. In 2016, 65% of those aged 18–29, 55% of those 30–44, 53% of those 45–64, and 50% of those 65-plus exercised three-plus days per week (Gallup 2016).
Forty-one million adults over age 50 are exercise walkers, 12 million enjoy aerobics, 9.2 million work out at a gym, and 3.6 million jog (NSGA 2016). Only 26% of those aged 25–44, 21% of those aged 45–64, and 15% of those aged 65-plus meet government guidelines for muscle strength (HHS 2014).
Health concerns aren’t limited to older members of the population. The percentage of Millennials who are very or extremely concerned about the nutritional content of their food is now on par with other generations (FMI 2016a). Moreover, their increased use of supplements is credited with sending supplement sales to an all-time high.
Two-thirds of Millennials take a multivitamin; 43% take vitamin C; 32%, vitamin D; and 30%, B vitamins. Fiber, probiotics, digestive enzymes, collagen, and keratin are the specialty supplements most used by Millennials (CRN 2016).
 Green tea, cranberry, ginseng, ginkgo biloba, and echinacea are Millennials’ most used botanicals. One in five use sports nutrition protein powders; 15%, creatine; 11%, amino acids; and 11%, green coffee (CRN 2016).
Low sodium is the top health claim sought by Matures; two-thirds of those in this segment are looking for low-sodium products. That is followed by low sugar, sought by 49%; no trans fats, 46%; high fiber, 39%; and no artificial ingredients, 37% (FMI 2016a).
Nearly six in 10 adults aged 25–39 and 48% of those under age 25 are trying to get more protein. Interest in plant protein is highest among those aged 25–39, Asians, and Hispanics. More than half of those aged 25–39 eat high-protein bars (Packaged Facts 2016d).
Those aged 55-plus are the least interested in protein. With rising concerns over mobility and muscle health with age, targeting protein for older consumers is a very big idea, however (Packaged Facts 2016d).
Use of energy beverages and sports drinks is highest among men aged 18–24, with 53.2% and 26.1%, respectively, consuming energy beverages and sports drinks in 2016. Usage falls rapidly with age, especially for energy drinks. African-Americans and Hispanics also over-index for consumption (Packaged Facts 2017d).
Although generally women are less likely to consume sports drinks, Millennial women are an exception; they overindex for consumption versus their male peers. Similarly, women aged 50-plus also exceed their male counterparts in terms of energy drink consumption.
Consumers with one or more children in their household are significantly more likely to purchase energy and sports drinks for themselves. Having a single child in the home is sufficient to see this bump in reported usage, and energy drink usage tends to increase with each additional child (Packaged Facts 2017d).
 Clearly Sustainable
Millennials are the consumer segment most familiar with the terms minimally processed and eating clean; 67% are familiar with the former phrase and 66% with the latter (FMI 2016d). Three-quarters of younger adults actively seek out cleaner food/beverages versus 57% of Matures (Mintel 2016g).
Three-quarters of Millennials purchased organic foods in the second half of 2016; 62% of Gen Xers, 51% of Boomers, and 50% of Matures did so (FMI 2016d). Asian-Americans, parents with kids under age 6, upper-income households, and those aged 25–34 remain top users (Packaged Facts 2016e).
Organic produce is most important to Gen X (66%) and Millennials (64%) versus 45% of Matures. One in 10 Millennials shopped for produce at a farmers’ market last year (FMI 2016c). Millennial consumer purchases of organic bakery items jumped 39% in 2016 (IDDBA 2017).
Awareness of GMOs declines with age. In 2016, 75% of Millennials were aware of GMOs; Gen Xers, 69%; Baby Boomers, 67%; and Matures, 57% (FMI 2016d). One-quarter of Millennials, Gen Xers, and Boomers looked for non-GMO on food labels in 2016 versus 18% of Matures (FMI 2016a). Moms with kids under the age of 11 are the most concerned about GMOs (Packaged Facts 2015b).
In the meat department, hormone/antibiotic-free, animal welfare, raised locally, and grass-fed are the attributes that draw high interest across all ages; Millennials are the key drivers of natural and organic product sales (FMI 2017).
 Four in 10 Millennials would pay 20% or more for food products made, grown, or raised in the United States; one-third of Baby Boomers and Matures would do so (FMI 2016c). Interest in local foods is highest among those aged 55–64 (NRA 2017). Boomers are most likely to think that farmers are a more important partner than their primary grocery store in helping them to say healthy (FMI 2016a).
Millennials (39%) are most likely to experiment with specialized eating plans/diets, followed by Gen Xers/Boomers (each 26%), and Matures (25%). Young adults are especially likely to try a vegetarian, vegan, paleo, or juice cleanse regimen. Baby Boomers favor high-protein diets or lactose-free, and Matures go for lactose-free and/or the Mediterranean or DASH diet plans (FMI 2016a).
Adult U.S. Hispanics are the heaviest users of dairy alternative beverages formulated with protein, followed by Asian consumers (Packaged Facts 2016d). Use of meat alternatives decreases with age. Six in 10 Millennials ate meatless burgers, poultry, or crumbles last year (Mintel 2017c).
Millennials remain the most likely to say they would pay 20% more for products that are made in an environmentally friendly and sustainable way; willingness declines with age. Six in 10 Millennials say they usually buy products from companies whose values are most like their own versus 47% of Matures (NMI 2017).
Moreover, more than two-thirds of Millennials would like a product label that conveys information about a product’s safety, environmental impact, and performance; 69% of Boomers and 66% of Matures are interested in that (NMI 2017).
A. Elizabeth Sloan, PhD, a professional member of IFT and contributing editor of Food Technology, is president, Sloan Trends Inc., Escondido, Calif. (lizsloan@sloantrend.com).
Hero Image: © mediaphotos/iStock, © liza5450/iStock/Thinkstock, © Kobyakov/iStock/Thinkstock
Categories
-
Food Business Trends
-
Food Health Nutrition
-
Consumer and Marketplace Trends
-
Sustainability
-
Obesity and Weight Management
-
Food Technology Magazine


