It’s Time for Restaurant Realignment
A growing role in everyday meal preparation, on-demand delivery, and a new fine fast casual sector will help make restaurants more competitive for America’s food dollars than ever before.
Article Content
Although restaurant industry sales reached an all-time high of $799 billion in 2017, up 1.7% when adjusted for inflation, and captured 48% of America’s food dollars, it’s been another tough year for the foodservice industry and anything but business as usual (NRA 2017a).
For the year ended in spring 2018, the number of U.S. restaurants fell 1% to 660,755; the number of independent restaurants is down 2% (NPD 2018a).
Although foodservice spending rose 2% for the year ended May 2018, growth was primarily due to the rising cost of a restaurant meal, according to NPD/CREST; total foodservice visits were flat (NPD 2018b).
Fast casual was the only restaurant sector to increase traffic, up 5% for the year ended May 2018, although growth was at a lower rate than in previous years (NPD 2018c).
Consumers are not dining out more often, but they’re increasingly turning to foodservice for help with in-home meal preparation. Nearly half of dinners purchased at a restaurant were eaten at home in 2017; one in five at-home dinners used at least one foodservice item (NPD 2018b).
Only 37% of restaurant visitors ate their meal in the restaurant last year; 39% of visitors purchased carry-out, 22% did drive-through, and 3% opted for delivery. Patrons dined off-premise on 70% of quick-service restaurant (QSR) and coffee/snack shop visits, 49% of fast casual, 20% of family dining, 15% of casual dining, and 7% of fine dining trips (Riehle 2018).
Restaurants need to better align with America’s changing lifestyles, and the optimal timing for doing so is now. Nearly half (46%) of Boomers, 39% of Gen Xers, and 31% of Millennials say they’re not eating at restaurants as often as they would like (NRA 2017a).
Consumer economic confidence is at a 17-year high, and unemployment continues to fall. The U.S. Gross National Product grew 4.2% in the second quarter of 2018; gas prices are at their lowest level since 2014. The number of high-income households (over $100,000), which account for six out of 10 restaurant dollars, continues to grow (Riehle 2018).
Moreover, home meal preparation is at an all-time low, falling from 4.9 dinners per week to 4.6 in the past year; it is 4.0 for Millennials without children (FMI 2018a).
Business Bites
In 2017, sales growth was driven by limited-service chains, up 4.1%. Fast casual was the leading subsegment, with sales up 8.9%. Full-service sales growth was flat, up 0.5% in 2017 (Technomic 2018a).
Hospitals/nursing homes, snack/nonalcoholic beverage bars, recreation/sports centers, college/universities, and mobile caterers were other foodservice sectors posting respectable growth (NRA 2017a).
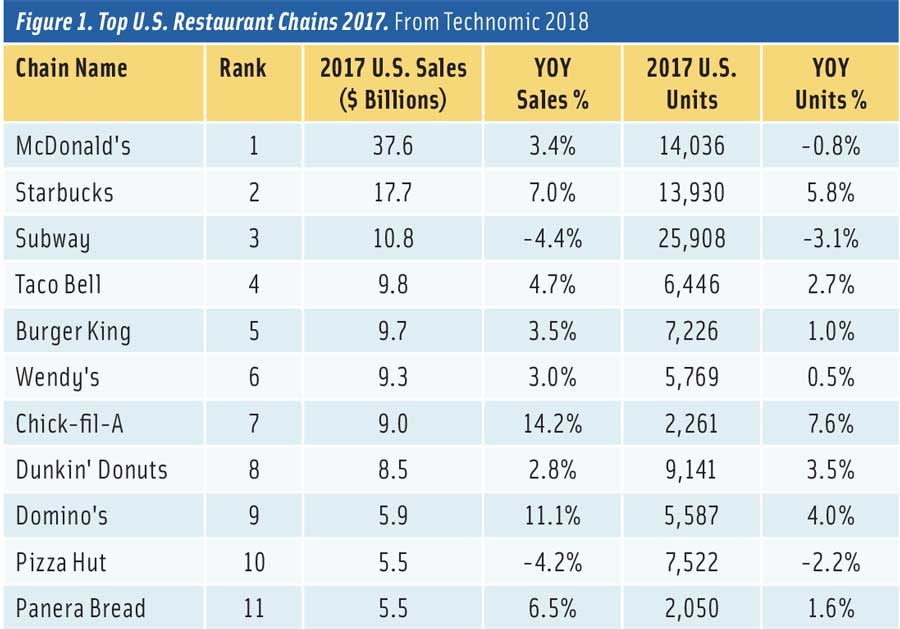
McDonald’s remained the largest QSR chain with U.S. systemwide sales of $37.6 billion in 2017, followed by Starbucks with $17.7 billion in sales. In one notable change on the top chain list, Chick-fil-A moved ahead of Dunkin Donuts last year. See the full list of top chains in Figure 1 (Technomic 2018a).
The fastest-growing restaurant menu segments were bakery-café, with sales up 7.7%; chicken, +7.3%; limited-service Mexican, +6.8%; convenience stores, +4.8%; and beverage/snack, +4.7% (Ruggles 2018).
QSR’s $1, $2, and $3 menus were a success, driving value menu traffic up 10% and value spending up 13% in the first quarter of 2018 (NPD 2018d).
Over the past five years, delivery drove a 10% gain in restaurant visits and a 20% increase in delivery sales. While dinnertime still dominates, 5% of delivery traffic is now at breakfast, 29% at lunch, and 7% for p.m. snacks (NPD 2018e).
Millennials, who are now starting to have families of their own, are the primary foodservice consumer, with 80% visiting a restaurant at least once a week. Among members of Gen Z, 70% visit a restaurant at least once weekly, followed by Gen X at 67%, and Baby Boomers at 53% (Technomic 2018b).
Millennial parents are increasing restaurant visits faster than any other group (Technomic 2017a). With Millennial parents already spending half (49%) of their food dollars on specialty foods, upgrading kids’ menus and catering to little diners is a big opportunity (SFA 2018).
Hispanics dine with their children on 42% of their restaurant visits versus 30% for non-Hispanic families (Veneziale 2017).
Healthy kids’ meals rank sixth among the overall hot culinary trends for 2018. Important trends for kids’ meals are ethnic inspired, gourmet, whole grain, and grilled and oven-baked items (NRA 2017b). Freshii is one of the first restaurant chains to offer a healthy school lunch program for kids.
Lastly, it’s time to gear up for Gen Z, whose oldest members are now 18–23. Chick-fil-A is Gen Z’s favorite fast food restaurant, followed by McDonald’s and Taco Bell. Chicken is their preferred dinner entrée (Ypulse 2018).
Gen Z has the highest percentage of specialty foods users (SFA 2018). Nearly half (45%) of older Gen Zers watch online food videos often or very often, and 42% frequently watch cooking shows; 35% post pictures of food on social media (Ypulse 2018).
Half of older Gen Zers have eaten food from a food truck; one-third have tried nondairy milks, quinoa, sparkling drinks, and cold brew coffee. In addition, one-quarter have had avocado toast, artisan/local foods, superfoods, fusion cuisine, fake/vegan meat, and spiralized/riced vegetables. One in five has tried poke, sushi, kombucha, meal kits, and bento box meals (Ypulse 2018).
Sweet flavors are most appealing to Gen Z. Fruity, smoky, spicy, bold, salty, tangy, herbal, and sour flavors are significantly more appealing to Gen Z than to the general population (Technomic 2017b).
All natural, organic, local, and GMO free are the health claims of greatest importance to Gen Z. Nine in 10 want to add more plant-based foods to their diet; a vegan claim enhances appeal for 29% (Culinary Visions 2018).
Retail Foodservice Soars
Supermarket foodservice sales reached $32.5 billion in 2017, up nearly $2 billion versus 2016; convenience store foodservice sales were $21.0 billion; and foodservice sales in all other retail locations reached $13.2 billion (Technomic 2018b). After produce, grocery retailers rank deli/fresh prepared foods as the most important department for driving store traffic (Goldschmidt 2018).
In 2017, 57% of U.S. households bought retail ready-to-eat fresh prepared food (e.g., rotisserie chicken, sandwiches, or sushi) often, sometimes, or every time they shopped; 53% bought heat-and-eat items, (e.g., fresh pizza, soups, or casseroles). Households with kids were most likely to do so (FMI 2017).
For the year ended June 17, 2018, IRI reports that sales of fresh prepared entrées topped $5.5 billion, up 3.0%; sales of fresh prepared sides were $2.9 billion, +4.8%; prepared lunches, $2.5 billion, +12.8%; salads, $2.0 billion, +3.7%; sandwiches, $1.8 billion, +0.2%; appetizers, $1.7 billion, +8.0%; breakfast entrées, $558 million, +16.9%; fresh soup, $356 million, +22.3%; and fresh dips/sauces, $266 million, +11.1% (Dubois 2018).
Sales of fresh prepared tacos jumped 78%; quiche, +49%; holiday meals, +44%; lasagna, +40%; and chef salads, +35% (Dubois 2018). Couscous, Asian appetizers/entrées, sushi, kids’ meals, and chef-prepared daily specials also posted strong gains (FMI 2018a).
In 2017, 62% of supermarket chains offered self-service prepared food bars, 44% had fast casual stations, and 13% featured full-service restaurants. Retailers view fast casual restaurants as their primary foodservice competitor (Hamstra 2018).
In February 2018, 39% of convenience store visitors bought a fresh prepared deli sandwich; 36% bought a hot dog; 28%, pizza; 23%, a breakfast sandwich; and 12%, a hot snack other than french fries (Lisanti 2018).
Half of fast casual restaurants, one-third of QSRs, and one-quarter of family restaurants offered packaged food items for sale last year. Four in 10 restaurant operators put more emphasis on catering (NRA 2017c).
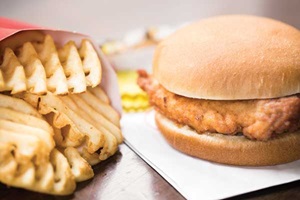 Six in 10 Millennials, Gen Xers, and members of households with kids would buy meal kits from their favorite restaurants. Chick-fil-A is rolling out meal kits in its home Atlanta market. Four in 10 chefs cite food halls as a hot trend for 2018 (NRA 2017b,c).
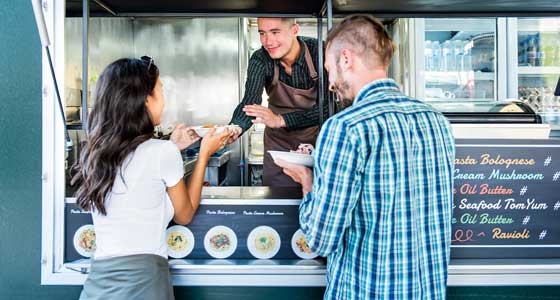
Street vendors, including America’s more than 2,000 food trucks, account for $3 billion in foodservice revenues, up 4.2% over last year (IBIS 2018).
The Urge to Splurge
Eight in 10 restaurant operators say their guests know more about food and make more adventuresome choices than they did two years ago (NRA 2017c).
Three-quarters of consumers are more likely to visit a restaurant that offers new flavors. Savory flavors are appealing or extremely appealing to 65% of adults; sweet flavors appeal to 52%; smoky, 51%; spicy, 49%; ethnic, 45%; bold and tangy, each 43%; fruity, 40%; herbal, 35%; salty, 31%; and sour, 20% (Technomic 2017b).
Nearly half of those aged 18–34 say their preferences change with the season. Younger adults are twice as likely as Boomers to order ethnic foods at least once a week (Technomic 2017b).
Half (48%) of Millennial diners are very interested in Mediterranean cuisine; 46% are very interested in Japanese/sushi; 39%, Thai/Vietnamese; 36%, Indian; 33%, Middle Eastern; and 28%, Korean (FMI 2018a).
American Culinary Federation chefs cited Peruvian, African, Filipino, and ethnic fusion cuisines among the hot global flavors for 2018 (NRA 2017b). Global barbecue variations, Szechuan, Israeli, and Asian Island cuisines are also getting attention.
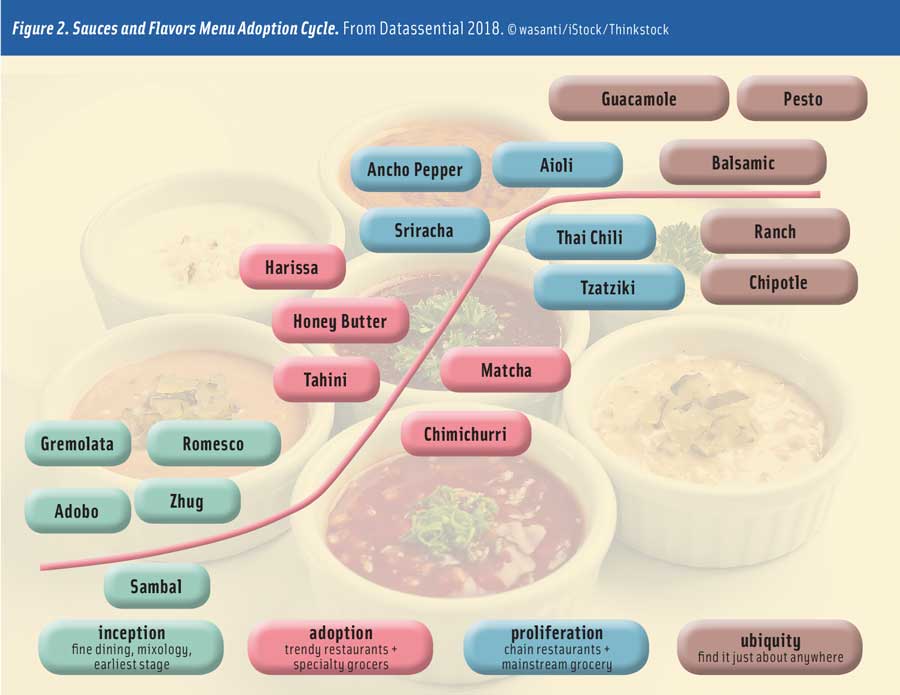
Roman-style pizza, Chinese crepes, gyros, arepas, arancini, rou jia mo, choripán, currywurst, pupusas, and falafel are among the global street foods well matched for U.S. market entry. Harissa, honey butter, and tahini are sauces/flavors well poised to move mainstream (Datassential 2018; Figure 2).
Use of the term fermented has grown 46% on U.S. menus over the past four years; kombucha, +226%; gochujang, +200%; kefir, +101%; kimchi, +92%; pickled, +55%; and fish sauce, +54% (Datassential 2018).
Watch for greater use of eye-catching varietals and exotic fruits (e.g., purple rice and Chinese eggplant). Chef specialty butters, tapenade, house-made vinegars, and seasoning with tea (e.g., Earl Grey) are other new directions.
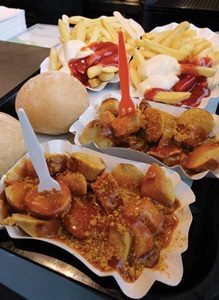 Burrata, cheese curds—often used as a side or in poutine, beer cheese, vegan cheese, jalapeño cheddar, and pimento are among the fastest-growing cheeses in restaurants, along with raclette (Datassential 2018).
Oaxaca, Mexican, manchego, Cotija, fontina, Gournay, butterkäse, queso de papa, Jarlsberg, and panela are other fast-growing specialty cheeses (IDBA 2018).
Gluten-free buns, pretzel bits, brioche, bao buns, potato rolls, and naan are among the fastest-growing breads on menus over the past four years. Lavash, ancient grain, telera, and roti are in what Datassential terms the “Inception Cycle” (Datassential 2018).
Egg rolls are the ethnic appetizers most likely to be ordered in restaurants, followed by Mexican favorites (e.g., nachos), Asian spring rolls, pot stickers, lettuce wraps, and sushi/ceviche (Technomic 2017c). TGI Friday’s Endless Appetizers now include Philly Cheesesteak Egg Rolls.
Lastly, consumption of sweet treats/snacks increases as the day goes on. Ice cream, cookies, brownies, cake, cupcakes, frozen pies, and frozen yogurt are the most frequently purchased sweet snacks. One in five consumers buy ethnic desserts such as churros (NPD 2017).
Thai-rolled ice cream, doughnuts with nontraditional filling, artisan house-made ice cream, savory desserts, and smoked dessert ingredients are the top dessert trends for 2018 (NRA 2017b).
Tarts, eclairs, cobblers/crisps, cannoli, cream puffs, and baklava are best-selling specialty desserts (IDDBA 2018). Expect mini international desserts to grab the spotlight (e.g., panna cotta, mille-feuille, macaroons, crostoli, rum cakes, Limoncello tarts, arroz con coco, and cassata.
The Daypart Dilemma
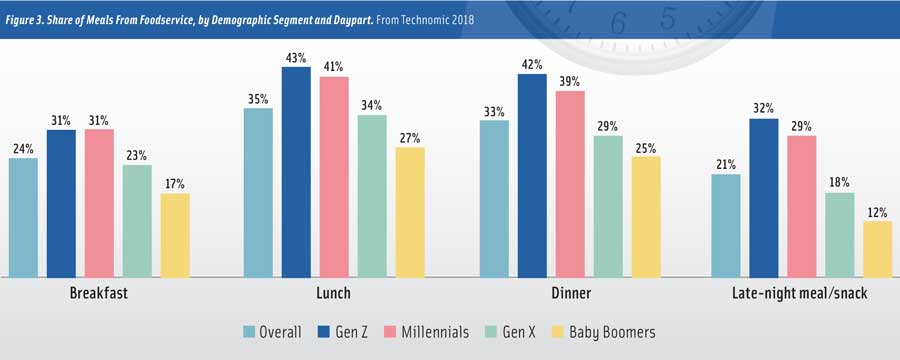
Lunch has edged out dinner as the meal most often sourced from foodservice (Technomic 2018c; Figure 3). Four in 10 family, casual, QSR, and fast casual restaurant operators plan to put more effort into growing their dinner business; for fine dining restaurateurs, the figure is 66%. In addition, one-third are looking to grow lunch business; one in 10 seek to build breakfast business. Fewer than 7% are working to grow snack time sales (NRA 2017c).
The top overall hot culinary trend for 2018 that is helping to drive dinnertime sales are new cuts of meat (e.g., bavette, coulotte, and Denver steaks) (Glazer 2018). Grass-fed, local, and heritage meats; slow growth chickens; Australian lamb; and specific breeds are other premium meat directions.
Jack-in-the-Box’s Triple Cut Premium Burgers feature three cuts of beef—sirloin, chuck, and brisket. Bacon Smokehouse Artisan Grilled Chicken is new at McDonald’s.
Stacking, layering, and blending meat with vegetables to reduce calories are among the most exciting QSR trends. Sonic’s limited-time Signature Slinger is a lower-calorie (340 calories) burger made with 25% chopped mushrooms and 75% ground beef. Taco Bell introduced the Steak and Egg Stacker, a breakfast sandwich; KFC offers the Zinger Stacker Burger.
Fries have become the latest iconic restaurant item to undergo an upgrade. Taco Bell’s Nacho Fries on its Dollar Cravings menu sold more than 53 million orders in the first few weeks they were available (Luna 2018). Arby’s introduced Gyro Loaded Curly Fries, while other restaurants capitalize on the growing popularity of poutine.
While shrimp, salmon, and tuna remain the most consumed fish/seafood, trendy varieties include bluefin tuna, octopus, and branzino. Ceviche, sushi, poke, and seafood charcuterie are finding their way onto menus (NFI 2017).
Red Lobster now offers Canadian Walleye, Wild-Caught Flounder, Rock/Caribbean Lobster Tail, and Yucatan Tilapia and Shrimp.
Shellfish has grown 40% on breakfast menus since 2007; 90% of consumers have eaten seafood as a snack (Datassential 2018).
Burgers, deli, breakfast, submarine, and chicken remain America’s most ordered sandwiches away from home. Four in 10 of those who order sandwiches at foodservice ordered at least one wrap away from home per month; 39% ordered a salad sandwich; 30%, a panini; 29%, a flatbread sandwich; and 25%, an ethnic sandwich (e.g., banh mi, tortas, Cubano) (Technomic 2018d).
All-day breakfast continues to drive sales; 54% of consumers overall and 60% of Millennials would order more breakfast items if they were available throughout the day (NRA 2017c).
Restaurant traffic for breakfast and morning snacks was up 1% for the year ended February 18, 2018. Lunch visits were flat, and dinner traffic was down 1% (Thorn 2018).
Ethnic-inspired breakfast items (e.g., latkes), overnight oats, breakfast hash, and avocado toast are among the hot breakfast culinary trends (NRA 2017b). Lighter breakfasts, grain-based bowls, and unique breakfast sandwich carriers (e.g., IHOP’s Signature Pancake Sliders) are other trends in early morning fare.
Chefs are also using traditional sides (e.g., fries, rice, grains, and beans) and classic sauces (e.g., Béchamel) at breakfast time. Chilaquiles, migas, frittatas, egg yolks, slow cooked eggs, deviled eggs, and shakshuka are the fastest-growing egg dishes on menus (Datassential 2018).
With one-third (34%) of adults eating a “second breakfast” midmorning, it’s no wonder that two-thirds of consumers, including 84% of men aged 25–34, find breakfast so appealing (Technomic 2018e).
Watch for more savory signature items (e.g., El Monterey Breakfast Empanadas) aimed at increasing morning hot case sales in convenience stores. Think miniature quiches/muffins, high-protein bacon/sausage cups, or grain-based signature smoothies.
Just about one-quarter of consumers say that beverage offerings are very important when deciding where to go for a meal; 31% like to try new unique restaurant drinks (Technomic 2018f).
House-made artisan soft drinks, cold brew coffee, gourmet lemonade, locally/house-roasted coffee, and specialty iced tea are the top culinary nonalcoholic drink trends for 2018 (NRA 2017c).
Two-thirds of consumers say they’re more likely to buy a beverage that is fresh brewed. For 54%, locally produced is an incentive; antioxidant-rich encourages 52% to make a purchase; and 43% are influenced by probiotic content (Technomic 2018f).
Carbonated beverages, tea, coffee, and juice are the beverages most frequently menued. Only 44% of restaurants offer bottled water; 36%, dairy milk; 7%, coconut milk; 2%, soymilk; 2%, almond milk; and 2%, sports or energy drinks (Packaged Facts 2018).
Alternative milks and ready-to-drink dairy-based coffee/tea drinks are the top beverages increasingly used for snacks (Lyons Wyatt 2018). Among niche categories, coconut water, alkaline water, cold brew coffee, kombucha, protein drinks, and green/pressed smoothies have the most positive momentum in 2018 (BMC 2018).
Sonic’s nonalcoholic half-price beverage happy hour is the ultimate drink destination, with more than 168,000 drink combinations.
Naturally Good
The availability of healthy menu items is the reason that 70% of consumers would choose one restaurant over another; 40% are influenced by diet-specific foods. Millennials, adults with kids, and Boomers are more likely to do so (NRA 2017c).
Avoiding appetizers and desserts is the most popular healthy eating strategy away from home. Four in 10 consumers say menu labeling with calorie counts has influenced their order (NRA 2017c).
Natural ingredients, minimally processed, organic, gluten-free, and house-made items are the most popular trends at limited-service restaurants. Six in 10 fine dining operators offered menu items grown or raised in an organic or environmentally friendly way; half of QSR, casual, and fast casual operators did so (NRA 2017c).
Veggie-centric/vegetable-forward cuisines (e.g., cauliflower risotto or zucchini pizza crust) are among the hot culinary concepts for 2018; vegetable substitutes for traditional carbohydrate foods ranked sixth overall (NRA 2017b).
Four in 10 consumers are trying to eat more plant-based foods. Nearly two-thirds of Millennials want more plant-based ingredients mixed into wraps and burritos; 51% are interested in meat blended with grains and veggies (Datassential 2018).
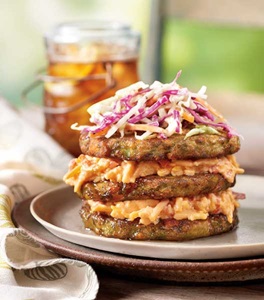 Forty-five percent of chefs cite vegan as a hot trend; 44% mention vegetarian cuisine (NRA 2017b). Tampa Maid Foods’ stacked Vegetable Patties will offer a healthy halo to any menu.
Ancient grains (e.g., kamut, spelt, amaranth, and lupin) ranked fifth among the overall hot culinary trends for 2018; protein-rich grain and seeds (e.g., hemp, chia, quinoa, flax) were 16th. Non-wheat noodles/pasta, farro, and black/forbidden rice are other strong trends (NRA 2017b).
One-third of operators expect restaurant sales of fruits and vegetables to increase this year (NRA 2017c). Kale, brussels sprouts, Little Gem lettuce, roasted carrots, and spaghetti squash are among the fastest-growing vegetables on restaurant menus (Datassential 2018).
Watch for seaweed, nori, kelp, and other sea-based vegetables to make their way onto menus; 16% of adults bought a snack made from sea vegetables last year; 28% of Millennials did so (Packaged Facts 2017).
When dining out, 30% of consumers adhere to a specific diet, led by those aged 65 and over; 94% of QSR operators said they saw more customer interest in diet-specific foods last year versus two years ago (NRA 2017c).
Expect the trend in support of food restrictions, allergies, and intolerances to continue; Gen X and Millennial parents were 40% more likely than earlier generations to believe their kids suffered from these conditions (Packaged Facts 2014).
Sixty-three percent of consumers are trying to get more fiber in their diet; 60%, more protein; 58%, more whole grains; 57%, more nuts/seeds; 51%, more olive oil; 39%, more healthy fats; 32%, more plant-based protein; 31%, more grass-fed beef; 29%, more coconut oil; and 28%, more grass-fed dairy (Hartman 2017).
Blueberries top the list of the most sought after superfoods, with 63% of consumers seeking them out, followed by avocado, sought by 60%; green tea, 50%; kale, 44%; cinnamon, 44%; coconut oil, 42%; ginger, 40%; quinoa, 36%; flax, 34%; and turmeric, 30% (Label Insights 2017).
In mass food retail, dollar sales of products with a GMO-free claim grew 28%; sales of products with a good source of protein, energy, no antibiotics, or organic claim, were each up 10%; gluten-free and no dairy were each up 8%; lactose-free, +6%; and no preservatives, +5%, for the year ended May 20, 2018 (Dubois and Parker 2018).
Sustainable Directions
Two-thirds of guests cite locally sourced foods as a reason they would choose one restaurant over another; 60% are looking for an environmentally friendly dining destination. Fine dining restaurants are the most likely to offer local foods (84%), followed by casual dining (63%) (NRA 2017c).
Nearly one-third of fine dining restaurants have an on-site garden (NRA 2017c). Hyperlocal and farm/estate branding are among the top hot culinary concepts for 2018 (NRA 2017b).
Two-thirds of consumers say humanely raised and/or antibiotic-free/hormone-free claims make them most likely to order meat/poultry; all natural, vegetarian fed, grass fed, free range, and organic are other influential descriptors (FMI 2018b).
Subway, Sonic Drive-In, Burger King, TGI Fridays, Aramark, and Sodexo are among the foodservice companies committing to provide more humane conditions for food animals.
Nearly half (47%) of restaurants track food waste, 22% donate leftover food, and 14% compost food waste. Two-thirds recycle cardboard and paper; 64% recycle fats, oils, and grease; 29%, cans; 29%, rigid plastics; and 26%, glass (NRA 2018).
McDonald’s recently pledged to cut greenhouse gas emissions 36% by 2030 and says it will focus on environmentally friendly restaurant upgrades and responsible sourcing (Kybam 2018).
A. Elizabeth Sloan, PhD, a member of IFT and contributing editor of Food Technology, is president, Sloan Trends Inc., Escondido, Calif. ([email protected]).


