
Measuring Color with Machine Vision
Machine vision systems offer advantages over visual and instrumental analysis,including the ability to measure nonuniform colors and shapes and to inspect specific areas of the image.
Color is an important component of food quality—consumers initially accept or reject a food based on its color and other visual attributes—and can be measured by visual, instrumental, and machine vision methods.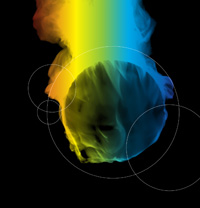
However, visual observations may be unsatisfactory due to eye fatigue, poor color memory of subjects, lack of uniform lighting and standardized viewing conditions, and unavailability of trained judges, especially for routine large-scale color quality determination (Hutchings, 1999).
Instrumental Measurements
Colorimeters and spectrophotometers have been used extensively in the food industry to quantify color. Tristimulus colorimeters employ filters to convert the energy of the light reflected off of or transmitted through the sample into X, Y, and Z values that locate the color of the sample in a 3-dimensional color space. They simulate the response of the standard observer and can match most colors across the visible spectrum. Spectrophotometers calculate X, Y, Z values by measuring reflectance or transmittance wavelength across the visible range. The resulting spectral curve is compared to a reference standard, and the result is expressed as a ratio (Joshi and Brimelow, 2002).
Colorimeters and spectrophotometers rely on precise knowledge of the illumination and the standard observer function defined by the Commission Internationale de L’Eclairage (CIE), the global governing body for light and color measurements, to calculate the averaged spectral data of the sample area. Because of this averaging, colorimeters may not actually measure what humans see in the color of objects. Tristimulus values can be converted to many other color systems.
There are two categories of instruments—directional and diffuse—based on the arrangements of the light source, the sample plane, and the detector. They view the sample differently and may generate different color results. Directional instruments (also called 45/0 or 0/45 devices) measure only the diffuse reflectance coming from the sample; the specular-reflected light is not measured. Diffuse geometry instruments can measure both the diffuse and the specular reflectance. This makes a difference in the color values measured from a glossy vs a matte surface.
Therefore, the user must be aware of the type of instrument, as well as the history of the color measurement of any reference tiles used to make comparisons. Specifically, the reported color of a reference tile measured by a diffuse geometry may not be reproduced exactly when the same tile is read by an instrument using the 45/0 geometry. The size of the viewing aperture and the illuminated area may also affect results.
These variables, as well as the method of calibration, the description of standards, and the preparation and presentation of samples, should be well thought out to have accurate and reproducible measurements of color of foods.
--- PAGE BREAK ---
There are potential disadvantages in using colorimeters and spectrophotometers that machine vision can overcome. One problem may arise when the sample has nonhomogeneous colors. In such cases, color values obtained with repeated measurements on a surface or from different samples in the same batch are averaged (Joshi and Brimelow, 2002). Consider Figure 1, where the color of peppers is measured. If a spectrophotometer or a colorimeter were used, the result would be the “average” color, displayed by the brown square. This results in a significant loss of color information. In reality, there are many more colors than brown. Figure 1 also shows a 512-color segmentation scheme obtained using machine vision. Both the amount and the definition of colors are quantitative.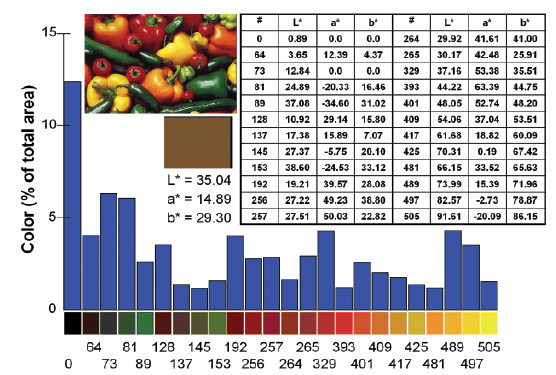
Another potential problem is the size and shape of the sample. For example, shrimp may be too small to cover the viewing aperture of the instrument. One solution is to grind the sample. However, this changes the appearance and potentially the color of interest of the sample. A user looking for black spots in shrimp, for example, won’t find them, since they will disappear into the mix.
Machine Vision
Machine vision (MV) involves a camera connected to a computer, controlled lighting (generally in the form of a light box), and the software to control camera settings, image acquisition, and processing. The sensor in the camera is a charge-coupled device (CCD) that converts photons to electrical signals. Once an image is captured, it can be immediately evaluated or stored for future analysis and comparisons. As such, MV provides documentation and recordkeeping.
A significant difference between conventional colorimetry and color MV is the number of signals. There are 262,144 sensing elements (512 x 512 pixels) in a CCD camera as opposed to 3 signals in colorimeters, and a maximum of 471 signals (one for every nanometer between 360 and 830 nm of wavelength) in spectrophotometers. Thus, color MV systems offer a tremendous amount of information compared to conventional instruments. High-spatial resolution enables MV systems to isolate and specify appearance features such as color pattern, gloss, and surface texture attributes not delivered by conventional instrumentation.
MV allows color measurement of nonuniform shapes and colors (Korel et al., 2001; Papadakis et al., 2000). As long as the sample fits into the view area of the camera, its color(s) can be measured. More than one object can be analyzed at the same time. Since every pixel of the sample image is analyzed, the “average” color of each object can also be calculated, emulating the output of a colorimeter, regardless of sample size and shape. For example, the correct average color of one shrimp or a whole salmon can be ead, provided that it fits in the light box. In Figures 1 and 2, the squares with uniform color represent the “average” color of the samples. These are the colors that would be obtained using a colorimeter or a spectrophotometer, and they differ from what the human eye sees (Balaban et al., 1994; Luzuriaga et al., 1997).
--- PAGE BREAK ---
Using software such as the ColorExpert program from Engineering and CyberSolutions, Gainesville, Fla., MV can provide the color spectrum of an object with nonuniform colors. In Figure 2, the color spectrum of salmon is given as percentages of the view area. 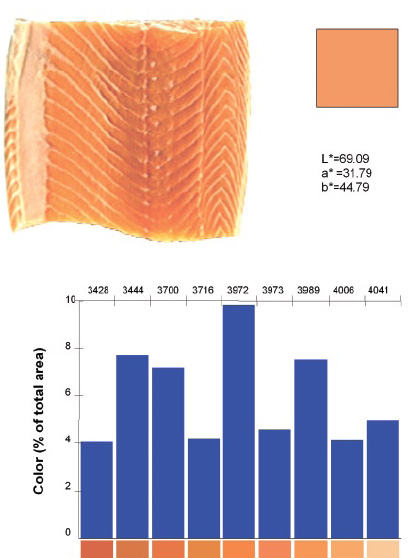
MV has the flexibility to select a region on the surface of the sample from which color and other (e.g., geometrical) information can be extracted. In Figure 3, rectangular regions of interest (ROI) of two meat cuts with different marbling are selected, represented by the green rectangles. Assuming that any pixel with a threshold L* value greater than 50 is fat, we can easily quantify the marbling in the ROI. The threshold L* value can be easily changed by the user. This allows the user to quantify, for example, black spots in shrimp, dark spots in potato chips, blood lines in tuna, and diseased areas on a leaf. The ability to analyze only selected areas of an image is one of the unique and important benefits of MV.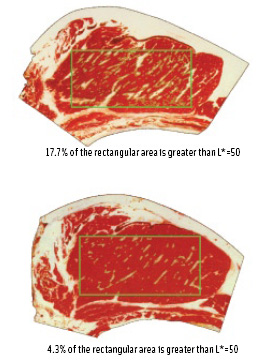
Along with its benefits, however, MV brings its own difficulties. The illumination of the sample must be well-defined, necessitating a “light box” where the light spectrum, intensity, and direction are controlled. Also, MV cameras have many settings, such as brightness, hue, saturation, exposure, sharpness, and white balance. Two images taken in the same light box with different camera settings will result in different colors (Odabasi and Balaban, 2003). Also, different light boxes may result in different measurements due to differences in geometry and light intensity. There may also be temporal differences, since both the intensity and the spectrum of light bulbs may change over time.
If two MV systems provide different color readings of the same sample, the readings cannot be used reliably for color measurement. Balaban and Odabasi (2005) proposed a two-step calibration method for the MV system to overcome this potential problem. In the first step, software determines the optimal camera settings to minimize the difference between the real and measured color of several reference tiles. This needs to be done only once, and these camera settings are used thereafter. In the second step, a reference tile is included in each image, and the color of the whole image is corrected to make the measured color of the tile equal to its real color.
--- PAGE BREAK ---
Applications
An MV system used in our laboratory features a digital Sony DFW-V500 FireWire camera, which can transfer the image directly into the computer without requiring an “image-grabber card.” The light box uses two 18-in, 15-W Lumichrome 1XX fluorescent bulbs (TrueSun, www.truesun.com) with electronic ballast and a color-rendering index (CRI) of 98 and a 50% diffuse surface facing the inside of the light box. Thus, the illumination can be considered as “diffuse, 0 degrees.”
CRI, a measure of the ability of a light source to reproduce the color of an object, ranges from 0 to 100, and light sources with a CRI of 100 have color-rendering capability of daylight. A CRI of 80 or higher is considered excellent. The ColorExpert software can adjust and optimize the camera settings, acquire an image, and analyze and report the colors of the image.
Figure 4 shows one laboratory application of MV. The snapper fish fillet on the left is the “control,” and the fillet on the right has been treated with carbon monoxide. The hue histograms quantify the color differences of the two fillets based on the whole surface. 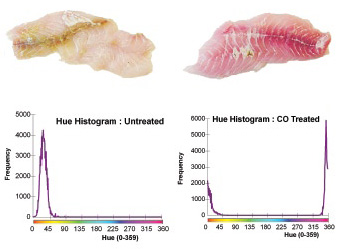
Quantification of desired ingredients of foods may also be important. For example, MV can be used to quantify the amount of chocolate visible in a chocolate chip cookie as a percentage of the total surface.
MV can also be used on a production line or in the quality control lab. Several commercial systems are already available:
• Dipix Technologies, Ottawa, Ontario, Canada, offers a QualiVision system that measures product size and color and provides inspection/rejection for conveyor widths of 2–54 in.
• Koch Lumetech, Kansas City, Mo., offers its Lumetech Optiscan computer-controlled, fully configurable system. It uses visible light, UV light, and a color vision station to create a computer model of a meat product’s size and shape, together with the location of bone, lean meat, surface fat, and sinew and color variation. From the information gathered, a robotic water-jet cutter can remove fat, bone, and sinew, trim out discolored portions, and cut portions to a desired weight, size, or shape.
• Marel, Reykjavik, Iceland, markets the Model L-10 Vision Weigher for shrimp processing. Once calibrated, the system estimates the weight of a shrimp from its view area. Optical sorting machines used on the production line identify and remove contaminants and defective products (e.g, discolored, blemished, etc.). Although the term color sorter is used, such machines use reflectance at particular wavelengths rather than the entire visible spectrum.
--- PAGE BREAK ---
• Precarn, Ottawa, Canada, has developed the Parasensor system, aimed at improving productivity and reducing costs in fish processing operations. The system automatically inspects and classifies fillets using an intelligent camera system that emulates aspects of human eye peripheral vision and scanning.
• Imaging Technology, Bedford, Mass., developed the Prophecy 550B system to inspect samples at speeds greater than 20,000 parts/min.
• SINTEF, Oslo, Norway, developed a system for objective visual inspection of split cod. The system detects overall color, liver stains, blood stains, deformation, and ruptures/splitting in the cod meat.
Outlook for MV systems
Computer hardware is becoming faster, lighter/smaller, and less expensive. Image analysis times are decreasing. Also, speed and storage space allow measurement of larger, more detailed images. Digital cameras are increasing their resolution (number of pixels) and are adopting faster and simpler interfaces, such as Apple’s FireWireB standard, which eliminates the image-grabber card between the camera and the computer to convert visual information to digital data.
Cameras also are getting smaller, faster, and less expensive. When coupled with software to take advantage of these advances, MV can be a viable method to measure the color of foods, and enable capabilities not possible with other methods. The major advantage of MV is to enable and extend the color analysis to samples with nonhomogeneous colors, shapes, and surfaces. This, combined with the shape, size, orientation, and other analysis capabilities of machine vision, allows evaluation of total visual quality of foods.
Murat O. Balaban, Ph.D. ([email protected]), a Professional Member of IFT, is Professor, and Asli Z. Odabasi, Ph.D. ([email protected]), aMember of IFT, is Post-Doctoral Associate, Dept. of Food Science and Human Nutrition, University of Florida, P.O. Box 110370, Gainesville, FL 32611. Send reprint requests to author Balaban.
References
Balaban, M.O and Odabasi, A.Z. 2005. Color measurement with machine vision, and comparison with hand-held colorimeters. Presented at EFITA and WCCA Joint Conference, Vila Real, Portugal, July 23-28.
Balaban, M.O., Yeralan, S., and Bergmann, Y. 1994. Determination of count and uniformity ratio of shrimp by machine vision. J. Aquat. Food Prod. Technol. 3(3): 43-58.
Hutchings, J.B. 1999. “Food Color and Appearance,” 2nd ed. Aspen Publishers, Gaithersburg, Md.
Joshi, R. and Brimelow, C.J.B. 2002. Colour measurement of foods by colour reflectance. Chpt. 5 in “Colour in Food; Improving Quality,” ed. D.B. MacDougall, pp. 82-114. CRC Press, Boca Raton, Fla.
Korel, F., Luzuriaga, D.A., and Balaban, M.O. 2001. Quality evaluation of raw and cooked catfish fillets: Use of electronic nose and machine vision. J. Aquatic Food Prod. Technol. 10(1): 3-18.
Luzuriaga, D., Balaban, M.O., and Yeralan, S. 1997. Analysis of visual quality attributes of white shrimp by machine vision. J. Food Sci. 62: 1-7.
Odabasi, A. and Balaban, M.O. 2003. Correlation of color measurement between a color machine vision system and a hand-held colorimeter. Paper 92- D4 presented at Ann. Mtg., Inst. of Food Technologists, Chicago, Ill., July 12-16.
Papadakis, S.E., Abdul-Malek, S., Kamdem, R.E., and Yam, K.L. 2000. A versatile and inexpensive technique for measuring color of foods. Food Technol. 54(12): 48-50.