
Dissecting The Dietary Guidelines
Strict recommendations for an optimal diet are difficult to support with evidence-based nutrition science.
I was lucky enough to be appointed as a member of the 2010 Dietary Guidelines Advisory Committee and write this article from that perspective. In the past, I have always been on the outside looking in on the Dietary Guidelines process, wondering why bigger changes were never made and why it took five years to publish a little pamphlet with broad dietary guidelines. I now appreciate the amount of effort it takes to develop and support dietary guidelines and also appreciate the implications that dietary guidelines have on federal nutrition and feeding programs, food product developers, and consumers. I have concluded that making strict recommendations for optimal dietary practices is difficult to support with evidence-based nutrition science. Scientific insights are continually evolving, and weighing sometimes contradictory research results is a complex process.
 Humans have survived on a wide range of diets, mostly reflecting access to food supply. During the time of Hippocrates, in the fifth century B.C., physicians supported the view that all edible substances contained aliment, the source of nourishment. In the 1770s, the French chemist Lavoisier described oxidation, fueled by food, launching the study of metabolism and nutrition (Harper, 1988). In 1827, Prout identified three components of food—carbohydrates, fats, and proteins—and suggested getting a balance of these. Over the next 100 years, amino acids, vitamins, minerals, fatty acids, and other essential components of foods were determined, and the study of nutrition science flourished.
Traditionally, nutrient recommendations were made to prevent deficiency diseases. In 1941, the National Academy of Sciences began issuing Recommended Dietary Allowances (RDAs), the quantity of nutrients a person needs to consume daily to ensure basic good health, proper growth, and reproductive success, and to prevent nutrient deficiency diseases. The current nutrition standards for the United States and Canada are the 2002 Dietary Reference Intakes (IOM, 2002). These standards include the RDA, but also Adequate Intakes (AI) for nutrients such as dietary fiber and choline and Tolerable Upper Level Intake (UL), estimates of intakes of nutrients that could cause potential harm. Nutritional deficiency diseases have been virtually eliminated in the U.S., thanks to the enrichment of refined grains with thiamin, riboflavin, and niacin and the consumption of fortified foods such as ready-to-eat breakfast cereals.
A second universally accepted dietary guideline is to maintain appropriate body weight by consuming only enough food to balance the amount of energy expended. This has become much more difficult as modern life has removed all needs for physical labor, and tasty foods are inexpensive and easily obtainable.
--- PAGE BREAK ---
Eating to Stay Healthy
A paradigm shift occurred in 1977 when the Senate Select Committee on Nutrition and Human Needs proposed Dietary Goals for the United States (the McGovern Report). These goals were:
1) Increase carbohydrate intake to account for 55–60% of energy intake.
2) Reduce fat consumption to 30% of energy.
3) Modify the composition of dietary fat to provide equal proportions of saturated, monounsaturated, and polyunsaturated fatty acids.
4) Reduce cholesterol consumption to 300 mg/day.
5) Reduce sugar consumption by 40%.
6) Reduce salt consumption to 3 g/day.
The committee suggested that these goals could be met by increasing the consumption of fruits, vegetables, whole grains, poultry, fish, skim milk, and vegetable oils and by decreasing the consumption of whole milk, meat, eggs, butterfat, and foods high in sugar, salt, and fat.
In 1980, Nutrition and Your Health: Dietary Guidelines for Americans was issued in response to the public’s desire for authoritative, consistent guidelines on diet and health. Public Law 101-445, Section 3, requires publication of the Dietary Guidelines at least every five years. They represent federal nutrition policy established jointly by the U.S. Dept. of Agriculture (USDA) and the Dept. of Health and Human Services (HHS). They are designed to provide science-based advice for ages 2 and older to help prevent chronic diseases and promote health. They lay the foundation for federal nutrition programs and nutrition education programs and serve as a basis for research gaps and priorities. They are designed to ensure that messages and materials are consistent throughout the federal government and that government speaks with “one nutrition voice.”
The overall recommendations of the Dietary Goals have been carried forward to the Dietary Guidelines. Since the first edition of the Dietary Guidelines in 1980, suggestions to decrease dietary fat, saturated fat, cholesterol, and salt have always been part of dietary guidance. Additionally, suggestions to increase starch, dietary fiber, whole grains, and plant foods have found their way into the guidelines in some fashion. Some fine-tuning has occurred over time, with recommendations to remove trans fats from the diet and specific recommendations for intake of whole grains.
Dietary recommendations have always been controversial. Alfred E. Harper, department chair at the University of Wisconsin-Madison during my graduate school years, spoke and wrote widely of the challenges of setting dietary guidance policy. In his paper, “Killer French Fries: The Misguided Drive to Improve the American Diet,” he clearly describes our ways of learning about nutrient deficiencies and how such a model does not work for chronic diseases such as heart disease and cancer (Harper, 1988). He also points out misinformation in the early Dietary Guidelines reports. For example, fruits are listed as a source of “complex carbohydrates,” when in reality they are mostly a source of sugar and often are poor sources of nutrients including vitamins and minerals. The high protein quality and quantity of animal products has been lost in our translation of dietary guidance for public health. As Harper suggests, clinical advice to change diet based on the need to lower serum cholesterol is much different than public health advice to suggest that all Americans should consume plant foods of low protein quality. He notes that “publications of this type from federal agencies carry considerable weight with the public. To the best of my knowledge, the guidelines were developed by the staffs of the two departments and have not been reviewed by professional nutrition organizations” (Harper, 1981). In 1983, a Federal Advisory Committee of nine nutrition scientists selected from outside the federal government was convened to review and make recommendations to HHS and USDA. Since that time, a Dietary Guidelines Advisory Committee (DGAC) has been appointed from outside the government to review the links between diet and risk for major chronic disease.
An Evidence-Based Approach
Although the recommendations of the Dietary Guidelines have not changed significantly since the 1980s, the development of the Dietary Guidelines policy has become more open and science-based. The 13-member DGAC is composed of scientists with a broad range of expertise needed to represent nutrition, physical activity, food behavior, and nutritional changes through the life cycle. The Advisory Committee meets publically to agree on questions to examine in order to set nutrition policy. These meetings are open to the public; public comments are solicited throughout the process. The DGAC report is prepared and presented to the Secretaries of USDA and HHS, which occurred in June, 2010. At this point in the process, the Advisory Committee is dismissed and has no other input into the Dietary Guidelines. USDA and HHS write the policy document, and the Dietary Guidelines are released, which this year took place on Jan. 31.
--- PAGE BREAK ---
The DGAC works in subcommittees to address questions of diet and disease risk. Subcommittees include energy balance, carbohydrates and protein, fats, nutrient adequacy, sodium and fluids, and food safety. I served as the chair of the carbohydrate and protein committee and also served as a member of the energy balance committee and the nutrient adequacy committee.
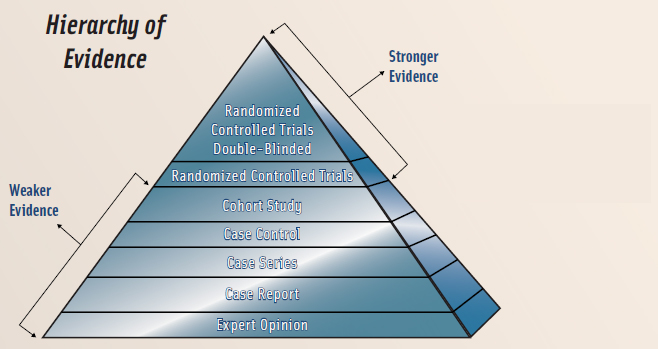
How exactly do the DGAC and the subcommittees go about addressing the agreed-upon questions on the relationships of diet to health outcomes? The Hierarchy of Evidence used for the 2010 Advisory Committee’s evidence-based review process is shown in Figure 1. Strongest evidence is found in randomized controlled trials, preferably double-blinded. Of course, food studies suffer in this arena since it is difficult or impossible to conduct blind food treatments; subjects know they are consuming an apple or apple juice. These types of trials can work with nutrients, as nutrients can be added to food or drinks without the knowledge of the participants or investigators (double-blind). The next-strongest studies are prospective cohort studies, studies where a group or cohort of subjects are studied over time. Food frequency instruments are used to collect dietary information before any diagnosis of disease, making these studies more reliable than cross-sectional studies. No case-control studies, animal research, or in vitro studies are included in DGAC review, and typically cross-sectional studies are only included if no stronger prospective studies are available for review.
The body of evidence for each question is then examined, and in an evidence-based review, conclusions can be deemed strong, moderate, limited, or lacking data to support them. There may be strong evidence that there is no relationship. For example, there was strong evidence of no relationship between glycemic index and disease outcomes.
Agreeing on the strength of the relationship is difficult since, for each question, different types of studies have been published. For each question the 2010 Dietary Guidelines Advisory Committee addressed in the evidence-based report, the search criteria, inclusion and exclusion criteria for studies, the range of dates searched, and other information used in the review is all available on the USDA portal. The transparency used in an evidence-based approach is designed to minimize bias.
Questions on the relationship between dietary exposure and disease outcome are challenging and contentious. I will describe some of the challenges we faced for two topics, carbohydrates as an example of a macronutrient and fruits and vegetables as an example of a food group.
Carbohydrates
In the 2002 Institute of Medicine (IOM) report, Dietary Reference Intakes for Energy, Carbohydrate, Fiber, Fat, Fatty Acids, Cholesterol, Protein, and Amino Acids, the IOM established a RDA for carbohydrate of 130 g/day for adults and children age 1 year and older. This value is based on the amount of sugars and starches required to provide the brain with an adequate supply of glucose. The IOM set an Acceptable Macronutrient Distribution Range (AMDR) for carbohydrate of 45–65% of total calories. The DRI committee concluded that evidence was insufficient to set a UL for carbohydrates. However, the panel suggested a maximal intake level of 25% or less of total calories from added sugars. This suggestion was based on dietary intake survey data showing that people with diets at or above this level of added sugars were more likely to have poorer intakes of important essential nutrients.
The amount of dietary carbohydrate that confers optimal health in humans is unknown (IOM, 2002). Adults should consume 45–65% of their total calories from carbohydrates, except for younger children who need a somewhat higher proportion of fat in their diets. Vegetables, fruits, whole grains, milk, and milk products are the major food sources of carbohydrates. Grains and certain vegetables including corn and potatoes are rich in starch, while sweet potatoes are mostly sucrose, not starch. Fruits and dark green vegetables contain little or no starch. Regular soft drinks, sugar/sweets, sweetened grains, and regular fruitades/drinks comprise 72% of the intake of added sugar (Marriott et al., 2010).
Marriott et al. examined the intake of added sugars and selected nutrients from 2003–2006 National Health and Nutrition Examination Survey (NHANES) data. Thirteen percent of the population had added sugars intake of more than 25% of calories. The predominant issue of concern for the authors was the overall high calorie and low quality of the U.S. diet, not added sugars.
--- PAGE BREAK ---
Fruits and Vegetables
Historically, consumption of certain plant foods, fruits, vegetables, and legumes was thought to prevent or cure ailments ranging from headaches to heart disease (Steinmetz and Potter, 1996). Early medicine revolved around the prescription of specific foods for certain disorders. Many of these plant foods are also high in dietary fiber and phytoestrogens, so often the hypotheses were driven by fiber, carotenoids, phytoestrogens, or other plant chemicals. Of course, determining the relationship between any dietary component and health outcomes is difficult since diet is a complicated exposure; each day we eat a variety of foods and nutrients, and the ability to link any particular food or nutrient to a health or disease outcome is limited.
In epidemiologic studies, it is possible to count number of servings of fruits and vegetables consumed daily. Of course, fruits and vegetables consumed vary greatly in nutrient composition and calories per serving. The earliest definition of a fruit was “any plant used as food,” and a vegetable was a “plant, as opposed to an animal or inanimate object” (Smith et al., 1995). In the 18th century, botanical definitions were standardized, and the definition of a fruit was based on its anatomy, whereas that of a vegetable was based on culinary usage. Generally, culinary custom dictates which plant foods are considered vegetables or fruits. A drawback of using culinary definition is the misclassification of botanical fruits such as squash, tomatoes, and mature beans, which, from a culinary perspective, are considered vegetables.
Within each category, other classifications can be used. For example, for vegetables, raw, cooked, canned, pickled, leafy green, and legumes are often examined. Fruits and vegetables have also been described as part of a phytochemical group—for example, carotenoids, vitamin C, or folate (Smith et al., 1995).
Earlier reviews that included cross-sectional studies found stronger support for the consumption of fruits and vegetables and disease prevention. Steinmetz and Potter (1996) concluded that the scientific evidence regarding a role for vegetable and fruit consumption in cancer prevention is generally consistent and supportive of current dietary recommendations. Yet Hung et al. (2004), using data from the Nurses’ Health and Health Professionals cohort studies, concluded that increased fruit and vegetable consumption was associated with a modest, although not statistically significant, reduction in the development of major chronic disease. Smith-Warner et al. (2001) examined data from eight prospective studies of breast cancer and intake of fruits and vegetables. No association was found for total fruits, total vegetables, or total fruits and vegetables. No additional benefit was found in comparisons of the highest and lowest deciles of intake. Additionally, no associations were observed for green leafy vegetables, eight botanical groups, and 17 specific fruits and vegetables. They conclude that fruit and vegetable consumption during adulthood is not significantly associated with reduced breast cancer risk.
More recent reviews of fruits, vegetables, and other diseases are also less positive on a role between intake of fruits and vegetables and disease protection. Dauchet et al. (2009) suggests that evidence that fruit and vegetable consumption reduces risk of cardiovascular disease remains scarce thus far. They agree that under rigorous controlled experimental conditions, fruit and vegetable consumption is associated with decreased blood pressure. Little experimental data exist that fruit and/or vegetable consumption affect blood lipids or other cardiovascular risk factors.
In a population-based cohort study in the Netherlands, higher consumption of fruit and vegetables, whether consumed raw or processed, was protective against coronary heart disease (CHD) incidence (Oude Griep et al., 2010). The risk of CHD incidence was 34% lower for participants with a high intake of total fruit and vegetables (>475 g/day) compared with participants with a low total fruit and vegetable consumption (<241 g/day).
A systematic review and meta-analysis of fruit and vegetable intake and incidence of type 2 diabetes included six studies, four of which provided separate information on the consumption of green leafy vegetables (Carter et al., 2010). No significant benefits on incidence of type 2 diabetes were found with increased consumption of vegetables, fruit, or fruit and vegetables combined. Hamidi et al. (2010) systematically reviewed observational and intervention studies that investigated the effects of fruit and vegetable intake on incidence of osteoporotic fractures, bone mineral density, and bone turnover markers in women age 45 years and older. They concluded that, based on limited evidence, the benefits of fruit and vegetable intake on bone health remain unclear.
Fruits, vegetables, and legumes vary widely in nutrient content so should not be expected to have similar physiological effects. Although dietary guidance is supportive of a more vegetarian eating pattern, including increased servings of fruits and vegetables, the scientific support for these recommendations is more historical than evidence-based. Prospective cohort studies find weak support for the protectiveness of fruits and vegetables against chronic diseases. Additionally, few randomized controlled trials are published on the addition of fruits and vegetables to the diet and changes in biomarkers or health status. Nutrients in fruits and vegetables such as dietary fiber, vitamins, minerals, and phytochemicals are all biologically plausible as mechanisms whereby fruits and vegetables play a role in health.
--- PAGE BREAK ---
Few people notice that fruits and vegetables, especially fresh, are not high in fiber. With the public health message to combat obesity with lower calorie intakes, foods devoid of protein, such as fruits, will need to be considered for their nutrient density. Articles similar to one by Weichselbaum (2008), suggesting that fruit makes us fat, as well as negative feelings about carbohydrates in general may temper enthusiasm for fruit consumption.
Challenges in Evaluating Diet and Disease Relationships
Inconsistencies in the DGAC report exist, often because of differences in inclusion criteria for studies. For example, limited evidence was found for a relationship between intake of sugar-sweetened beverages and body weight in adults in the carbohydrate chapter, where cross-sectional studies were excluded. In contrast, strong evidence was found between intake of sugar-sweetened beverages and body weight in children when cross-sectional studies were included in the review conducted in the energy balance committee.
Issues with contradictory evidence in the DGAC 2010 report were reviewed by Hite et al. (2010). They suggest that the report does not provide sufficient evidence to conclude that increases in whole grain and fiber and decreases in dietary saturated fat, salt, and animal protein will lead to positive health outcomes. They state that lack of supporting evidence limits the value of the proposed recommendations as guidance for consumers or as the basis for public health policy. They suggest that it is time to reexamine how U.S. dietary guidelines are created and ask whether the current process is still appropriate for our needs. Their support of lower carbohydrate intakes, a view shared by many of the public comments to the DGAC, is definitely an area needing more discussion for the 2015 Dietary Guidelines.
The Dietary Guidelines and Our Health
Does adherence to the Dietary Guidelines makes us healthier? This question is generally answered by cynical comments that no one adheres to the Dietary Guidelines anyway so it doesn’t matter. Intervention studies, where diets following the Dietary Guidelines are fed long-term to human volunteers, do not exist. Generally, adherence to the Dietary Guidelines is measured in epidemiologic studies by determining a healthy eating index (HEI), a measure of adherence to the diet recommendations of the Dietary Guidelines. McCullough et al. (2000) found that the HEI was only weakly associated with risk of major chronic disease. Zemora et al. (2010) determined the relationship between weight gain among black and white young adults in the Coronary Artery Risk Development in Young Adults (CARDIA) study (1985–2005). The authors created a 100 point Diet Quality Index. They concluded that their findings do not support the hypothesis that a diet consistent with the 2005 Dietary Guidelines benefits long-term weight maintenance in young adults in America. They suggest the need for attention to obesity prevention in future Dietary Guidelines.
In the 1973 Woody Allen movie Sleeper, a patient who has been cryogenically frozen and wakes up 200 years later asks for “charmed foods” including wheat germ, organic honey, and tiger’s milk for breakfast. Why not deep fat, steak, cream pies, and hot fudge, asks the nurse. “Those foods were thought to be unhealthy” says the doctor, “precisely the opposite of what we know to be true.” It is unlikely that the 2015 Dietary Guidelines will include the Sleeper dietary recommendations, but nutrition science demands that moderation and variety continue to be the guiding principles of nutrition advice.
Efforts to micromanage the diet by imposing strict dietary rules are difficult to support with evidence-based nutrition science. We eat foods, not nutrients, and cultural norms and traditions must be considered when determining dietary guidance. Professor Harper’s final advice is this: “A federally supported nutrition education program based on established knowledge that would help to teach people what sound nutrition practices are and more particularly what can, and what cannot, be expected from following such practices, would be of infinitely more value to the general public than a set of recommendations for nutrition treatment of chronic diseases based on fear of food and fear for health and proposed on the basis of highly selected information under the guise of dietary goals” (Harper, 1978). More than 30 years later, his advice rings just as true.
Joanne Slavin, Ph.D., R.D., a Professional Member of IFT and a Science Communicator for IFT, is Professor, Dept. of Food Science and Nutrition, University of Minnesota, 1334 Eckles Ave., St. Paul, MN 55108 ([email protected]). She was a member of the 2010 Dietary Guidelines Advisory Committee.
References
Carter, P., Gray, L.J., Troughton, J., Khunti, K., and Davies, M.J. 2010. Fruit and vegetable intake and incidence of type 2 diabetes mellitus: systematic review and meta-analysis. BMJ 341: c4229. doi: 10.1136/bmj/c4229.
Dauchet, L., Amouyel, P., and Dallongeville, J. 2009. Fruits, vegetables, and coronary heart disease. Nat. Rev. Cardiol. 6: 599-608.
Hamidi, M., Boucher, B.A., Cheung, A.M., Beyene, J., and Shah, P.S. 2010. Fruit and vegetable intake and bone health in women aged 45 years and over: a systematic review. Osteoporos. Int. Published electronically Dec. 17.
Harper, A.E. 1978. Dietary goals—a skeptical view. Am. J. Clin. Nutr. 31: 310-321.
Harper, A.E. 1981. Dietary guidelines for Americans. Am. J. Clin. Nutr. 34: 121-123.
Harper, A.E. 1988. Killer French fries. Sciences 28(Jan./Feb.): 21-27.
Hite, A.H., Feinman, R.D., Guzman, G.E., Satin, M., Schoenfeld, P.A. and Wood, R.J. 2010. In the face of contradictory evidence: Report of the Dietary Guidelines for Americans Committee. Nutrition 26: 915-924.
Hung, H.C., Joshipura, K.J., Jiang, R., Hu, F.B., Hunter, D., Smith-Warner, S.A., Colditz, G.A., Rosner, B., Spiedelman, D., and Willett, W.C. 2004. Fruit and vegetable intake and risk of major chronic disease. J. Natl. Cancer Inst. 96: 1577-1584.
Institute of Medicine. 2002. Dietary reference intakes for energy, carbohydrate, fiber, fat, fatty acids, cholesterol, protein, and amino acids. Food and Nutrition Board.
Marriott, B.P., Olsho, L., Hadden, L., and Connor, P. 2010. Intake of added sugars and selected nutrients in the United States, National Health and Nutrition Examination Survey (NHANES) 2003-2006. Cr. Rev. Food Sci. Nutr. 50: 228-258.
McCullough, M.L., Feskanich, D., Rimm, E.B., Giovannucci, E.L., Ascherio, A., Variyam, J.N., Spiegelman, D., Stampfer, M.J., and Willett, W.C. 2000. Adherence to the Dietary Guidelines for Americans and risk of major chronic disease in men. Am. J. Clin. Nutr. 72:1223-1231.
Oude Griep, L.M., Gelejinse, J.M., Kronhout, D., Ocke, M.C., and Verschuern, W.M. 2010. Raw and processed fruit and vegetable consumption and 10-year coronary heart disease incidence in a population-based cohort study in the Netherlands. PLoS One 25(5): e13609.
Smith, S.A., Campbell, D.R., Elmer, P.J., Martini, M.C., Slavin, J.L., and Potter, J.D. 1995. The University of Minnesota Cancer Prevention Research Unit vegetable and fruit classification scheme (U.S.). Cancer Causes and Control 6: 292-302.
Smith-Warner, S.A., Spiegelman, D., Yaun, S.S., Adami, H.O., Beeson, W.L., van den Brandt, P.A., Folson, A.R., Fraser, G.E., Freudenheim, J.L., Goldhobohm, R.A., Graham, S., Miller, A.B., Potter, J.D., Rohan, T.E., Speizer, F.E., Toniolo, P., Willett, W.C., Wolk, A., Zeleniuch-Jacquotte, A., and Hunter, D.J. 2001. Intake of fruits and vegetables and risk of breast cancer: a pooled analysis of cohort studies. JAMA 285: 769-776.
Steinmetz, K.A. and Potter, J.D. 1996. Vegetables, fruit, and cancer prevention: A review. J. Am. Diet. Assoc. 96: 1027-1039.
Weichselbaum, E. 2008. Fruit makes you fat? Nutr. Bul. 33: 343-346.
Zemora, D., Gordon-Larsen, P., Jacobs, D.R. Jr., and Popkin, B.M. 2010. Diet quality and weight gain among black and white young adults: the Coronary Artery Risk Development in Young Adults (CARDIA) study (1985-2005). Am. J. Clin. Nutr. 92: 784-793.