
What, When, and Where Americans Eat: 2003
An unprecedented degree of convenience, a new generation of “better-for-you” benefits, and the promise of a palate-pleasing but not-too-provocative taste experience are driving American food selection practices, preferences, and patterns.
Last year, nearly eight in ten meals were eaten in the home, most of them prepared by “Mom.” Spaghetti, pizza, and steak were the most frequently eaten dinners, and sandwiches ruled for lunch. The majority of families had their main meal together at least four times a week, and one-third ate together seven nights a week! And avoiding additives, preservatives, pesticides, and sugar was back in vogue. Does it seem like nothing’s changed? Nothing could be further from the truth!
 Last year, for the first time in a long time, grocery and retail food dollar sales exceeded food service revenues (USDA, 2003a). Frozen and ready-to-eat foods accounted for more than one-quarter of dinner entrees and are expected to replace home-made within the next five years (NPD Group, 2003a). Our kitchens have changed. Two-thirds of households now have a second freezer or refrigerator. While only half of American kitchens sport a broiling pan and 21% a bundt cake tin, nearly nine out of ten house paper plates, three-quarters plastic sandwich bags, and two-thirds cooking sheers or scissors (NPD Group, 2003b). Fewer people said they ate out at a restaurant (18%, down 2% compared to 2001) or brought take-out food home last year (10%, down 4% from 2001), according to MSI (2002a). And while two-thirds of consumers said they added some foods to their diet—and avoided some foods—to eat healthier, the sheer amount of food consumed per person has reached an all-time high.
Convenience is driving our everyday food choices more than ever before, and we’re willing to pay the price. Last year, nearly three-quarters of meal preparers made last night’s meal at home, up 7% in just one year and close to the decade’s highest level (MSI, 2002a). Families ate together an average of four nights a week, up from three the year before, and 36% had their main meal together every night, up 2% from 2001 (MSI, 2002a).
The number of meal preparers who “cook” for three or more people steadily declined over the past two decades, most likely reflecting the shift in household demographics from predominantly married couples with children to “empty nesters” and single-person units. In 1960, nearly half of American households fit the mode of a married couple with at least one child under 18 years old; in 2000, less than one-quarter conformed to this family model. However, this trend has begun to reverse itself, registering a 5.7% increase in family units during the 1990s.
The change has been credited to growth in the Asian and Hispanic populations, in which “married with children” units make up more than one-third of households (Frey, 2003). By 2025, ethic minorities will make up 40% of the United States population, and the preferences of ethnic “moms” and children, too, will have a dramatic effect on America’s food preferences. Hispanics spend more per week on groceries and visit the supermarket more frequently than other ethnic groups (FMI, 2003a). Chicken/turkey, steak/beef, soup, pizza, pasta, sandwiches, ham, baked potato, hamburgers, and rice dishes topped the list of main dishes eaten for dinner in the past week. Beef, eggs, pork, baked potatos, salad, sandwiches, meatloaf, poultry, chili, and meat casseroles were most likely to be prepared from scratch; pizza and Chinese food were more likely to come from a restaurant (MSI, 2002a).
After suffering its third consecutive quarter loss, with traffic down 2% for the quarter ending February 2003 and only 2% growth in 2002, the restaurant industry may be starting to show modest signs of improvement. Fast-food restaurants, which account for 74% of all industry traffic, experienced a 2% drop in traffic during the last quarter, while the “red hot” casual dining segment—with 12% of traffic—saw traffic grow a modest 1% (NPD Group, 2003c, d). However, in a June 2003 survey (NPD Group, 2003e), 14% of customers said they plan to spend more at full-service restaurants in the next few months, 49% the same, and 37% less; and 12% said they will spend more at fast-food restaurants, 51% the same, and 37% less.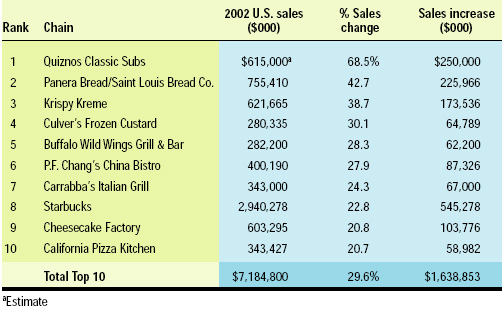
--- PAGE BREAK ---
The unprecedented diversity of the American palate is evidenced by the lack of a burger-driven chain in Technomic’s (2003) list of the ten fastest-growing chains (Table 1). When ranked by absolute dollar sales increases, Subway posted the largest gain (15.6%), followed by Wendy’s Old Fashioned Hamburgers (10.9%), Starbucks (22.8%), Applebee’s Neighborhood Grill & Bar (10.7%), and Taco Bell (5.7%). Within the trendy quick-casual segment, P.F. Chang’s China Bistro Inc.’s Pei Wei, a new Asian concept, led the list of sales gainers (up 270.6% in sales), followed by McDonald’s Chipotle Mexican Grill (55.2%), Baja Fresh Mexican Grill (41.0%), Pick Up Stix (28.8%), and Corner Bakery (15.4%) (Technomic, 2003).
Take-out food consumption also appears to be falling off. In 2002, 118 meals were taken out, compared to 117 in 2001 and 121 in 2000 (NPD Group, 2003a). Based on year-end 2002 data, on-premise restaurant dining (43% of all restaurant traffic) appears to have stalled. Carry-out accounts for about one-third of restaurant traffic, and drive-through accounts for 19%, up 3% over 2001. One-quarter (24%) ate takeout food in their car, up 4% from 2001; 48% ate it at home, down 1% from the previous year; and 22% ate it at work, down 4% (NPD Group, 2003c).
Today, take-out is also a diversifying market segment. The top 20 leading chains in terms of take-out sales now include seafood (Long John Silver and Captain D’s), Asian (Panda Express), Italian, (Fazoli’s), Mexican (Baja Fresh Mexican Grill), and even cafeteria/buffet (Luby’s and Piccadilly). While casual dining and mid-scale dining represent a significantly smaller portion of overall take-out sales compared to fast food, the Outback Steakhouse remains the casual restaurant take-out leader, spurred by its curbside take-out program, followed by Applebee’s Neighborhood Bar & Grill’s highly successful “To Go” program. Bob Evans maintains a top position in mid-scale with its “Carry Home Kitchen” program (Technomic, 2003).
One of the best indicators of where American food preferences is likely to go can be found by watching growth in chain restaurants and their menu modifications. According to Technomic (2003), sandwiches, fast Mexican, Asian, and fresh will be key categories in the years ahead. By menu category among the “Top 100” chains, Asian (27.7%) led the list of U.S. sales trend gainers, followed by steak (19.8%), donut (13%), Mexican (12.5%), sandwich (12.4%), Italian (11%), seafood (9.7%), BBQ (6.7), chicken (4.5%), hamburgers (2.5%), and pizza (1.2%).
According to NMI (2003), two-thirds of Americans say they eat healthier than they used to. In 2003, one-third select foods primarily on their nutritional content, and 28% on the Food Guide Pyramid (NMI, 2003). HealthFocus (2003) confirms that fresh remains Americans’ most important food label claim (68%), followed by grown without pesticides (51%), good source of calcium (46%), and helps to build strong bones (45%). Those involving the immune system, cancer, whole grain, and cholesterol tie at 44%, followed by saturated fat, cholesterol, and cholesterol-free.
Without a doubt, the most disturbing finding when reviewing trends over the past 30 years is the increase in the amount of food eaten, portion sizes, and caloric levels. Americans at the beginning of the 21st century are consuming more food and several hundred more calories per person per day than did their counterparts in the late 1950s. USDA (2003b) estimates dietary intake of calories in 2000 at just under 2,700 kcal/person/day—up about 530 kcal between 1970 and 2000. Of that 24.5% increase, grains (mainly refined grain products) contributed 9.5%; added fats and oils 9.0%; added sugars 4.7%; fruits and vegetables together 1.5%; meats and nuts together 1%; and dairy products and eggs together down 1.5%. The food-away-from-home sector provided 32% of total food energy consumption in 1994–96, up from 18% in 1977–78.
Portion sizes have increased substantially since the 1970s, with the biggest increase taking place in food consumed in fast-food restaurants (Neilsen and Popkin, 2003). From 1977 to 1996, portion size increased for salty snacks, deserts, soft drinks, fruit drinks, French fries, hamburgers, cheeseburgers, and Mexican food. The average salty snack increased in size to 1.6 oz from 1.0 oz, the average soft drink to 19.9 oz from 13.1 oz, and the average cheeseburger to 7.2 oz from 5.8 oz.
--- PAGE BREAK ---
Ten Trends
1First Step, No Prep!
Convenience is no longer an option. When it comes to making meal selections, speed/ease of preparation tops the list of food “solution” attributes—for snacks, it’s ready-to-eat/no preparation—more important in both categories than on sale or low price (Fig. 1; IRI, 2002a). Three-quarters of food shoppers also say that heat-and-eat, packaged for on-the-go eating (69%) and no utensils required (64%) are other key criteria. 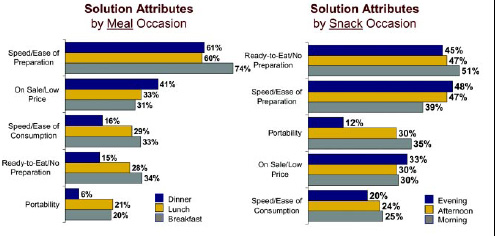
InfoScan sales-tracking data indicate that shoppers are willing to pay as much as 2–3 times more for convenient versions of their favorite foods. On average, shoppers pay a 26% price premium for single-serve salty snacks, 122% for single-serve water, and 198% for oatmeal in a cup (IRI, 2002b). And the success of the breakfast and dinner solution market—with gains of 6.6% and 7.5%, respectively, in 2002—is indicative of demand for even more convenient options.
Three-quarters (76%) of all meals were prepared in the home last year, and consumers are cutting every corner to make this “chore” easier. In 2002, only one-third of all main dishes were completely homemade—down from 39% in 1993. Ready-to-eat/frozen accounted for 27% of main dishes and will likely replace homemade within the next five years (NPD Group, 2003a).
Meal preparers continue to limit the number of dishes served. The average supper now consists of 3.5 dishes, down from 4.0 in 1985; half were one-dish meals. Just over half (56%) of suppers had at least one side dish, down from 65% in 1990; dessert ended 14% of meals. Consumers are also spending less time assembling the main dish and using fewer appliances. Last year, only 23% of all home-prepared dinners used more than one cooking appliance. Using the microwave to prepare a dish as part of a main meal at least 2–3 times a week increased from 13.1% of meals in 1996 to 20.0 in 2002; BBQ/grilling climbed to 2.7% (NPD Group, 2003a, 2001).
The rising demand for complete meals is already causing a sea change in the $6-billion frozen entree/dinner segment. In supermarkets, dinners posted the third largest gain in unit sales in the frozen food case, up 9.7%, and more than double the 3.5% posted by the total frozen department. Frozen entrees, which account for significantly more sales, saw unit sales drop 1.1%, while side dishes fell 12.7% (IRI, 2003a). And there’s more opportunity for frozen meals. As families and extended families continue to eat together more frequently, 5- to 6-serving, family-sized frozen meals such as On-Cor Frozen Foods’ Dinner Partners line, with favorites like gravy, meatloaf, and mashed potatoes, will find a welcome market.
As latch-key kids continue to fend for themselves and kids participate more in their own meal preparation, fun-and-fast kids’ meals like Stouffers’ Maxaroni dinner line, which couples macaroni and cheese with bite-sized pizza rolls, fish sticks, or chicken nuggets, will please Mom and her little tykes alike.
The need for convenience is also driving consumers who are frustrated with handling perishables to keep more frozen supplies of vegetables, fruits, soups, meats, and seafood staples on hand. Although “fresh” has topped the list of the most-desirable food label claims for at least the last decade, the percent of shoppers who think it is extremely/very important has slipped from 71% in 1994 to 68% in 2002 (HealthFocus, 2003). Sales of unprepared frozen meat jumped 12.8%, chicken 9.8%, ground beef 16.8%, unbreaded fish 10.2%, unbreaded shrimp 36.9%, and other unbreaded seafood 34.4% (Heller, 2002). Tyson’s new Individually Fresh Frozen beef and pork products, including lemon pepper, breaded, and stuffed pork chops (Fig. 2), will likely find a welcome market.
--- PAGE BREAK ---
According to NPD Group (2003b), two-thirds of households have freezers that are three-quarters or more full, and two-thirds have a second freezer. Other convenience items, such as refrigerated cookie dough, are now found in nearly one-quarter (23%) of kitchens; frozen hamburger patties in one-third. Easy-to-clean indoor or tabletop grills are in 27% of households. Although virtually every home kitchen had a frying pan in 1993, only 92% have them today; 54% have a 1-qt casserole and 39% a broiler pan. Consumers are also buying more tools to aid with convenience foods, such as kitchen shears, now found in nearly two-thirds of American kitchens.
Cutting-edge food scientists have raised the bar on the convenience food market. Witness Kraft’s Easy Mac, General Mills’ Milk n’Cereal bars, and fully cooked seasoned meat, poultry, and seafood items. In looking for the next convenience angle, remember that such things as storage (shelf-stable vs frozen); cleanup, no dishes to wash, minimal packaging waste, and not soiling hands; single-serve, bite-size, resealable, portion control, good for interrupted snacking; portable but safe at room temperature; no extra ingredients or utensils needed; won’t spill/soil/crush in transit; and even fits in a pocket are all viable options.
And Americans are inviting fewer people over to share a meal. Last year, the average household served 52 meals to guests—including breakfast, lunch, supper, and snacks—compared to 92 in 1985 and 72 in 1995. Finally, 48% ate take-out food at home, a 1% decline over 2001 (NPD Group, 2003a).
2 More Meat and Potatoes
More than ever, America is a nation of “meat” eaters . . . and chicken, turkey, pork, lamb, and seafood, too! Chicken/turkey, steak/beef, soup, pizza, pasta, sandwiches, ham, baked potato, hamburgers, and rice dishes topped the list of main dishes consumers say were eaten for dinner in the past week (MSI, 1999).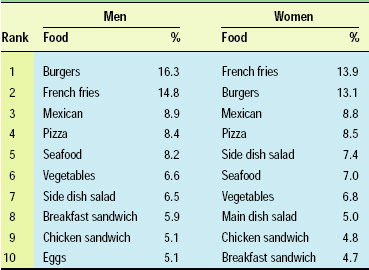
Despite increasing menu diversity, burgers remain the most frequently ordered restaurant item by men—second for women—above chicken sandwiches and seafood (Table 2). With the unprecedented success of “fresh” fully cooked, seasoned, ready-to-eat, value-added products, skyrocketing interest in protein, and an ongoing demand for boldly flavored but familiar fare, there seems to be no end to the opportunities in sight!
In 2000, total per capita consumption of “meat”—defined by the U.S. Dept. of Agriculture as red meat, poultry, and fish—reached 195 lb—57 lb above the level of the 1950s (USDA, 2003a). Each American consumed about 7 lb more red meat than in the 1950s, 46 lb more poultry, and 4 lb more fish/shellfish. The production of leaner animals, trimmed fat on retail cuts, lower-fat ground/processed meats, and consumer substitution of poultry for red meats have significantly lowered the meat, poultry, and fish group’s contribution to total dietary and saturated fat. Despite near record-high consumption in 2000, the proportion of fat in the U.S. food supply from meat, poultry, and fish declined from 33% in the 1950s to 24% in 2000, and saturated fat fell from 33% to 26%.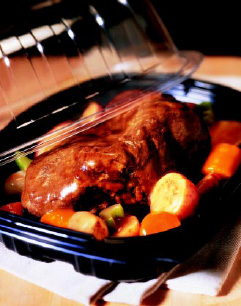
A number of new, very strong innovations will keep this high-protein category center stage. From Casual Gourmet’s Sun-Dried Chicken Sausage to Swift & Co.’s Premium Seasoned beef and pork roasts, bold flavor is the name of the game. With a $1.4-billion rotisserie chicken takeout market, watch as products like Jennie-O Turkey Stores’ Turkey Tonight flavored boneless rotisserie roasts, the National Cattlemen’s Beef Association’s Home-Style whole or half deli pot roast (Fig. 3) or corned beef, and House of Raeford’s complete whole turkey dinners in a box make family cooking flawless.
--- PAGE BREAK ---
Move over, jerky: products—such as Old Wisconsin’s Snack Bites, which look like bite-sized hot dogs, and beef and pepperoni Snack Sticks and Snack Slices—will bring a new dimension to the meat snack category, as will bite-sized and bagged deli meats, like Gallo’s Light Italian Dried Salami rounds and Hormel’s Snack Size Deli Meats and Cheeses.
Everyone’s trying to look like fresh deli! Clear resealable plastic deli pouches for packaged cold cuts and a variety of new shaved cold cut lines—like Oscar Mayer’s Shaved Brown Sugar Ham (“Great deli taste, no wait!”)—are grabbing customer attention.
With spaghetti being the most frequently eaten dinner, it’s not surprising that fully cooked and flavored meatballs are coming on strong. While sales in the $1.7-billion hot dog market are off a little, some segments are enjoying strong sales, including oversized franks, jalapeño and Cheddar flavored wieners, and kosher dogs, such as those from ConAgra’s Hebrew National. Bacon (especially the fully-cooked and boldly flavored varieties), popcorn chicken, bratwurst, and riblets of all kinds are gaining in popularity.
Another growing packaged “meat” segment is authentic barbecue. Sadler’s Smokehouse brings fully cooked, convenience trays of family-sized ribs and sauce, heat-and-eat BBQ Beef Brisket, and a range of fresh-packed BBQ beef and pork dinners. Growing niche markets include branded beef such as Certified Angus Beef, certified organic meats/poultry, free-range/grass-fed “meats,” and all-natural, nitrate- and nitrite-free beef, such as Coleman’s hot dogs.
Thanks to the advent of precooked, prepared and seasoned fish and seafood and frozen meals like Gorton’s Shrimp Bowls and Mrs. Paul’s Healthy Selects, home consumption is finally going up. Rich-SeaPak Corp. is helping to spice things up with its marinated and grilled shrimp in Caesar Parmesan, Garlic Herb, and Spicy Szechwan flavors. Smoked fish is becoming a deli staple, and now it’s portable, too. Spence & Co.’s Lox in a Box—smoked salmon, creme fraiche, eight toasts, capers, knife, and napkin—is a clever gourmet treat.
In 2001, the National Fisheries Institute (NFI, 2002) reported that shrimp surpassed tuna as America’s most consumed seafood. Not if Heinz Foods has its way! The company’s new StarKist Tuna Creations line of marinated tuna is available in Herb and Garlic, Zesty Lemon Pepper, and Hickory Smoked varieties and packaged in a Flavor Fresh Pouch. The products are fresher tasting, and there’s no need to drain or use a can opener.
3 New-Age Dairy
Portable potions and pots, trendy characters, colorful labels, creative flavors, international intrigue—and a healthy aura, too—have taken the dairy category from tired to trendy.
In 2000, Americans drank an average of 38% less milk than in the 1950s; however, last year fluid milk enjoyed a 9.9% volume increase driven by greater consumption of whole milk, flavored milk, and specialty milks, including organic (IRI, 2003b).
Whole milk consumption increased among young children, teenage boys, young men, and Hispanics. Annual fluid milk consumption among kids 6–12 years old reached its highest level in 10 years; teenage consumption was up 3%. Borden’s Plus Kid Builder Milk is one of the first products to position itself toward kids’ health. Organic milks—such as Organic Valley’s new single-serve flavored organic milks with calcium—are a small but mighty category, growing at 40–50% per year. Organic dairy sales are expected to top $3 billion by 2005 (DMI, 2003).
--- PAGE BREAK ---
While cool flavors like bubblegum and mocha cappuccino, cool characters like Tweety Bird and Bugs Bunny, cool names like Raging Cow, and cool shapes and sizes provided the pizzazz behind flavored milks, it’s likely that single-serve and portability ensured their success. Not surprisingly, milk marketers are now targeting convenience stores and vending with their single-serve options. Beverage giants including PepsiCo (Frappuccino), Coca-Cola (Swerve), and Cadbury Schweppes (Raging Cow) are entering the dairy case. Carbonated milk products such as Mac Farms’ Moom, DairLean’s Moo-e, and White Soda Co.’s White Soda will be the next wave to rival the soda category by entering school programs, too. Interactive milks which fizz when you shake them, turn color, or froth after opening are another popular trend.
Undoubtedly, portability has also been instrumental in tripling sales in the yogurt category, now a $2.1-billion retail market with 72.5% household penetration. Half of the category sales are now low-fat (DMI, 2003). With more than 4,000 new entries, cheese and yogurt led new product introductions in the dairy case last year. Yogurt sales remain in double digits for the first quarter of 2003. Textural changes like Dannon’s la Crème and Yoplait’s Whips!, interactive products like Dannon’s Sprink’ins Color Creations, smaller portion sizes like Danimals drinks, and organic, rice, and soy varieties are all adding to the excitement. Most recently, drinkable yogurts—such as Dannon’s Light ’n Fit Smoothie—are growing at a rate of 36% per year. Yoplait’s Nouriche is breaking new ground as the first major yogurt entrant in the liquid nutritionals category (see Trend 7).
But the real long-term consumption story has been cheese. Average annual per-capita consumption of cheese increased 287% between the 1950s and 2000, from 7.7 lb to 31 lb in 2002 (USDA, 2003b). Annual cheese consumption is projected to jump another 5 lb by 2006 (DMI, 2003). Natural cheeses are driving growth in the $11.1-billion cheese segment. New flavors in chunk cheese caused the volume to rise 16.1%; new packaging and the addition of Mexican, Italian, and Colby Jack blends sent the shredded cheese volume up 9.9%. Sliced cheese climbed 5% and string/stick cheese 1.2%. Cheddar led the growth with an 11.6% volume gain, followed by blends with 5.9%. Colby Jack showed a 16.2% volume change over last year, and Monterey Jack 15.9%. Asiago and Gorgonzola top the list of natural specialty cheese enjoying double-digit growth, followed by Provolone, Muenster, Colby, Jack, Brie, goat, blue, and Havarti.
New low-fat cheeses and shreds that melt, more creative cheese snacks for “protein-happy” Americans like Sargento’s new Cracker Snacks containing both cheese and crackers and Stars & Moons and Sunbursts—poppable bagged cheese snacks in fun shapes—as well as all-natural, pre-sliced deli cheeses in the refrigerated aisle such as Land O’Lakes’ Alpine Lace will keep the cheese category growing strong.
And there’s more to come. Following the trend in white-tablecloth restaurants, goat cheese continues to move mainstream, expanding into new forms like Woolwich Dairy’s Goat Brie. With more than 300 artisan cheese makers in the U.S., it was only a matter of time before American specialty and regional cheeses—such as Brewster Dairy’s Amish Classics and California Mozzarella Fresca Co.’s Mozzarella Fresca—were in high demand. Lifetime Food Co. is breaking new ground with low-calorie, low-cholesterol, lactose-free, and soy cheeses that melt and shred.
Organic specialty cheeses, cottage cheese, single-serve milks, cream cheese, sour cream—and new entrants like Organic Valley’s whipping cream and half-and-half—represent an explosive new segment. Organic Valley claims to have put the “cottage back in cottage cheese,” a very powerful draw in today’s “premium-pure” markets. Apple Marketing is producing natural kosher cheeses, another skyrocketing segment.
--- PAGE BREAK ---
With the dairy industry’s new 3-A-Day promotional campaign, the dairy and health connection will be hammered home. Recent research revealing the critical role that dairy can also play in weight reduction and the prevention and treatment of heart disease and high blood pressure is getting more and more media attention. Internationally, milks that lower blood pressure, such as Swedish company Valio Dairy’s Evolvus are gaining attention. In the U.S., cutting-edge marketers like Parmalat and Nu-Vim Inc., whose Nu-Vim milk is intended for healthy immune function and muscles and joints, are also finding a niche in the dairy case.
4 The Culinary Melting Pot
Over the past 20 years, consumption and in-home preparation of ethnic foods have steadily increased, and there’s more room for growth. Italian remains the most popular ethnic cuisine among meal preparers, although the scope and sophistication of ingredients, recipes, and regional variations have changed markedly over the years.
About one-quarter of Americans now say they enjoy Cajun cooking, 19% Spanish, 17% French and/or Japanese, 15% Greek and/or Middle Eastern, 14% California and/or Thai, 12% German, and 11% Caribbean. In comparison, two-thirds say they really enjoy plain American, 63% Chinese, 62% Italian, and 55% Mexican/Tex-Mex (RoperASW, 2002).
Young shoppers place the most importance on a store’s selection of ethnic food. Seven out of ten of those 15–24 years old purchase ethnic foods in a supermarket every month. An ethnic food section is offered by 84% of supermarkets, and 62% of consumers shopped this section in 2002 (FMI, 2003).
• Italian. Lately, it seems that all culinary roads lead to Rome. The plethora of pasta and sauce options for both professional and at-home cooks continues to grow in diversity and sophistication. Insernio’s Quick Italian Classics foodservice line offers labor-free Italian menu options in grab-and-go bowls and boil-in-bag formats. The dishes are fully-cooked and integrated with sauce. They include Gemelli Pasta with Quattro Formaggio Sauce, Penne Pasta with Italian Chicken Sausage, and other upscale combinations.
Monterey Pasta Co. is setting the pace with its Borsellini pasta—delicate, veil-thin pasta purses in the tradition of Old World Italian trattorias, along with new lines of chunky stuffed ravioli and gnocchi. Italian cheeses now account for 35% of all U.S. cheese consumption—almost as much as American—growing at a rate of 32% over the past ten years. Fresh ricotta and whole mozzarella are in vogue, especially when miniature rounds are used, as in Cantare’s tubs of Fresh Italian Antipasto or its Ricotta Fresca.
Authentic dried/cured Italian classic meats, such as Coppola Food Co.’s prosciutto, coppa, mortadella, pancetta, coppola, and capogollo are another new direction. And a variety of authentic Italian stuffed panini sandwiches and stuffed breads are grabbing mainstream attention.
Among the 100 largest U.S. restaurants chains, the Italian segment, with sales of $10.6 billion in 2002, grew 4.0% in full service. Pizza sales topped off at $25 billion, up 1.0%. Carrabba’s Italian Grill ranks 7th on the “Top 10” list of the fastest-growing restaurant chains (Technomic, 2003).
• Mexican. The Mexican segment of the 100 largest U.S. restaurants chains, with sales of $7.6 billion in 2002, grew 4.0% in quick service and fell 2% in full service to $5.7 billion (Technomic, 2003). The trends to substituting more upscale ingredients in Mexican foods, such as shrimp and lobster, regional Mexican cooking, miniaturization of hand-held items, and greater attention to dessert and sweets continue. Classic items such as chorizo sausage, tamales, and Mexican and Spanish cheeses are finding widespread acceptance. In 2002, taquitos accounted for 63% of frozen Mexican sales, mini-tacos 8%, quesadillas 8%, mini-taquitos and mini-burritos each 4%, stuffed nachos 3%, and flautas 1% (ACNielsen, 2002). The flavor revolution is also hitting traditional Mexican foods—Don Miguel’s offers Garlic Chicken Flautas and Chicken and Cheese Tamale. Traditional Mexican ready-to-bake cookies are being featured by Dawn Food Products.
--- PAGE BREAK ---
• Asian. From Stouffers’ new Asian line of Lean Cuisine entrées to Trans-Ocean’s innovative frozen sushi product that thaws like fresh, the Asian trend is moving full speed ahead. P.F. Chang’s China Bistro enjoyed a 27% sales increase in 2002 and ranks 6th on Technomics’ “Top 10” list of fastest-growing restaurant chains; Panda Express ranks 10th.
• Mediterranean. Slowly but surely, Mediterranean foods are moving mainstream. Retailers are seeing more customer interest in fine oils and balsamic vinegars, olive bars, and specialty cheeses. Breads, such as flat breads and whole-grain breads infused with nuts, olives, and dried fruits, are becoming more commonplace. Deli departments are seeing sustaining interest in hummus, dried hams such as Serrano ham from Spain, and cheese from Spain, Greece, and Mediterranean countries. Spanish cheese continues to see double- and triple-digit growth. Olives seem to be everywhere. Terrines, such as Trois Petits Couchons’ Eggplant with Goat Cheese Terrine, are gaining in popularity, as is olive tapenade.
• Other. German evening bread, abendbrot—a slice of whole-grain bread with ham or cheese and a pickle—has potential as a high-protein snack. Fruit-sweetened cakes, such as Grandma’s Bake Shoppe’s Australian Apricot Cake, with apricots and sweet pineapple, are another interesting direction.
Pierogis are also bordering on familiar fare, while French fondues, Poulet rotisserie chicken, quiches, baked Brie, foie gras and mousse, classic chevre/fruit dessert, and bistro foods are making a triumphant return.
5 Nouveau One-Dish Meals
From overstuffed sandwiches, car-friendly cups, and liquid “meals in motion,” Americans are demanding—and redefining—one-dish dining! One in ten meals was eaten “on-the-run” last year, and one-quarter of restaurant take-out was consumed in the car and 22% at work (NPD Group, 2003a).
As the pace of life has accelerated, a new generation of portable products—including snack bars, yogurt in a tube, and grab-and-go soups—has kept pace. And they’ve altered dash-board dining, consumption patterns, and new product criteria for good!
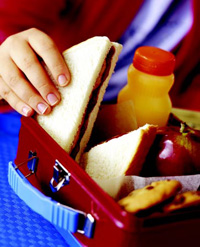
Today, sandwiches are the epitome of a one-dish meal, complete with lettuce/tomato, cheese, lunch meat, and bread, meeting the “Basic 4” food groups. Americans ate an average of 4.1 sandwiches per week last year, 2.8 of which were purchased, and 28% ate more sandwiches in 2002 than they did two years ago. Subway topped the Technomics (2003) list of the nation’s fastest-growing restaurant chains ranked by sales increases. Subway’s sales reached $5.2 billion, up 15.6%. Seven in ten sandwiches were sold at lunch, 20% at dinner, 7% at breakfast, and 3% late at night. Three-quarters of customers said the last sandwich they bought was made to order; six in ten said it was “hot.” Bigger portions are “in.”
The biggest ingredient change in the past two years was more meat (34%), more cheese (17%), more bread (26%), and more veggies (33%). More customers are calling for low-fat spreads (22%) and upscale breads.
Sandwiches are increasing sales of other foods, too—60% of consumers also buy a fountain drink and 49% a salty snack. Consumers are most adventuresome in trying new breads and meats/fillings (both 71%) and cheeses (62%). However, fewer sometimes or often try different sauces or spreads (44%), vegetables (47%), and garnishes or toppings (51%). Nearly 80% say their supermarket offers pre-made sandwiches, 54% made-toorder sandwiches (IDDBA, 2003a, b). New convenient sandwiches, such as Kangaroo Brands’ pre-cut, half-moon-shaped Pita Pocket Bread and Snack’en Pockets in a variety of flavors and textures, will help to make sandwiches more flavorful and functional.
--- PAGE BREAK ---
For some consumers, hand-held frozen and refrigerated meals/entrees—up 7.2% to $1.026 billion in dollar sales and up 4.9% in unit sales in mass market outlets excluding Wal-Mart (IRI, 2003c)—are providing another complete “grab-and-go” solution. Although Nestlé’s Hot Pockets, Lean Pockets, and Croissant Pockets still account for 50% of category dollars—with sales projected to reach $2.1 billion by 2006—competition is heating up. Schawn Foods introduced individually frozen Red Baron Stuffed Pizza Slices, and Frozen Specialty Inc. introduced a Rising Slice. Don Miguel’s gave new meaning to hot dogs, with Diamond Dogs—chili cheese dogs in an extra-thick tortilla—and made everyday “hand butcher-wrapped” burritos gourmet. Stefano Foods’ single-serve Mini-Rip-n-Dip are circular stuffed Italian sandwiches with dip in the middle. And with renewed concern over fat and calories, Weight Watchers’ Smart Ones was smart to market Smartwiches, hand-held pocket sandwiches geared to women, with only 7 g of fat.
In recent years, cups and bowls have rewritten the book on one-dish “grab-and-go meals,” and now they’re going “fresh.” Fun Fresh Concepts is breaking new ground with its refrigerated Deli Dashers dashboard dining cup and bowl lines containing microwavable chili; pasta, including Fettuccini Alfredo, ravioli, tortellini, bowties, and macaroni and cheese; an Oriental cup line with Kung Pao Chicken, Lo Mein Noodles with Chicken, and Sweet & Sour Chicken with Rice; and a pasta and Oriental bowl line. Calzone & Co.’s new frozen quesadilla-inspired sandwiches, QuesaBakes, are frozen in individual, attractive, heat-and-serve bags.
Heartier and healthier, the $3.35-billion soup category, up 4.8% last year, is another emerging winner in the race for one-dish meals. Soup ranks 5th in terms of luncheon items consumed in-home, 4th in terms of dinner items. The latest entry in the soup category is frozen soup, which topped the list of supermarket frozen food gainers, with a 14.7% jump in unit sales (IRI, 2003d).
Liquid and bar meal-replacement products represent the ultimate in contemporary one-dish meals. With the number of Americans “very” concerned about nutrition back to the all-time high of 1995, it’s not surprising that the $1.8-billion bar market is projected to add another $1 billion in incremental sales by 2005 (NBJ, 2003). Kraft Foods’ Balance Bar Gold enjoyed the largest increase, 124%; Zone Perfect 103%; PowerBar Protein Plus 49.9%; Atkins’ Diet Advantage 45.5%; and Clif Bar’s Luna 35.2% (Strzelecki, 2003). More convenient breakfast solutions like General Mills’ Milk’n Cereal bars were up 49%, Kellogg’s Nutri-Grain Bars 24%, and Quaker’s Fruit and Oatmeal Bars & Bites 40%.
A new generation of great-tasting products, such as Snapple’s Snapple-A-Day and Yoplait’s Nouriche, have helped liquid meal replacements skyrocket to a $2.5-billion market segment, up 11% last year. USA Pulmone’s Sogo’s “Meal in a Bottle”—based on a combination of whey and soy protein with more than 20 vitamins and minerals—is the latest addition to this explosive soy and dairy based market segment. With General Mills’ Milk ’n Cereal bars growing in excess of 30% per year, international breakfast beverages that combine cereals and milk—such as Australian company Toni’s Swiss Muesli drink and classic European oat milks such as Valio’s Milk Milk Oat Drink—will likely be the next wave. Coca-Cola’s Minute Maid Division is testing a new morning beverage, BeginIt.
6 Dynamic Dayparts
In 2002, 50.6% of all suppers were prepared by “Mom”—down slightly from 53% in 1990—13% by men, 1% by children, and 1% by another person (NPD Group, 2003a). Restaurants prepared 18% of evening meals—9% of them were eaten at home and 9% in the restaurant—5% as a guest at someone else’s house, and 5% “on the run.”
A number of factors influence what meal preparers choose for dinner. Topping the list—and particularly important to those with no children or those age 50 and over—is the difficulty of cooking for only one or two people (48%), followed by what is familiar/in our repertoire (44%), and being tired/exhausted (41%). Among households with children, being part of their routine, tired/exhausted, and difficulty of choosing a meal everyone will eat are most important. Difficulty in planning ahead, time constraints, and the fact they can’t afford to eat out are most frequently cited by those age 18–35 and those with children under age 13. One-third of meal preparers say they usually need to stop at a grocery store to pick up/be able to make dinner (MSI, 2002a).
Although re-ordered, the “Top 10” main dishes served at in-home suppers have remained virtually the same as they were in 1992, except for the replacement of turkey by fried chicken in 2002. The Top 10 main dishes, in descending order, are spaghetti, 5.0% of all suppers; pizza 4.8%; steak 4.4%; soup 4.3%; baked chicken 3.5%; frozen entree 3.4%; pork chops 2.8%; burger 2.8%; fish (except tuna) 2.5%; and fried chicken 1.8% (NPD Group, 2003a). Although the dishes haven’t changed, the method of preparation and level of sophistication have broadened dramatically. Today the spaghetti is likely to be in any of a dozen shapes and sauces, the fish to be salmon or shrimp, and the pizza to be gourmet.
--- PAGE BREAK ---
More Americans skip lunch than any other meal. In 2001, on average, a consumer skipped lunch 59 times, breakfast 46, and dinner 16. The number of lunches prepared at home has fallen 7% in the past ten years, to 125 annual eatings per person in 2001 from 145 in 1991. However, 56% of all lunches are still prepared and eaten in the home, 12% are “brown-bagged” from home, and 32% are bought from a restaurant or other outside vendor. Lunches purchased at a restaurant have grown steadily over the past ten years, up to 50 lunches/person/year in 2001 compared to 44 in 1999. Meals prepared and eaten in the home and meals carried from the home are flat and declining, respectively. In 2001, 161 lunch meals were prepared and eaten in the home per person, compared to 167 in 1999; 34 were carried from home, down from 39 ten years ago (NPD Group, 2002a).
Ham sandwiches, burgers, and soup are still the most popular food choices for lunch (NPD Group, 2003a; Table 3). Between 1999 and 2001, the biggest luncheon “gainers” were French fries, up 10%; salty snacks 9%; pizza, cereal, and Chinese 8%; fresh vegetables and microwavable popcorn 7%; salad and fish 6%; and chicken, fresh fruit, yogurt, and cheese/crackers 6%. The use of leftovers for lunch fell 5% (MSI, 2001).
Cheese, cereal, vegetables, fruit, salty snacks, crackers, pasta, sweets, and peanut butter top the list of foods eaten on a weekly basis by more than half of children under 12 years old (MSI, 2002b). When it comes to lunch boxes, NPD (2003d) reports that peanut butter and jelly sandwiches will be the number-one food packed in students’ lunches this year. Nearly three-quarters of lunches carried to school will include some type of sandwich; 70% a salty snack; 59% fruit (mostly apples); and 59% a fruit drink.
These items have remained the top four for ten years, but some things have changed. Parents are less likely to include milk, cake, cookies, candy, and cheese sandwiches in their children’s lunchboxes than they were in 1990. Today, more lunches include crackers, yogurt, pudding, carrots, and packaged lunch kits. Not surprisingly, kid-directed convenience lunch products are in high demand. Smuckers’ Uncrustables, frozen round PB&J sandwiches that thaw in the lunch box, are right on target! Oscar Mayer’s Lunchables Fun Fuel! is among the first products to help kids eat healthier, easier. The new product balances taste, fun, and nutrition and offers combinations based on USDA’s Food Guide Pyramid. Only 2% of American children meet the Pyramid recommendations. Not surprisingly, last year, grade school children carried nearly 40% fewer lunches from home than kids did in 1993. Chicken and ham wraps and turkey/ham mini-bagels are among the offerings.
Last year, Americans skipped breakfast more than at any other time since 1998. On average, 50 breakfast meals were skipped in 2002, nearing the high of 51 in 1998. Those Americans age 18–34 years skip almost one out of every four, twice the national average. More than three-quarters of all breakfasts are still eaten at home—77%, compared to 49% of lunches and 75% of dinners. But the in-home breakfast has been steadily losing share, not only to skipping but also to other eating venues and brown-bag breakfasts. NPD Group (2002b) shows that restaurant breakfasts are at their highest share since 1993, accounting for 8% of total breakfast meals in 2002 compared to 6% ten years ago. Although holding a small share of the meal occasion, brown-bag breakfasts also reached a ten-year peak of 2%, compared to 1% in 1993 (NPD Group, 2002d). While sales of RTE cereals are flat, yogurt/yogurt drinks are up 8%, snack/breakfast bars 17%, doughnuts/muffins/pastries 4%, hot cereal/oatmeal 1%, and frozen breakfast convenience items, like Uncle Bens’ Breakfast Bowl, a whopping 13% (IRI, 2002).
When Americans eat breakfast at home, the traditional breakfast meal of eggs and bacon or sausage is at a ten-year high. In 2002, the annual number of eatings per person of all types of egg/omelet dishes at breakfast was 33, compared to 31 in 1993 and a low of 27 in 1998. Scrambled eggs are at their highest point since 1993. Americans eat sausage at breakfast an average of ten times per year, the highest since 1993. Eatings of bacon have been on the increase since 1998, when they were at a low of 12. In 2002, bacon was eaten an average of 13 times. The data are for years ending in February (NPD Group, 2002b).
7 Drink Up!
Although the $62.9-billion carbonated soft drink market increased only 0.8% in 2002 and per-capita consumption continued to decline (54.2 gal in 2002 vs 54.9 gal in 1999), soda remains America’s most frequently consumed beverage.
--- PAGE BREAK ---
Coca-Cola Classic (19.3% share), Pepsi (13%), Diet Coke (9.0%), Mountain Dew (6.5%), Sprite (6.3%), Dr Pepper (5.9%), Diet Pepsi (5.2%), and 7-Up (1.7%) are the leading brands. Diet coke, Diet Pepsi, and Diet Dr Pepper were the only three of the “Top 10” carbonated soft drink brands to post gains in 2002. Vanilla Coke gave Coca-Cola a boost last year, while regular/diet Mountain Dew Code Red, Pepsi-Twist, Sierra Mist, and Pepsi Blue added volume for PepsiCo.
Competition from noncarbonated beverages continues to intensify. Four of the top ten beverage trademarks are noncarbonated: Gatorade, Tropicana, Minute Maid, and PepsiCo’s Aquafina (BMC, 2003a). The average soft drink portion size increased from 13.1 oz in 1994–96 to 19.9 oz in 1998 (Neilsen and Popkin, 2003).
With a per-capita intake of 23 gal projected for 2003, bottled water is expected to become the second most popular commercial beverage this year, overtaking close contenders milk (22.6 gal), coffee (22.1 gal), beer (21.8 gal), and juice/fruit beverages (15.0 gal). If minimal growth continues for the carbonated soft drink segment, bottled water is projected to become the most-consumed beverage by the end of the next decade. In 2002, bottled-water sales topped $7.7 billion, up 12% (BMC, 2003b). Single-serve, which accounts for more than one-third of all sales and one in five convenience-store beverage sales, was up another 30% last year. Pepsi’s Aquafina, with 2002 sales of $838 million, is the largest-selling brand, followed by Coca-Cola’s Dasani, with $765 million. Together, these two brands represented 52% of the category growth last year.
Low-calorie enhanced waters, led by Quaker’s Propel (8%) and Veryfine Products’ Veryfine Fruit2O (4%)—contributed 12% of the category growth last year; higher-calorie enhanced waters contributed little (IRI, 2002d). Other entries include Baxter Pharmaceuticals’ Pulse waters for men and women; Hansen’s Energy Waters, and Clearly Canadian’s Reebock Fitness water.
Other health-directed water trends include natural fortification, country of origin, purity, ultra and naturally filtered, oxygenated, high-bicarbonate for digestive aid, and, in Europe, “slimming waters” whose high mineral content has a diuretic effect.
The desire for good health and the concern over carbonated soft drink consumption have driven consumers to juice and juice drinks, although the $19.5-billion fruit beverage market was essentially flat. Although fruit juices constituted the largest portion of the fruit beverage market, in recent years fruit drinks grew more vigorously (BMC, 2002a). Healthier product alternatives, including juice/soy combinations, juice/fruit/dairy smoothies, fortified juices/drinks, single-serve lemonade, and organic drinks, are among those enjoying the strongest growth.
Sparkling beverages, including carbonated juices such as Nantucket Beverages’ Nectarfizz, and upscale sparkling herbal waters such as Britvic International’s Amé are fast gaining in popularity. Milkshakes hit $225 million in sales in 2002 and eggnog $122 million. Lifeway/Dannon is further tailoring the market by targeting Hispanics with LaFruta cultured dairy beverages in piña colada and mango flavors.
Conversely, despite the astounding success of Starbucks—ranked the third-fastest-growing restaurant chain by sales increases in 2002—and ready-to-drink trendy coffee-based beverages like Frappuccino, with sales of $784 million in 2002, across all forms coffee and tea movement is trending downward, while powdered drinks are falling out of favor (IRI, 2002c).
As America’s spirit is rising, so is the liquor bill. Wine sales reached $19.5 billion in 2001, up 5.2%, and distilled spirits reached $37.3 billion, up 7.2%. Wine consumption is projected to rise to 2.1 gal/person by 2005, up from 1.8 gal in 2000. Spirits consumption is expected to decline slightly. Just over one-third of adults consume alcoholic drinks at least once a week, and four out of 10 have bought wine in the past three months. While the massive beer market has remained essentially flat, alcoholic beverages for the weight-conscious, such as lite beer and low-carb beers like Anheuser-Busch’s Michelob Ultra and reduced-calorie Doc’s Hard Lemon are small but growing segments. Also available are low-alcohol drinks like Diageo’s Gordon’s Edge—Gordon’s gin cut with a sharp taste of lime—and “malternatives”—which look like their beer counterparts but carry the names of major liquor companies like Anheuser-Busch’s Bacardi Silver or Long Beach Brewing Co.’s new Thin Ice, a citrus-flavored malt beverage with just one carb and 90 calories (BMC, 2002b).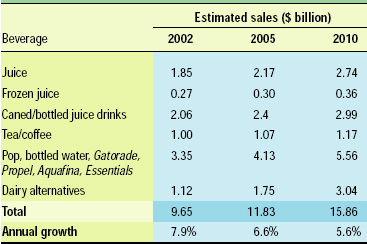
--- PAGE BREAK ---
Next to single-serve, health has been the most dramatic factor influencing beverage sales in the past few years. In fact, PepsiCo announced that one half of its portfolio will be healthy, and Nestlé said health will be the focus of their future acquisitions. Functional beverages reached $10.35 billion in sales in 2002, up 10.7%, and are projected to reach $15.9 by 2010 (NBJ, 2003; Table 4).
Energy drinks led by Red Bull, which now has a sugar-free option, Pepsi/SoBe’s Adrenaline Rush, and Mountain Dew AMP jumped 53% in 2002 and are projected to reach $1 billion by 2002, blurring lines with the $3.25-billion sports drink segment. Extreme beverages with high doses of stimulants and a new class of sexual-energy beverages—some mixed with alcohol—are increasingly popular with young adults.
With the growing ethnic population, lactose-intolerance products like McNeil Nutritionals’ Lactaid are getting unprecedented attention. Novel weight-control drinks such as Glaxo/Pacific Healthcare’s Satietrol, high-protein/low-carb drinks and milks such as Rexall Sundown’s Carb Solutions low-carb milk, and organic beverages (the latter already topping $1.5 billion in sales, up 19%) have a promising future.
8 Sweet on Snacks and Sweets
Driven by healthy-snack segments, the $68.6-billion snack food category grew 2.5% (IRI, 2002d). High performers were nutritional snacks/trail mixes (up 39.7%); frozen bread, rolls, and biscuits (up 28.5%); and snack and granola bars (up 19.9%). Traditional snacks grew less than 3%, outpaced by specialty and frozen snacks at 4% and 6.5%, respectively (Fig. 4). Bakery snacks and dairy products represent two-thirds of total category sales.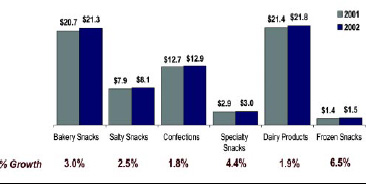
The most popular snack foods for the morning snack in 2002 were snack/granola bars 48%; dairy products 37%, crackers 36%, cookies 33%, and chips/pretzels 30%. The most popular snacks for the afternoon were chips/pretzels 56%; popcorn, seeds, and nuts 47%; cookies 47%; crackers 46%; and snack/granola bars 36%. Topping the list for the evening were popcorn/seeds/nuts at 61%, followed by chips/pretzels 57%, cookies 50%, fresh fruits/vegetables 39%, and crackers 38%. Americans increasingly view snack foods as meal replacements as well as between-meal fare. At the same time, traditional snacks are finding a new role as convenient meal components (see Trend 6).
Regarding meal and snack consumption behavior, IRI (2003a) has classified consumers into three segments: “3 Square,” those who eat three meals daily (67%); “2 per day,” those who eat two or three meals daily (24%); and “grazers,” those who eat less than two meals per day (10%). “3 squares” snack regularly and slightly more than the other two segments, with 77% snacking in the evening, 62% in the afternoon, and 46% in the morning. Just about half of all consumers (49%) regularly eat between meals, while nearly 70% prefer “ready-to-eat” products for snack occasions any time of day.
According to USDA (2003b), consumers eat too much refined grain and too little whole grain. Per-capita use of flour and cereal products reached 200 lb in 2000, up from 155 lb in the 1950s and 138 lb in the ’70s, when grain consumption was at a record low. USDA credits consumer demand for variety breads, other in-store bakery items, and grain-based snack foods and sales of more fast foods made with buns, dough, and tortillas for the increase.
Many Americans’ diet now meets or exceeds the Food Guide Pyramid recommended 10 servings of grain products. USDA estimates that Americans consumed an average of 11 servings. This is likely a gross underestimate, as USDA’s database doesn’t include foods not made directly from wheat flour or bulgur, such as Wheaties and Triscuit crackers, or whole-grain foods made directly from field corn, such as Tostitos, Doritos, and popcorn. Eleven servings is the level recommended for a teenage boy or man engaged in heavy physical activity.
--- PAGE BREAK ---
Eighty-six percent of moms with children under 12 years of age said that on a weekly basis their kids ate hot or cold cereals; 68% salty snacks; 64% crackers; 57% pasta dishes/salads; 50% rice dishes; 46% pizza; 46% pancakes; and 30% meal or snack bars (MSI, 2002b).
Consumption of caloric sweeteners—and sugar and sweet-tasting foods and beverages—hit a record high in 1999 (USDA, 2003b). Per-capita consumption of caloric sweeteners—mainly sucrose and corn sweeteners—increased 43 lb (dry-weight basis) or 39% between 1950–59 and 2000. In 2000, each American consumed an average of 152 lb of caloric sweeteners, 3 lb below 1999’s record average of 155 lb . . . after corrections for “disappearance data,” the equivalent of 32 teaspoons of added sugar/person/day.
USDA recommends that the average person on a 2,000-calorie daily diet include no more than 40 g of added sugars, about 10 teaspoonsful. Carbonated sodas provided 22% of the refined and added sugars in the 2000 American food supply, up from 6% in 1970. Just over half (56%) of moms with children under 12 year of age said their kids ate packaged sweets on a weekly basis, 48% frozen desserts, 40% fruit bits/rolls, 39% homemade desserts, 39% chocolate candy, 22% pudding, and 21% toaster pastries (MSI, 2002b).
When it comes to healthy snacks, nutrition priorities are consistent with other foods, but sugar becomes a higher priority. More than one-third (37%) of evening snackers say fat content is an issue, 35% calories, 26% sugar content, and only 19% vitamin or nutrient content; 26% have no nutritional concern when selecting evening snacks (IRI, 2002a). With more than half of consumers making a strong or some effort to reduce their sugar intake last year (up 8% in 2002 compared to 2001) and 40% carbohydrate intake, expect low-carb and low-sugar/sugar-free snacks to proliferate.
Two bright spots stand out in the snack market. First, frozen appetizer and bite-sized snack sales remain strong, up another 4.8% (IRI, 2003d). Tyson’s frozen bag of chicken quesadillas includes the flour tortilla, chicken white meat, shredded Colby Jack cheese, and diced vegetables, ready in minutes. Purdue Farms’ Deli Popcorn Chicken brings a restaurant favorite back home, while Foster Farms’ Wings & Things in Chinatown, Buffalo West, Gold Coast Honey BBQ, Pacific Rim, and Olvera Chile Lime varieties give an old favorite an exotic new twist.
Heinz’s Delimex’s brand frozen party platters of taquitos, poppers stuffed jalapeños, and cheese sticks will be the life of the party. And gourmet marketers are bringing restaurant-quality creations back home—Kaserei Champignon is marketing Miroabo Walnut (cheese) baked mini filo tartlets, and Sevean Bakery is offering Mediterranean Turnovers, including ratatouille, and Mediterranean thin-crust pizzas in hot onion, tomato–zucchini–basil, and other varieties.
Second, new poppable snacks in resealable bags or cups—such as Nabisco’s bite-sized cookies and crackers, Hershey’s Bites, and Pepperidge Farm’s Flavor-Blasted Goldfish and Giant Goldfish sandwich crackers—are addressing an important grab-and-go need. (For a detailed discussion of trends in individual snack categories, see “Top 10 trends to Watch and Work on: 2003” in the April 2003 issue of Food Technology.)
9 A Fruit & Veggie “Fix”
Salads driving the growth in the deli department and fastfood salad wars? Veggie-flavored cheeses and Egg Beaters™, too? Ready-to-eat cereals overshadowed by real fruit? It’s all part of the growing perception that anything fruit, vegetable, or high-fiber personifies health.
--- PAGE BREAK ---
But it’s more than that. High-quality fresh fruits and vegetables are the second-most important factor in determining where consumers elect to shop for food, just behind a clean, neat store (FMI, 2003). Eating more fruits and vegetables remains the top strategy for improving health—71% of shoppers report trying to include more in their diet in 2003.
About half of consumers believe it is important for them to get five servings of fruits and vegetables every day (NMI, 2003).
Eighty-five percent of moms with kids under age 12 say their children eat vegetables, and 76% fruit, on a weekly basis, more frequently than salty snacks, 68% (MSI, 2002b). Salad (42%) ranked just behind chicken (48%) on the list of foods eaten for lunch in the past week; fresh fruit was fourth, 37% (MSI, 2001). Vegetables accompany 26% of suppers and remain America’s most frequently served side dish, followed by potatoes 17%, vegetable salad 9%, bread 8%, rice 4%, fruit 4%, and, the latest newcomer, salty chips (NPD Group, 2003a).
USDA consumption figures (USDA, 2003b) confirm that Americans consumed 20% more fruits and vegetables in 2000 than they did in the 1970s; total fruit consumption rose 12%. Fresh fruit consumption, up 28% during the same period, outpaced processed fruit consumption (2%). Non-citrus fruits accounted for all of the growth in fresh consumption. Total vegetable consumption rose 23% compared to the ’70s. Fresh (up 26%) also outpaced processed vegetable use (up 21%). The introduction of pre-cut and packaged value-added products and rising health consciousness boosted fresh broccoli consumption by one-third and fresh carrots by one-fifth between 1995 and 1998. While the popularity of pizza in the 1990s boosted canned tomato products, consumption of other canned vegetables declined 13%. Over the same time period, per-capita consumption of French fries and other frozen potatoes jumped 63%, and frozen vegetables 4%.
Consistent with other categories, consumers are demanding convenience at nearly any cost. Sales of fresh-cut salads at the retail level jumped from $82 million in 1989 to $2 billion in 2002, up 10% over the last year (IFPA, 2003). Within the packaged salad category, sales of bagged spinach salad, spinach salad kits, and microwave-in-bag fresh products, like Ready-Pac’s Microwave and Microwave Leafy Greens Blend, grew 37%. Spinach sold in bunches is a strong ethnic item, too. Baby spinach salad and cooking spinach, launched under the Café NewStar Young and Tender label by Ceres Fresh Foods, is another trendy alternative. USDA projects that per-capita spinach consumption will rise from 1.3 lb to 1.5 lb this year.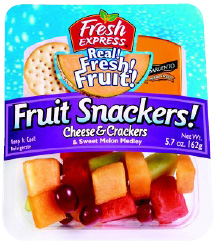
In comparison, fresh-cut fruit, estimated at $183 million in sales, grew 25% during the same period. Fresh Express is clearly the innovator when it comes to fresh fruit. Try its new line of Fruit Snackers!—single-serve, portable kits containing fresh fruit with cheese and crackers, a bagel and cream cheese, or yogurt and granola (Fig. 5). Fresh Express is also offering resealable single-serve, large single-serve, 3-pack, and multi-serve containers of fresh fruit.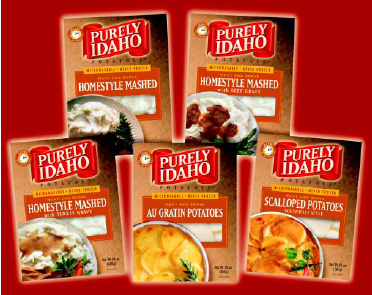
Fresh produce sales were up almost 15% in 2002, as sales of the two largest segments, packaged salads and potatoes (up 23.5%) posted double-digit growth. Added value, convenient packaging, and technical innovations are helping selected product categories soar. Helping potato sales soar are Purely Supreme Foods’ Purely Idaho heat-and-serve refrigerated, microwavable potato line including home-style mashed, herb-roasted, and au gratin potatoes (Fig. 6); Green Giant’s new multi-serving, frozen Roasted Potato with Garlic & Herbs in a standup resealable bag; and a variety of frozen, pre-baked stuffed and regular potatoes.
--- PAGE BREAK ---
Gourmet items like Mann’s Fancy Snow Peas and Broccolini are drawing new users into the fresh-cut segment. Gill’s Onions offers fresh sliced onion rounds and diced sweet onions. Apio, Inc. has added two ready-to-prepare fresh meals, Potato Leek Soup and Stir Fry, to its Eat Smart line.
Another fast-growing segment is vegetarian meals. Nearly one- third of consumers feel it is important for their supermarket to offer vegetarian foods. While creative croutons are enjoying brisk sales, the Top 200 chain restaurants are featuring other texture-changing salad toppers: Parmesan crisps; crisp fried onions; peanuts, candied walnuts, and toasted almonds; tortilla strips; crispy rice noodles; and fried wonton strips (CAMS, 2003).
Longer shelf life and single-serve packaging are adding new life to pre-packaged deli salads such as Reser’s Salad Ovals, which include gourmet twists on traditional salads, like Amish Cole Slaw and premium white meat chicken, Seashell Pasta with Seafood and Shrimp and Gourmet Egg Salad. With veggie sandwiches and heavily topped meat sandwiches getting too full to handle, watch as creative bakers like Kangaroo Brands come to the aid with functional breads such as Salad Pockets, easy-open, half-moon pitas to be filled with chicken, tuna, or any salad.
In 2002, 38% of shoppers said they already buy organic fruits/vegetables, and 20% said they were likely to purchase them (FMI/Prevention, 2002). Top-selling organic vegetables included russet potatoes, tomatoes, peeled baby carrots, cauliflower, and yellow onions. The top five best-selling organic fruits include strawberries, Valencia oranges, kiwi, grapefruit, and lemon (Major, 2002).
10 Cooking Oils and Condiments
Although Americans continue to relax their efforts to curb fat consumption, it remains their top nutrition ingredient concern. With the advent of trans fat labeling, a new generation of highly sophisticated “fat issues” is on the way. 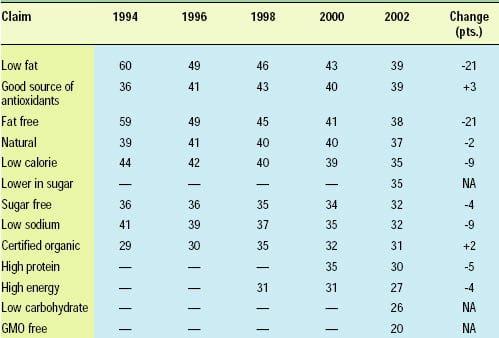
Low-fat and fat-free are extremely or very important claims on labels for about four in ten food shoppers (HealthFocus, 2003; Table 5). Lower in fat is an extremely/very important factor in trying a new food brand for 48% of shoppers, down 6% since 1992. Last year, 62% of Americans made a strong or some effort to reduce total fat, 50% cholesterol, 33% hydrogenated fat, and 33% trans fats (MSI, 2002c). Over the past two decades, the fat density of in-home prepared foods fell from 41% in 1977–78 to 31% of calories from fat in 2000, but away-from-home foods have not kept pace, declining only slightly from 41% of calories from fat to 37.6% (USDA, 2003b).
Per-capita consumption of added fats and oils rose from 44.6 lb in the 1950s to 74.5 lb in 2000, an increase of 67% (USDA, 2003b). Per-capita consumption of salad and cooking oils jumped from 9.8 lb to 35.2 lb in 2002; baking and drying fats from 21.4 lb to 29.0 (shortening increased from 10 lb to 23 lb, while lard and beef tallow fell from 10.5 lb to 6.0 lb); and table spreads from 17 lb to 12.8 lb in 2000. While per-capita consumption of margarine remained relatively stable at 8.0 lb, butter from 9 lb to 4.6 lb. In the ’50s, the fats and oils group contributed the most fat to the food supply, 41%, followed by the meat group at 32%. In 2000, the fats and oils group accounted for 53% of total fats. Margarine, salad dressings and mayonnaise, cakes and other sweet baked goods, and oils continue to appear in the “Top 10” foods for fat contribution (USDA, 2003b).
But when it comes to fats, Americans are choosing healthier options. Heart-friendly olive oil and canola oil captured a 23% share of the salad and cooking oil market in 2000, up from less than 4% in 1985. Simmons Research Bureau reports that almost every American uses some kind of butter or oil—156 million use margarine and spreads, 155 million butter, 138 million cooking sprays, 183 million salad and cooking oil, and 181 million peanut butter (MarketResearch.com, 2002). Vegetable oils are the most popular oil, used by four in ten consumers, olive oil 25%, pure canola oil 23%, pure corn oil 10%, blended vegetable oil 4.6%, sunflower oil 2.1%, and safflower oil 1.8%. Although butter outsold margarine last year for the first time in a long time, margarine blends and spreads had a 28% share of mass-market U.S. retail sales of edible fats and cooking oil in 2001, closely followed by butter 24%, peanut butter 17%, vegetable oils 16%, olive oil 8%, cooking spray 4%, shortening 3%, lard 1%, and specialty nut and fruit butters just under 1% (MarketResearch.com, 2002).
--- PAGE BREAK ---
Besides the plethora of new heart-friendly ingredients and blends including plant sterols and stanols, a number of new convenience innovations and taste-driven products will help keep the category strong. Land O’Lakes introduced two new products to make butter easier to use: Spreadable Butter with Canola oil and Soft Baking Butter with Canola Oil. European butters which are richer, creamier, and have more than 80% fat, such as Keller’s Creamery’s Plugra European Style Butter, are fast gaining in popularity, as is old-fashioned milk with the cream on top. Other creative entries are Whipped Squeeze by Unilever’s Best Foods; I Can’t Believe It’s Not Butter, and Shedd’s Country Crock Whipped Easy Squeeze.
Other trendy category offerings include Soofer Co.’s Sadof’s Pure Grapeseed Oil, and coarse ground peanut butters from Peanut Better, Inc., in sweet (vanilla cranberry and peanut praline) and savory (spicy southwestern and Thai ginger and red pepper) versions.
And nut and fruit butters—with a natural health edge—have tremendous potential. N’Spired Natural Foods’ Maranatha’s Almond Butter has no added oils, hydrogenated oils, trans fats, sugar, artificial flavors, colors, or preservatives.
The return of classic sauces such as bordelaise and hollandaise will also contribute to Americans’ fat quotient. Barbecue, marinara, and honey mustard remain the most frequently menued sauces in chain restaurants. Tartar sauce mentions jumped 23% in the past two years, with new variations including jalapeño, red chili, Southwest, red pepper, and Creole mustard (CAMS, 2003b). In-home trial of cooking sauces has also increased. Barbecue tops the in-home trial with 97% of meal planners using the product, followed by Cajun 61% (up 7% from 2001); Tex-Mex 56% (up 9%); mesquite 52% (up 3%); Creole 37% (up 4%); curry 36% (up 2%); Szechwan 36% (up 5%); Thai 33% (up 7%); sushi 27% (up 3%); Vietnamese 25% (up 6%); Caribbean jerk 20% (down 2%); and Tandoori 12% (up 2%) (MSI, 2002a).
Watch for more Asian and Mediterranean variations on salad dressings and marinades, more light savory and herbal flavors, pungent mixtures of fruit and balsamic vinegar, more lower-calorie and lower-fat SKUs, and lots and lots of flavored oils and vinegars.
by A. Elizabeth Sloan, Contributing Editor
The author is President, Sloan Trends & solutions, Inc., P.O. Box 461149, Escondido, CA 92046 ([email protected]).
References
ACNielsen. 2002. Frozen Mexican sales by product type. Latest 52 weeks (Dec. 28, 2002). New York, NY. www.ACneilsen.com.
BMC. 2002a. Fruit drinks gain on 100% juices in stable fruit beverage market. Press release, May 24. 2002. Beverage Mktg. Corp., New York. www.beveragemarketing.com.
BMC. 2002b. U.S. wine and spirits consumption increased in 2000 and earnings for both advanced. Press release, Jan. 14. Beverage Mktg. Corp., New York. www.beveragemarketing.com.
BMC. 2003a. U.S. soft drink sales increased 0.8% in 2002. Press release, Feb. 24. Beverage Mktg. Corp., New York. www.beveragemarketing.com.
BMC. 2003b. Soft drink companies make a splash in the bottled water market. Water persists as the fastest growing category. Press release, April 10. Beverage Mktg. Corp., New York. www.beveragemarketing.com.
CAMS. 2002a. Crunch! Food Beat, Inc. Chain Account Menu Survey reports, CAMS-Base™ menu data base. Chain Account Menu Survey, Wheaton, Ill. www.foodbeat.com.
CAMS. 2003b. Tartar sauce with a new look. Food Beat, 2nd Quarter newsletter, p. 4. Chain Account Menu Survey, Wheaton, Ill. www.foodbeat.com.
DMI. 2003. Driving dairy case sales. Presented by Kevin Burkum, Dairy Management, Inc. at the International Dairy-Deli-Bakery Association Annual Meeting, Las Vegas, June 1-3. www.extraordinarydairy.org.
FMI. 2003a. Speaks! Food Mktg. Inst., Washington, D. C. www.fmi.org.
FMI. 2003b. Consumer Trends in the United States. Food Mktg. Inst., Washington, D.C. www.fmi.org.
FMI. 2003c. U.S. consumer attitudes and the supermarket. Food Mktg. Inst., Washington, D.C. www.fmi.org.
FMI/Prevention. 2002. Shopping for health 2002. Food Marketing Inst., Washington, D.C. and Prevention Magazine, Rodale Press, Emmaus, Pa. www.fmi.org.
Frey, W.H. 2002. Married with children. Am. Demograhics 25(2): 17-19. www.demographics.com.
HealthFocus. 2003. 2003 trend survey. Atlanta, Ga. www.healthfocus.net.
IDDBA. 2003a. The sandwich jackpot: Stacking the deck. An independent consumer research study conducted by Thomas Opinion Research for IDDBA, presented at IDDBA annual meeting, Las Vegas, Nev., June 3. Intl. Dairy-Deli-Bakery Assn., Milwaukee, Wis. www.iddba.org.
IDDBA. 2003b. What’s in store 2004; Annual trends report.Intl. Dairy-Deli-Bakery Assn., Milwaukee, Wis. www.iddba.org. In press.
IFPA. 2003. Sales of fresh-cut salads and spinach. Intl. Fresh-cut Produce Assn., Alexandria, Va. www.fresh-cuts.org.
IRI. 2002a. What do Americans really eat? Consumer survey. Information Resources, Chicago. www.infores.com.
IRI. 2002b. InfoScan supermarket-only data 52 weeks ending 7/14/02. Information Resources, Chicago. www.infores.com.
IRI. 2002c. InfoScan Reviews, Food, Drug, Mass, 52 weeks ending 10/06/02. Information Resources, Inc., Chicago. www.infores.com.
IRI. 2002d. IRI InfoScan Reviews. F/D/Mx. Year ending Dec. 31, 2002. Information Resources, Inc., Chicago. www.infores.com.
IRI. 2003a. InfoScan supermarket-only data, 12 weeks ending 2/23/03 vs 1 year ago. Information Resources, Chicago. www.infores.com.
IRI. 2003b. IRI Food/drug/mass with Wal-Mart sales of the fluid milk category. Year ending 4/20/03. Information Resources, Inc., Chicago. www.infores.com.
IRI. 2003c. IRI snapshot of supermarket sales for the 52 weeks ending Jan. 26, 2003. RFF Retailer, April/May, pp. 34, 36, 38.
IRI. 2003d. What’s hot? 10 sub-categories showing biggest percent gains in unit sales. Frozen Food Age 51(10): 14.
Heller, W. 2002. 55th Annual consumer expenditure study. Progressive Grocer 81(13): 15-18, 20, 23, 24, 28, 30, 38, 40, 42.
Major, M. 2002. New standards in produce. Progressive Grocer 81(9): 70-71.
MarketResearch.com. 2002. The changing face of edible fats and cooking oils. New York, N.Y.
MSI. 1999. The Gallup study of dinner eating habits. Multi-sponsor Surveys, Princeton, N.J. [email protected].
MSI. 2001. The 2001 Gallup study of attitudes toward and consumption of lunch foods. Multisponsor Surveys, Princeton, N.J. [email protected].
MSI. 2002a. The 2002 Gallup study on changing food preparation & eating habits. Multi-sponsor Surveys, Princeton, N.J. [email protected].
MSI. 2002b. The 2002 Gallup study of pre-teen children’s nutrition and eating habits. Multisponsor Surveys, Princeton, N.J. [email protected].
MSI. 2002c. The Gallup study on cholesterol lowering. Multi-sponsor Surveys, Princeton, N.J. [email protected].
NBJ. 2003. 2002 Functional foods report. Nutrition Business J., San Diego. www.nutritionbusiness.com.
Neilsen, J. and Popkin, M. 2003. Patterns and trends in food portion sizes 1977–1998. J. Am.. Med. Assn., Jan., pp. 22-29.
NFI. 2002. U.S. Fish and Shellfish Consumption. Natl. Fisheries Inst., Washington, D.C. www.nfi.org.
NMI. 2003. The NMI Health & Wellness trends database. Natural Marketing Inst., Harleysville, Pa. www.nmisolutions.com.
NPD Group. 2001. NPD reports Americans like eating meals at home, but not preparing them. Press release Nov. 26, 2001. Port Washington, NY. www.NPDFoodWorld.com.
NPD Group. 2002a. Hectic American lifestyle causing decline in home-made lunches. “What’s For Lunch?” Press release May 8. Port Washington, N.Y. www.NPDFoodWorld.com.
NPD Group. 2002b. “Breakfast in America” report examines what Americans eat for breakfast and where. Press release September 25. Port Washington, N.Y. www.NPDFoodWorld.com.
NPD Group. 2003a. 17th annual national eating trends report. Port Washington, N.Y. www.NPDFoodWorld.com.
NPD Group. 2003b. NPD finds cooking without cookware is becoming the American way. Fewer skillets and more frozen foods. NPD Kitchen Audit. Press release May 8. Port Washington, N.Y. www.NPDFoodWorld.com.
NPD Group. 2003c. The state of the restaurant industry. NPD finds a loss of appetite for eating out. Press release April 24. Port Washington, N.Y. www.NPDFoodWorld.com.
NPD Group. 2003d. The NPD Group reports slight increase in consumer restaurant spending. Press release March 10. Port Washington, N.Y. www.NPDFoodWorld.com.
NPD Group. 2003e. Will summer heat up the restaurant industry? Press release June 4. Port Washington, N.Y. www.NPDFoodWorld.com.
NPD Group. 2003f. What’s in kid’s school lunch bags? Press release July 13. Port Washington, N.Y. www.NPDFoodWorld.com
Roper ASW. 2002. Food trends in America presentation. RoperASW, New York. www.roperasw.com.
Strzelecki, M. 2003. Dancing on the bat. Snack Food Wholesale Bakery 92(5): 14, 16-18.
Technomic. 2003. The 2003 Technomic Top 100: Update and analysis of the 100 largest U.S. chain restaurant companies. Technomic Information Services, Chicago. www.technomic.com.
USDA. 2003a. Economic Research Service’s sales estimates for food consumption: 2002. Econ. Res. Service, Agric. Mktg. Service, U.S. Dept. of Agriculture, Washington, D.C. www.ams.usda.gov/ondex.htm.
USDA. 2003b. Profiling food consumption in America. Chpt. 2 in “Agricultural Fact Book, 2001-2002.” U.S. Dept. of Agriculture. U.S. Govt. Printing Office, Washington D.C. www.ams.usda.gov/index.htm.