
Shopping the Perimeter
Consumers have gravitated away from the center of the store, drawn to perishables like produce, seafood, dairy, refrigerated meals, and fresh bakery and deli products, which translates to strong opportunities in these categories.

There’s no doubt that the future of food is in fresh. Fresh is second only to low price as the most desired food label term at retail (HealthFocus, 2011). The quality/selection in fresh departments is the third-most-important factor for consumers when they are choosing a supermarket, right after low prices and a clean, neat store (FMI, 2012a).
Forty-four percent of meal preparers say it’s very important—and an additional 29% say it’s somewhat important—that dinner is made primarily of fresh, not processed foods, up 7% over the past two years (MSI, 2011).
The perishables department’s contribution to total store sales—29% in 2011—is on the rise. Meat accounts for the largest share—39% of fresh dollar sales, followed by produce at 32%, deli 16%, bakery 7%, and fish/seafood 5%. Shopping carts that contained fresh items were 1.5 to 2.1 times larger than average (Nielsen, 2012a).
Despite rising average retail prices—meat up 4.7% for the year ended (Y/E) 9/29/12, bakery +4.5%, deli +2.8%, seafood +2.7%, and produce +1.5 %—sales volume is up or steady in all departments. Seafood posted the largest volume gains, +4.3%, deli +4.0%, produce +2.7%, and meat +0.5% for the time period (Nielsen, 2012a).
Emphasis on perishables remains the most frequently used and the most successful retailer strategy. Grocery retailers rank it No. 1 for successfully driving traffic/sales, with an average of 8.5 on a 10-point scale, where 10 is extremely effective (FMI, 2011a).
More affluent couples and singles and, to a lesser degree, upscale families—all of whom have an increased emphasis on healthy lifestyles including natural and organic foods, are more foodie-focused and enthusiastic about cooking, and are frequently pressed for time—are driving fresh food growth. Combined, these demographic groups account for 27% of all fresh sales or $24 billion per year (Nielsen, 2012b).
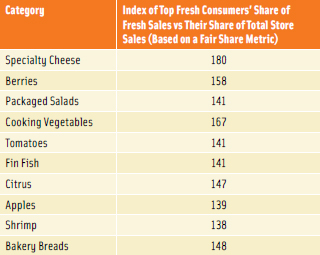 These shoppers, who spend the most on fresh foods, are most likely to overspend on produce and gourmet products such as specialty cheese, packaged salads, and fin fish (Nielsen, 2012b; Figure 1). Surprisingly, meat—especially fresh beef and pork—under indexes with top fresh consumers. In fact, eight of the 10 most under-indexed categories for fresh consumers were meat categories.
The Drivers
While staples remain the largest perishables category, fresh products that fit into four main consumer priority areas are proving the most successful and outpacing staple sales in developed categories; these areas are convenience, premium/indulgent, multi-cultural/global, and health (Nielsen, 2012a).
Staples, which represent 62% of perishables sales, will continue to be fueled by the ongoing trend to at-home eating (Nielsen, 2012a). In a typical week, five evening meals are prepared at home, one is eaten away from home, and one involves takeout, ordering in, or a drivethrough purchase (FMI, 2012b).
In 2011, 41% of consumers ate at home much more often; 26% did so somewhat more frequently. Eight in 10 (81%) cooked more meals from scratch; 40% bought more packaged/prepared meals that only required reheating; 32% bought more products that required some added ingredients; and 15% purchased more ready-to-eat meals from the supermarket (IDDBA, 2011a).
Sales of convenience items in fresh departments exceeded $19 billion in 2011. Deli prepared chicken volume grew 4% to $3 billion, and sales of valueadded vegetables climbed 14% to $1 billion (Nielsen, 2012a,b).
Fresh refrigerated meals/entrees were the seventh-fastest-growing consumer product goods category last year (IRI, 2012). Moreover, more adults are eating alone; in 2011, 46% of all eating occasions were alone. Those who are dining alone tend to opt for fresh prepared meals vs frozen dinners (Hartman, 2011).
Enthusiasm for cooking is at an all-time high; 83% of consumers like to experiment with new recipes. Over half (55%) have tried to replicate a restaurant meal/meal from travel, 32% regularly read a cooking or food blog, and 31% regularly spend three hours preparing one meal at least once a week (Mintel, 2011a).
Six in 10 consumers are willing to spend more money for ingredients of the highest quality, 55% buy ingredients from different countries for specific recipes, 41% buy products that they’ve seen on television cooking shows, and 33% have upgraded their kitchens to accommodate their gourmet activities (Mintel, 2011a).
--- PAGE BREAK ---
Among premium and indulgent products, lobster jumped 27% in volume to $209 million, and sales of specialty dessert cakes climbed 14% to $51 million (Nielsen, 2012a). Among multicultural offerings, chorizo sausage volume grew 7% to $72 million, hummus 11% to $392 million (Nielsen, 2012a).
With consumers spending less money eating out, the number of per capita meal purchases at foodservice locations fell from 215 in 2000 to 195 in 2011. Consumers appear willing to splurge on premium products to replicate the restaurant experience at home (NPD, 2012). One in 10 shoppers now buys more premium cuts of proteins instead of going to restaurants (FMI, 2012b).
More than one-third (37%) of consumers are entertaining more at home than last year (Wyatt, 2012). One-third use gourmet products for at-home get-togethers (Tanner, 2011).
Eating more fresh foods is a health strategy for 60%; 55% say they are eating fewer prepared/processed foods (NGA, 2011). Seven in 10 consumers believe fresh items are much healthier (Technomic, 2010). Sales of salmon were up 25% to $845 million, berries were up 11% to $3 billion for Y/E 9/29/12 (Nielsen, 2012a).
With drug, dollar, and convenience stores all expanding their fresh offerings, the competition for the fresh dollar is tougher yet. By 2015, Nielsen projects the retail fresh dollar market share will be 62% grocery stores, 14% mass merchandisers/supercenters, 12% club stores, and 11% remaining retail venues (Nielsen, 2012a).
Stretching the Meat Dollar
Shoppers continue to compensate for high prices at the meat counter by adapting their choices, cuts, and quantities. Out of the five home-cooked dinner occasions in a typical week, 4.1 still include meat/poultry. Just over half (53%) of shoppers serve chicken 1–3 times per week, 52% beef, 42% pork, 40% fish/seafood, 19% turkey, 5% lamb, and 4% soy meat alternatives (FMI, 2012b).
Nearly three-quarters (73%) of shoppers buy less expensive cuts of meat/poultry every time they shop or frequently; 61% are eating more casseroles/pasta dishes, and 52% buy/cook meat less often. Interest in bulk meat purchases fell for the second year in a row (FMI, 2012b).
Nine in 10 shoppers (85%) regularly marinate their meat/poultry, up 10% vs 2010. One-third (36%) use their own mix, 58% a store-bought marinade, and 6% pre-marinated meat/poultry (FMI, 2012b).
More than one-third (37%) of consumers would be interested in meal kits that include a raw protein with optional marinades/flavorings on the side; 61% would like a complete meal kit with raw protein, vegetable, and starch to make a balanced meal (IDDBA, 2011a).
Bourbon/whiskey, Mornay, and Romesco are among the ready-for-trial sauces for chicken; Thai curry, cilantro-cream, and mango for pork; and Madeira, Ponzu, and Thai-chili for steak (Technomic, 2011a). Consumers also want smaller pieces of protein in each pack and say they would buy more chicken if pieces were smaller and if more recipes were included (Mitchell, 2012a). Smaller pieces/packages also align better with the two largest household demographics: empty nesters and singles (U.S. Census, 2010).
With ethnic cooking at home at an all-time high in terms of frequency and variety, pre-prepared meats for ethnic recipes (e.g., stir-frys and fajitas) are in demand. While Mexican, Italian, and Chinese are the most frequently prepared cuisines, 29% of consumers often make fusion recipes, which combine diverse cuisines—26% Spanish tapas, 24% non-Mexican Hispanic items, and 23% Cajun/Creole (Mintel, 2012a).
There are 54 million Hispanics in the United States, which suggests that the demand for their favorite protein cuts will continue to grow. Milanesa, Carne Molida, Costillas, Ranchera, and Carne para Deshebrar are the most popular Hispanic cuts of meat (Mitchell, 2012b).
American Culinary Federation (ACF) chefs cite newly fabricated cuts of meat (e.g., pork flat iron); smaller portion sizes; street food–inspired main courses (e.g., tacos, satay, kabobs); inexpensive cuts of meat (e.g., brisket, skirt steak); and tapas/meze/dim sum among the top center-of-the plate trends for 2012. So clearly the trend to less expensive and smaller protein portions will continue (NRA, 2011).
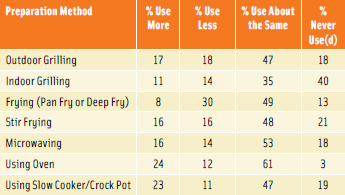 Over the past five years preferred preparation techniques have also changed (Figure 2); pan/deep frying fell 22%, whereas oven and slow-cooker use each rose 12% (FMI, 2012b). Smoking, braising, grilling, and roasting are among the trendy preparation methods (NRA, 2011).
Although weekly consumption did not increase over last year, only one-third (34%) of shoppers never buy heat-and-eat meat/poultry; 31% never buy ready-to-eat (FMI, 2012a).
The cut and the breed (e.g., Berkshire pork or Angus beef), cited by more than two-thirds of consumers, are the top factors that define premium quality for pork/beef. Four in 10 would be willing to pay more for Angus beef, 31% for sirloin, 29% Kobe, and 17% Wagyu beef (Technomic, 2011b).
About 30% of consumers would be very interested in buying freerange chicken, country ham/bacon, or grass-fed beef; 20% wild game, skirt steak, ethnic meats or Kobe/Wagyu beef; and 10% hanger steak, tripe, or tongue (IDDBA, 2011a).
--- PAGE BREAK ---
More than half (55%) of consumers think extra-lean meat is much more healthy, one-third believe that of organic/natural, and 28% lean. In 2012, 24% of shoppers purchased organic meat/poultry, up from 20% in 2011 (FMI, 2012b).
About half (49%) of consumers say it is important that meat comes from animals that are humanely treated; four in 10 believe it is important that they roam free (Technomic, 2011b).
One-quarter (27%) of adults perceive antibiotics/hormones fed to poultry/livestock as a serious health risk; 34% are willing to pay more for U.S.-raised meat (FMI, 2011b; 2012b).
Lastly, with home entertaining on the rise, fresh meat-based appetizers (e.g., bake-and-serve empanadas, mini riblets with signature sauces, and pre-dressed roasts will find a welcome market.
Beyond Ranch Dressing
While berries posted the largest gains in the produce department, other bright spots included value-added vegetables with volume up 9.8% for Y/E 6/20/12. Peppers are up 2.4%, cooking vegetables/greens 2.3%, value-added fruit 1.7%, and packaged salads 1.3%. Melons fell 10.9%, grapes 5.3%, potatoes 3.8%, and lettuce 1.7% (Mitchell, 2012c).
With 27% saying they’d eat more vegetables if they knew how to prepare them, it’s not surprising that fresh-cut side dish kits with sauce that microwaves in the bag (e.g., Greenline Foods’ Side Kits in varieties like Classic Almondine) have found a welcome market (Mintel, 2012b).
In addition, with 59% of adults eating a salad as a meal at least once a week, marketers are focusing on the center of the plate with stirfrys and more upscale salad mixes like Fresh Express Pear Gorgonzola Kits (Mintel, 2012b). After chicken, bacon, ham, and turkey are the preferred salad proteins. Cheese, olives, nuts, snow peas, apple slices, avocados, tortilla strips, beans, and berries are other up-and-coming toppings (Technomic, 2012).
Ranch, Italian, Caesar, and balsamic vinaigrette are the favored dressings, but flavored versions are now essential. Expect Greek, Asian, ginger, and peanut dressings to get more attention (Technomic, 2012).
Portable fresh-cut snacks are another trend with high potential; 59% of consumers eat fresh fruit as a snack at least twice a week (Mintel, 2012b). Naturipe BerryQuick Snacks have positioned blueberries as a grab-and-go snack.
With ACF chefs and fast food operators citing healthy kids’ sides/meals and children’s entree salads as hot menu trends, fresh produce snacks (e.g., Stemilt World Famous Fruit’s Lil Snappers kid-size whole fruits) will be in great demand.
Warm appetizer salads and vegetarian/vegetable starters are among the hot appetizer trends; black garlic, vegetable ceviche/seviche, flower syrups/essence, and vegetable chips are trendy new foods/ingredients (NRA, 2011).
Antioxidant-rich commodities, led by avocados, asparagus, bell peppers, blueberries, and broccoli, top the list of produce items that shoppers buy now but didn’t before (Packer, 2012).
Three in 10 shoppers would be very interested and 42% would be somewhat interested in identifying and calling out phytochemicals on package labels (IDDBA, 2011a). Varietals, especially for apples, citrus (e.g., clementine), and peppers are now proven to have great appeal (Packer, 2012).
Organic produce purchases of every commodity are up over last year. A devoted 27% typically buy organic produce; 28% of produce consumers did so for food safety reasons or to avoid chemicals/pesticides. One-third of shoppers are buying more local produce than they did one year ago (Packer, 2012).
Go Fish
Fin fish, led by salmon, is the largest contributor to seafood department sales; it is followed by shrimp, crustaceans, and mollusks (Major, 2012a). Volume sales of cod/scrod grew 13%; oysters 11% (Mitchell, 2012d).
Prepared seafood meals were the fastest-growing seafood sector, up 24% in volume per store for Y/E 10/12/11; surimi volume was up 4.3%. Value-added oven-ready fillets were the fastest-growing prepared item (Major, 2012a).
One in five consumers (18%) eat fresh fish from a fish counter two to three times a month; 11% do so once a week or more. For fresh shellfish, the data are, 13% purchase it from a seafood counter two to three times a month; 4% do so once a week or more. And 8% eat prepared fish/shellfish from the counter two to three times a month; 3% do so once a week or more (Mintel, 2012c).
In 2011, shrimp topped the list for per capita consumption followed by canned tuna, salmon, pollack, tilapia, Pangasius, catfish, crab, cod, and clams. White fish consumption continues to grow (NFI, 2012). With nontraditional fish (e.g., branzino, Arctic char, and barramundi) among the trendy main dishes for 2012, expect to see more lesser-known species on fish counters (NRA, 2011).
--- PAGE BREAK ---
Watch for more tilapia, the fastest-growing item on seafood menus over the past five years, followed by Mahi-mahi, anchovies, Ahi tuna, sea bass, haddock, calamari, whitefish, and salmon; panko-crusted and tacos were the top two seafood preparations (Datassential, 2012).
More than half (57%) of grocery stores offer sushi stations (Finkel, 2012). Buerre blanc, ponzu, ginger cream, and mango are the ready-for-trial flavors for fish/shellfish (Technomic, 2011a).
In terms of seafood and sustainability, buying species with an adequate supply is important to 84% of consumers, sustainably sourced is important to 82%, dolphin-friendly 72%, country-of-origin/catch area 69%, well managed farm-raised 65%, caught in the wild 62%, and catch method 59% (Mintel, 2012c).
Dinner by Deli
Prepared foods, up 8%, accounted for 52% of deli revenues in 2011, followed by deli meats 23%, cheese 19.8%, and beverages 4.3% (Mitchell, 2012e).
Chicken generates the largest share of prepared food dollar sales (26.6%), up 5.5% for Y/E 3/31/12; it is followed by salads at 17.8%, +4.2%; entrees 12.1%, +8.9%; sandwiches 12%, +2.2%; and dips/spreads/toppings 7.7%, +9.7% (Major, 2012b).
In the prepared food section, snacks posted the largest gains in volume sales, up 23.3%. Snacks were followed by breakfast foods +16.2%, pizza +12.3%, sushi +11.1%, condiments +8%, desserts +5.6%, side dishes +5.3%, platters +4.8%, and soups +3.2%. Only prepared sandwiches and appetizers fell slightly (Major, 2012b). Given these trends, it’s not surpising that eight in 10 deli operators (83%) plan to expand their rotisserie program in 2013; 67% plan to expand sandwich stations, 42% soup stations, 29% hot/cold bars, 21% sushi, 17% concept food stations (e.g., Asian, carving stations, etc.), and 13% antipasto bars (Major, 2012b).
At 31.5%, turkey holds the leading share of deli bulk meat sales, followed by ham 32%, beef 12.7%, chicken 6.9%, salami 5.5%, bologna 4.3%, and lunchmeat loaves 1.8% (Anon., 2012a).
But if deli foodservice managers want to grow their business, they need to keep better pace with restaurant offerings. Sliders, Caprese, pulled pork, Buffalo chicken wraps, chicken panini, brisket, hummus, Cuban, roast turkey, and chicken salad wraps are the fastest-growing restaurant sandwiches (Datassential, 2012).
Cheddar tops the list of most purchased specialty deli cheeses with Parmesan, mozzarella, feta, Hispanic, Swiss, Brie, and blue also among the most popular (Larson, 2012). Gruyere is the fastest-growing sandwich cheese in restaurants along with queso, goat cheese, white Cheddar, fresh mozzarella, pepper jack, Fontina, Gouda, ricotta, and feta (Datassential, 2012).
Charcuterie plates/samplers are among the trendy appetizers for 2012. Gourmet sandwiches and grilled cheeses are popular center-of-the plate items. Exotic rice, ancient grains, and Asian noodles are trendy side dishes (NRA, 2011).
Asian-style products, pasta, turkey, pork, and beef are the most popular prepared food entrees (Mitchell, 2012e). Expect more ethnic barbecue (e.g., Korean BBQ), main dish salads, ethnic pork dishes, and Mediterranean/Greek cuisines in 2013. Finally, about half of consumers buy lunch-meat products with healthy attributes (Mintel, 2011b).
Bakery Is Back
Single portions, seasonal specialties, and gourmet goodies are boosting sales in the in-store bakery. In late 2011, 41% of shoppers bought in-store bakery items within a given week; 31% purchased them within the past two weeks (Mintel, 2011c).
Cakes are the largest bakery subcategory, generating 28.9% of revenues for Y/E 3/31/12, followed by bread 18.8%, rolls 10.3%, cookies 10%, doughnuts 7.4%, sweet goods 7.1%, and pies 6.2% (Mitchell, 2012f). Specialty desserts enjoyed the largest sales gains in this timeframe, up 9.5%; cookie sales were up 5.6%, cakes +4.4%, pies +3.7%, and brownies/dessert bars +0.8% (Mitchell, 2012f).
In 2011, Italian or French bread was the most frequent in-store bakery bread purchase, bought by 44%; bagels were purchased by 38%, whole grain 34%, artisan 22%, sourdough 19%, tortillas (not packaged) 17%, and pita/Middle Eastern 11% (Mintel, 2011c). The International Dairy-Deli-Bakery Assn. reports that 37% of shoppers would be very interested in buying cheese breads; 30% flat-bread, herb-infused, or ethnic breads; 28% panini; and 25% seeded breads (IDDBA, 2011a).
Half of all shoppers bought at least one bakery cake in 2011, up 4% to more than $2 billion (Licata, 2012). Red velvet, peanut, chocolate ganache, vanilla bean, buttermilk, dark chocolate, Oreo, triple chocolate, butter cream, and truffle are the fastest-growing cakes in restaurants (Datassential, 2012). Just over half of all shoppers (52%) bought fresh cookies, 46% donuts, 33% muffins, 26% Danish/pastry, and 20% croissants.
Peanut butter, chocolate, cinnamon, almond, lemon, coconut, hazelnut, ginger, maple, honey, toffee, and caramel are the cookie flavors shoppers find most appealing (Technomic, 2010).
Expect more interest in Oreo cookie, peach, pumpkin, blueberry, coconut cream, peanut butter, cherry, key lime, banana cream, lemon meringue, and vanilla custard pies; they are the top gainers on restaurant menus (Datassential, 2012).
--- PAGE BREAK ---
Sales of specialty desserts are led by eclairs, cannoli, dipped/covered fruits, cream puffs, fudge, cobblers/crisps, custards/puddings, assorted dessert trays, Baklava, and Napoleons (Facienda, 2012). Ethnic and pudding-like desserts are on the rise. Mexican galletas and polvorones, Parisian macarons, and Asian tea cookies are among the best-selling ethnic cookies (IDDBA, 2011b).
Individual portion sizes are important to 31% of shoppers; take-and-bake is of interest to 24% (Mintel, 2011c). Bite-size/mini desserts, savory desserts, deconstructed classic desserts, cupcakes, and lollipops are among the 2012 trendy treats (NRA, 2011).
Made with whole grains (sought by 65% of shoppers), made with real fresh fruit (64%), all natural (61%), and low-fat (54%) are the healthful attributes shoppers are seeking most in the bakery products they purchase (IDDBA, 2012).
Lastly, the gluten-free market has peaked. In the past two years, it has failed to attract new users; 18% of consumers purchased gluten-free products in 2012, up only 3% from 2010 (Packaged Facts, 2012). The proportion of consumers who think gluten-free is a gimmick doubled during this period (11% to 24%); one in five consumers says gluten-free is a fad.
Fresh From the Dairy Case
Milk, natural cheese, and yogurt dominate the dairy case, accounting for half (47%) of dollar sales and 56% of gains for Y/E 8/12/12. Refrigerated juices/drinks, fresh eggs, salad/coleslaw, processed cheese, creams/creamer, butter, and refrigerated side dishes round out the top 10 categories (Schmitz, 2012).
Milk, with annual sales of $11.6 billion, has struggled with volume declines, down 3.9% during the past year (Schmitz, 2012). Marketers are focused on breakfast, chocolate milk as a sports drink, new channels of distribution, functional ingredients, flavors, and seasonal favorites to increase milk sales. Magic Straws offers flavoring straws designed for kids and available in 13 flavors.
Although 87% of the milk category is made up of white milks, sales of kefir/milk substitutes/soy, and almond milk are red hot, accounting for more than 40% of category dollar growth (Schmitz, 2012).
Sales are up across all segments for natural cheese; unit sales are off nearly 5% for processed cheese. Interesting flavor options, artisan cheeses, portion control, portability, bold flavors, and convenience continue to drive cheese sales.
Natural shredded and natural chunk cheeses are the most popular varieties, followed by slices and strong cheeses. The biggest cheese category gains came from refrigerated grated cheese with units up 14.7%, natural slices, natural shredded, natural crumble, and natural string cheese (Kennedy, 2012a).
All natural is important in the cheese purchase decision for 56% of shoppers, made locally for 32%, organic 27%, and award-winning 26% (Mintel, 2012d).
Artisan cheese ranks second on the list of trendy food items and ingredients for 2012, Greek yogurt is fourth, and ethnic cuisine cheeses (e.g., queso fresco, paneer, lebneh, and halloumi) also made the list (NRA, 2011).
Cheddar, mozzarella, and American cheese are the most consumed cheeses. Those ages 25–34 are the most likely to eat the less common cheeses like Gouda, Brie, and Edam (Mintel, 2012d).
More than half (55%) of kids ages 6–11 eat string cheese food/snacks, 41% crackers and cheese, and 29% cheese cut from chunks (Mintel, 2012d). Reduced-fat is an important selection factor for 49% of consumers, sodium 46%, and calories 42% (Mintel, 2012d).
Yogurt is the third-largest category in refrigerated dairy with annual sales of $4.8 billion. Yogurt’s dollar growth of 8.6% is the highest rate among the top 10 refrigerated dairy categories; 71.3% of households purchase yogurt (Schmitz, 2012).
Greek yogurt now accounts for 33% of yogurt sales, up from 16% in 2011 (Webber, 2012). Greek-style, fortification, bold flavor, probiotics, smaller portion size, foodservice opportunities, and organic drive yogurt sales. Sales of cultured dairy products (with the exception of yogurt) are stagnant (Kennedy, 2012b).
New flavors, higher fat content, and new convenience options are moving butter into the spotlight; unit sales are up 5.5% for Y/E 8/12/12 (Carper, 2012). Land O’Lakes’ Sauté Express is an olive oil/butter blend sauté starter available in Italian Herb and other flavors.
Organic Valley Grassmilk from 100% grass-fed cows is a new innovation in the dairy case as is Smart Balance fortified milk for kids. Strawberry milk and premium vodka are paired in Adult Strawberry Milk, a new offering from Adult Beverage Co. that is targeted to grown-ups.
In the $3.3 billion egg segment, unit sales of Eggland’s Best added-value eggs are up 13.7% for Y/E 1/22/12, second only to private label eggs (Anon., 2012b). Nontraditional eggs (i.e., duck, quail, and emu) are also getting attention (NRA, 2011).
 A. Elizabeth Sloan,
a Professional Member of IFT and Contributing Editor of Food Technology, is President, Sloan Trends Inc., 2958 Sunset Hills, Suite 202, Escondido, CA 92025 ([email protected]).
References
Anon. 2012a. Deli bulk meat. Grocery Headquarters 78(9): 74.
Anon. 2012b. State of the industry almanac. Grocery Headquarters 72(4): 82.
Carper, J. 2012. Butter is ready for its close-up. Dairy Foods 113(11): 60-62.
Datassential. 2012. DatassentialMTD trends to watch. QSR magazine 163: Jan. 3-23.
Facienda, V. L. 2012. A sweet spot. Perishables Buyer 2(7): 18-19.
Finkel, E. 2012. Konnichiwa sushi. Perishables Buyer 2(2): 31.
FMI. 2011a. The food retailing industry speaks! Food Mktg. Inst., Arlington, Va. www.fmi.org.
FMI. 2011b. U.S. grocery shopper trends.
FMI. 2012a. U.S. grocery shopper trends 2012.
FMI. 2012b. The power of meat.
Hartman. 2011. Eating by the numbers. The Hartman Group, Bellevue, Wash. www.hartman-group.com.
HealthFocus. 2011. U.S. consumer trends survey. HealthFocus International, St. Petersburg, Fla. www.healthfocus.com.
IDDBA. 2011a. Innovation: trends, attitudes, and opportunities. International Dairy-Deli-Bakery Assn., Madison, Wis. www.iddba.org.
IDDBA. 2011b. What’s in store 2011?
IDDBA. 2012. The consumer decision tree.
IRI. 2012. CPG 2011 Year in Review. Times & Trends, Feb. SymphonyIRI, Chicago, Ill.
Kennedy, S. 2012a. Cheesemakers go for the gold. Dairy Foods 113(11): 32, 34, 36.
Kennedy, S. 2012b. Greek yogurt stars in the dairy case. Dairy Foods 113(11): 42, 44, 46-49.
Larson, B. 2012. Specialty cheese. Grocery Headquarters 77(7): 74-76.
Licata, F. 2012. It takes the cake. Perishables Buyer 2(4): 36.
Major, M. 2012a. Tidal wave of opportunity: 2012 seafood operations review. Progressive Grocer 91(3): 58.
Major, M. 2012b. On the fast track. Progressive Grocer 91(6).
Mintel. 2011a. Cooking enthusiasts—U.S. Oct. Mintel Intl., Chicago, Ill. www.mintel.com.
Mintel. 2011b. The deli consumer—U.S. Dec.
Mintel. 2011c. In-store bakeries—U.S. Sept.
Mintel. 2012a. Ethnic foods—U.S. Jan.
Mintel. 2012b. Fruit and vegetables—U.S.
Mintel. 2012c. Fish and seafood—U.S. Oct.
Mintel. 2012d. Cheese—U.S. June.
Mitchell, R. 2012a. A not-so-hot sector. Perishables Buyer 2(10): 14-16.
Mitchell, R. 2012b. An ethnic spin. Perishables Buyer 2(11): 22-23.
Mitchell, R. 2012c. Ripe opportunities. Perishables Buyer 2(10): 21-23.
Mitchell, R. 2012d. Catch the wave. Perishables Buyer 2(3): 20-22, 24.
Mitchell, R. 2012e. A focus on fast and fresh. Perishables Buyer 2(6): 28, 30-32.
Mitchell, R. 2012f. Rising sector. Perishables Buyer 2(8):31.
MSI. 2011. The 2011 Gallup study of dinner. Multi-sponsor surveys, Princeton, N.J. www.multisponsor.com.
NFI. 2012. Top 10 consumed seafoods. National Fisheries Institute, McLean, Va. www.aboutseafood.com.
NGA. 2011. Consumer survey report. National Grocers Assn., Arlington, Va. www.nationalgrocers.org.
Nielsen. 2012a. Consumer drivers of fresh food growth. The Nielsen Perishables Group, Chicago Ill. www.perishablesgroup.com.
Nielsen. 2012b. Health-focused, premium couples driving fresh food growth. The Fresh Perspective Newsletter, The Nielsen Perishables Group.
NPD. 2012. National eating trends survey. The NPD Group, Port Washington, N.Y. www.npd.com.
NRA. 2011. What’s hot survey. Oct. National Restaurant Assn., Washington, D.C. www.restaurants.org.
Packaged Facts. 2012. Gluten-free foods in the U.S. Packaged Facts, Rockville, Md. www.packagedfacts.com.
Packer. 2012. Fresh trends 2012. Vance Publishing, Lenexa, Kan. www.ThePacker.com.
Schmitz, E. 2012. Dairy products are elementary. Dairy Foods 113(11): 25.
Tanner, R. 2011. Today’s specialty food consumers. Specialty Food 41(8): C1-16.
Technomic. 2010. The dessert consumer trend report. Technomic Inc., Chicago, Ill. www.technomic.com.
Technomic. 2011a. The consumer flavor trend report.
Technomic. 2011b. The center of the plate: beef & pork consumer trend report.
Technomic. 2012. The left side of the menu: soup & salad consumer trend report.
U.S. Census. 2010. www.census.gov.
Webber, L. 2012. Yogurt: It’s all Greek to them. Supermarket News. Sept. 10. www.supermarketnews.com
Wyatt, Sally Lyons. 2012. The state of the snack industry, presented at SnaxPo, Snack Food Assn. Annual Meeting, Phoenix, Ariz., March 16-19.