
Picking Consumers' Brains with Mind Genomics
Discover the science behind the magic of this cutting-edge discipline, which provides researchers with new ways to understand and target consumers.
As food science, food technology, and food design and development mature, we see an increasing emphasis on the mantra, “understand the consumer.” At the end of the day, of course, it’s what the consumer feels about what the industry offers and how the industry behaves in critical situations that’s going to make a difference. We can pride ourselves on technological and nutritional prowess, on hygiene and safety, on variety, but it’s really up to the consumer to tell us with his dollar vote whether our offerings and our behaviors are okay or not.
 Seventy years ago the food industry woke up to the need to please consumers. It was no longer a situation of “make it and they will come.” People had to like what was offered. And the power of the consumer grew from there. It’s no surprise then that by the 1950s the industry was deeply into describing the sensations produced by a food product, with the hope of learning just what sensations would make a product a success. Nor is it a surprise that by the 1960s widespread acceptance testing was the norm; a food had to score well on a standard scale, e.g., the 9-point hedonic scale. And the story goes on, from description to testing, and now to getting insights about food using ethnography. The goal is to understand the food more profoundly, acquire insights, create a better product, and succeed in the marketplace.
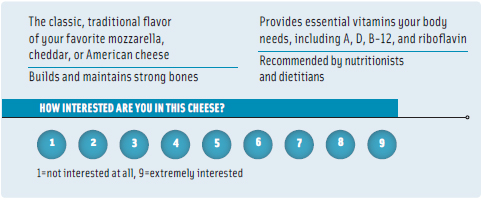 And that’s where this new science, Mind Genomics, comes in. Simply stated, Mind Genomics is the science of everyday experience. Mind Genomics works by a research tool called RDE or rule developing experimentation. RDE creates vignettes about a food, vignettes written as if they were small, easy-to-read advertisements, like the commentary included in Figure 1. The next step is presenting these vignettes to consumers, getting their reactions, and figuring out just what elements, or more specifically, what parts of these vignettes, drive interest.
We could, of course, instruct our consumers to rate each of the elements in Figure 1, one element at a time, but the reality is that by doing so we allow the consumer to “game” his answers, that is to adjust the ratings to what he or she believes the interviewer wants to hear. Mix and match the elements about a food experience, like we see in Figure 1, and the consumer respondent can no longer game the interview. Faced with the demand to rate these vignettes, one vignette after another, the consumer quickly relaxes, more or less in the way many people relax while shopping for food, and gives intuitive answers, that is ratings from the gut or ratings assigned without much mental editing.
The best way to understand Mind Genomics and its tool, RDE, is by examples. In the rest of this article we’ll illustrate what Mind Genomics can teach us about products, about mindsets, about responses to crises, and even about innovation. Our three illustrative case histories follow these five steps.
1) What is the problem? What are we looking for? What works in a product? How do we identify the mindset of like-minded consumers? How do we invent a new product? The problems may sound different, but in the world of Mind Genomics, they can be answered with the same tool.
--- PAGE BREAK ---
2) What’s the raw material? Mind Genomics works by mixing/matching ideas, presenting the ideas, getting responses to the vignettes, and deconstructing the responses to the components. So the key here is the ideas. But there’s another caveat. That caveat is that it’s better to be 75% correct and on time then 100% right but late. Or, in simpler terms, just do the experiment. Don’t worry about being right. Today’s internet-based tool, RDE, returns with data in 12–24 hours so you can always redo the experiment.
3) What is the question that the respondent is instructed to answer? When a person reads a vignette (a combination of ideas), what’s he supposed to be thinking? Does he like what he reads? What about the emotion he feels when he reads? What’s the price he’d pay? Or would he buy it at all? These are all valid responses.
4) What are we looking for in the data? Analysis is all important. Fortunately, Mind Genomics is based upon experimental design. It’s not necessary to be clever, to invent new methods. Follow experimental design to lay out the vignettes, use ordinary least squares regression, a true workhorse, to get the impacts of the elements, and you’re almost done.
5) What about segments? The hallmark of Mind Genomics is that people are different. We may think they are the same, but people react to the same information quite differently. Mind Genomics looks for groups of people who are similar to each other in the way they respond to ideas. These are mindset segments. Know the mindset segment of a person, and you know what to create for that person and how to communicate to that person.
Case History No 1: What Works?
We begin with the simple question: When we describe a food, just what types of ideas resonate with consumers? Our topic is cheese. We might ask consumers to tell us, but then they tell us that brands are important and so forth. Give them the chance to rate the elements one at a time and they’re likely to change their criterion as they move from brand to product features to health features and so forth.
Let’s try something different. Let’s mix and match 36 elements—or bite-size pieces of information as we like to refer to them—to create 60 vignettes, similar in structure to Figure 1, with each respondent evaluating a unique set of 60 vignettes. These 60 vignettes comprise the same 36 elements, with the same element appearing in different combinations, against different backgrounds. That’s the beautiful thing about using a design of experiments; it does all the work of creating these unique vignettes for us. No two people see the same set of vignettes. The RDE tool will enable each respondent to “see and rate” each vignette as a “totality,” a “gestalt,” one vignette at a time. Then to make interpreting easy for everyone concerned, we will transform our data. Instead of working with a graded scale that is often hard for managers to understand, we will work with two points: 0 (I don’t like the vignette, corresponding to ratings of 1-6) and 100 (I like the vignette, corresponding to ratings of 7-9). In practice, the process is straightforward and works as follows.
1) Assemble the elements and allocate them to silos (groups of related ideas). For cheese, and for this particular study, we will work with four silos, each with nine elements. The notion of silos and elements is a bookkeeping device to ensure that elements of a similar type, but with contradictory messages, don’t appear together in the same vignette.
2) Invite the respondent to participate by a short e-mail invitation, usually sent from a reputable field service so the e-mail doesn’t end up in the spam box.
--- PAGE BREAK ---
3) Orient the respondent. Respondents aren’t necessarily accustomed to reading sets of three or four phrases and rating them as a gestalt. They need a moment’s instruction. They get it pretty quickly once they realize that they have to rate all of the elements in the vignette as a single entity.
4) Present the vignettes, one at a time, get the ratings, and convert the ratings to the binary 0/100. Figure 1 showed us what a vignette looks like.
5) Use OLS (ordinary least squares) regression to create an equation showing how each of the 36 elements drives the response (0 = uninterested; 100 = interested).
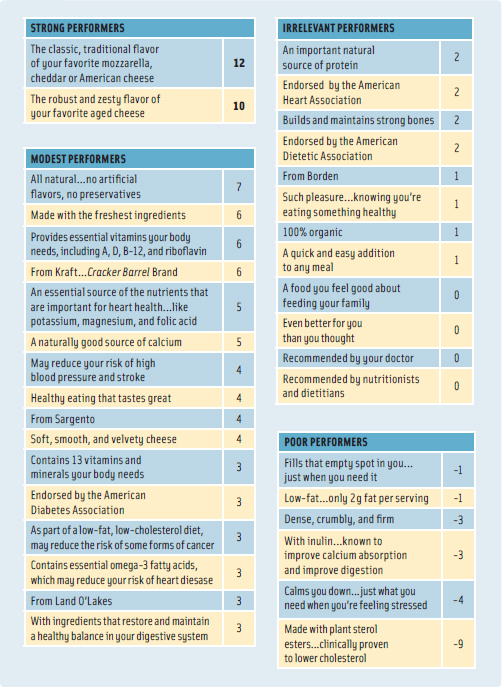 So what did we find? Mind Genomics emerges from these studies with results that are blindingly clear. Let’s look at just a few of these results in Table 1. Table 1 shows the performance of the elements emerging after we related the presence/absence of the elements to the binary rating 0 (original rating 1–6) or 100 (original rating 7–9).
We start with the additive constant, 49. This means that 49% of the 241 respondents, virtually half, were willing to rate cheese 7–9, on the basis of the fact that the vignette or concept talks about cheese. Our consumers were ready to give cheese a pass just because it’s cheese, a well known product. The additive constant factors in this basic, ingoing interest.
The impact value, the numbers in the body of the table, show the additional percentage of respondents who would give a concept about cheese a rating of 7–9 when the element is incorporated. Look for big numbers, 10 or higher. These are big-hitting elements. Here we only have two, and both talk about the basic food, the WiiFM or “what’s in it for me.” Here they are, the word pictures promising a sensory delight: “The classic, traditional flavor of your favorite mozzarella, cheddar, or American cheese” and “the robust and zesty flavor of your favorite aged cheese.”
It’s clear that some of the elements we chose are strong performers, that some are weak performers, that brand names don’t do much, that most health messages don’t do much, and that the big opportunities are with product description.
--- PAGE BREAK ---
 Now that we know what’s happening with our 241 respondents, maybe we can get better news by breaking the data apart into what the genders say, what the age groups say. Mind Genomics lets us create the model for each person. Our 241 respondents can be classified as males vs females, under 40 years old vs 40 and older, and so on. Now let’s look at Table 2.
We see a little more promise when we look at the conventional breaks by gender and by age. There are a few more strong performers as shown in Table 2. The key here is that whereas there may be a few more strong performers, there’s no big story—nothing to use for a new product thrust.
The real payout comes from dividing our 241 respondents, not by age or gender, nor even by what they say is important. Rather, it’s by the pattern of how they react to cheese, i.e., the pattern of reactions to this limited world we are studying.
When we break apart the responses using methods known generically as clustering, we end up with three radically different clusters and some elements that perform very strongly. In fact, the mindset segmentation points us to a group of respondents who are profoundly interested in the “healthful specifics” of cheese. They didn’t come in wanting to tell us that they are so interested, and they couldn’t have gamed the system. There is just too much happening in a test vignette like Figure 1. But their subconscious took over.
Our RDE tool was able to tease out this group. Their responses make sense. We get a sense of their mind, just from the pattern of their reactions. We begin to see some powerful outcomes of the experiment. Cheese isn’t the same thing to all people.
Now that we know these segments, we realize that there is a substantial segment that is interested in cheese products with defined healthful characteristics. Table 2 tells us exactly what the ideas are that interest Segment 1 (it’s about health specifics), and therefore we end up with some direction about creating new products designed specifically for this mindset. Furthermore, we’re likely to be a lot more successful appealing to this group, which is homogeneous in what they like about cheese. We don’t have to “boil the ocean” to create a success.
The bottom line here is that with Mind Genomics we’re able to get underneath what people say about cheese, to get a sense of what really matters. And we know that people cannot game the system. At the end of the day, it’s all about product features for some and very little about the efforts of companies to enhance their brand images. And, for a specific set of like-minded consumers, it’s about an almost overwhelming attachment to health messages.
--- PAGE BREAK ---
Case History No. 2: Discover the Sensory Mindset for Texture
When people talk about foods, some talk about what the food tastes like, others talk about the features of the food, and still others talk about the food and health. At a meeting on texture, we were confronted by the very simple, seductive question: Is there a group of people who respond to texture? Can Mind Genomics discover this group?
The question itself is intriguing. We know that there are person-to-person differences in what people like. Just walk down any supermarket aisle to see dozens of different flavors of pasta sauces, coffees, teas, cookies, and so forth. We know from Mind Genomics that when we deal with a product such as coffee we can divide people into different segments based upon the way they respond to messages about flavor, packaging, brand, and so forth. Just see Table 2.
But what about using Mind Genomics in a far deeper way—to uncover the way people respond to the sensory input of products? We investigated this problem with our by now (2011) standard web tool, RDE. Our approach was fairly simple. We began with a hypothetical healthful yogurt. We created six silos, one for the way the snack looked, the second for the way it tasted, and so forth.
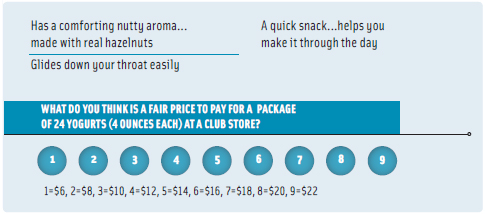 We then instructed the respondents to select a dollar value that they would pay for a pack of 24 4-oz yogurts at a club store. This rating, substituting dollars (an economic indicator) for liking (an attitudinal indicator), changes the task, making it more stringent. We wanted to find out whether there was a group of people who would actually pay more for a positive texture experience. Our instructions appear in Figure 2.
Our analysis was the same. For each respondent, we related the presence/absence of the 36 elements to the dollars that the respondent would pay. We used OLS regression but didn’t estimate the additive constant since our assumption was that without any elements in the vignette no one would want to pay for the product. OLS regression returned with a dollar value for each element, for each respondent, 36 dollar values in all. We went further. Statisticians gave us tools such as clustering that allow us to divide the respondents into complementary groups. The respondents in a group, or cluster, are similar to each other in the pattern of the dollars they will pay for sensory experiences. This is a perfect way to look for our texture segment. Are there individuals who will pay for the texture experience?
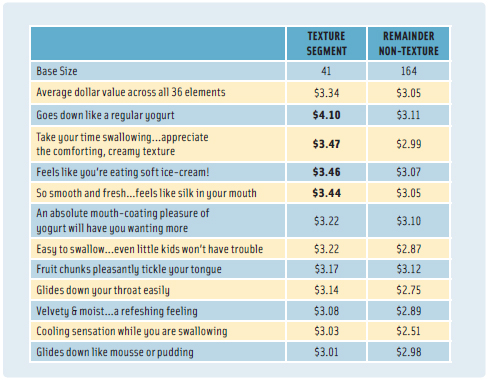 When it came time to divide the 205 participants, we ended up dividing the group into six clusters or segments. Only one cluster, with 41 out of the 205 respondents, was willing to pay more money for good texture experiences. The remaining 164 respondents were not. We had found our texture segment in the population through Mind Genomics as Table 3 shows.
There was one thing left—to identify a person as a texture seeker. Just knowing that there is a texture segment (“texture-heads”) in the population isn’t enough. That’s scientific knowledge to be sure. But how do we use this knowledge? What about creating a panel of these texture-heads (as it were) and have them guide product developers? All we need to do is have a way to find these texture-heads in the general population. The problem is that these people don’t know they are texture oriented, and there’s nothing about them, not who they are, not what they do, nor even what they feel about food, that tells us, “here is a texture head.”
Fortunately, statisticians have given us another gift, DFA, or discriminant function analysis, a statistical method that predicts membership in a group from certain key indicators about the person. DFA can be used to assign people to segments.
--- PAGE BREAK ---
Food scientists will recognize the concept of DFA; it’s commonly used to identify characteristics of foods that go along with certain behaviors such as food spoiling quickly. DFA ends up being a weighting system; get the right variables, give them the right weights using DFA’s classification functions, and you’re in business. You can assign new people to segments.
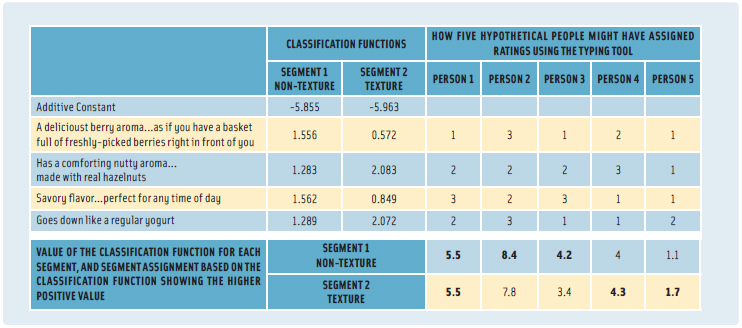 Now apply the same statistical rigor to finding our texture-heads. Using DFA and the elements, respondents were asked to rate four questions on a 3-point scale. The underlying computations (Table 4) and quickly identify the mindset segment to which the respondent belongs (non-texture head vs texture head). And with that, we’re off to develop products, not based upon who a person is or what a person does, but rather to develop products designed to please the inner person, the internal mindset segment to which the person belongs.
Case History No. 3: Beyond Interest to Emotion
Let’s move now beyond products and deconstruct the reaction to major events in the food industry, specifically the March 2011 earthquake in Japan, and what that did to people’s feelings about food. We know that we can ask people to tell us whether they trust food from Japan and that we will get answers, often politically correct ones. But what happens when we use RDE to probe more deeply? Can we attach value to the different elements about the earthquake? And can Mind Genomics uncover linkages between these elements and emotions?
We began our Mind Genomics study by identifying 36 elements, six silos, each with six elements. These are the factoids, the information, the elements that RDE combines into small, easy-to-understand vignettes. Respondents were asked to read the vignettes about food from Japan and rate their feelings on two attributes: interest in buying food from Japan (overall evaluation) and immediate feeling after reading the vignette (selected from a set of five alternatives that included nervous, suspicious, confused, informed, and protected). Again, it’s important to stress that our respondents each saw 48 different vignettes, and every respondent saw a unique set of vignettes. All 36 elements appeared, each five times. Too much was happening for respondents to game answers.
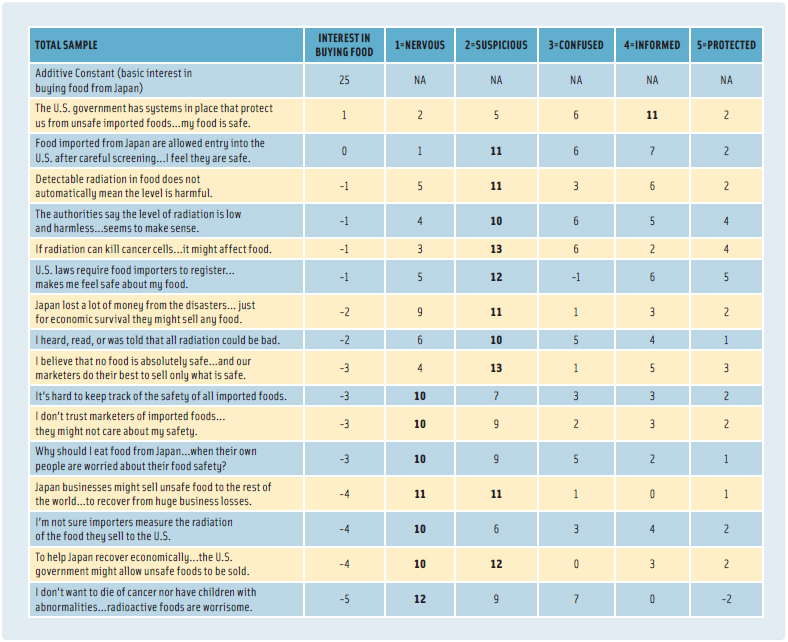 This time we did two analyses. First we looked at the degree to which each element drives one to feel comfortable about buying food from Japan. Table 5 shows us that no matter how hard we tried, respondents were really not particularly interested in buying food from Japan. (The study was run in March 2011.) The additive constant is low, 25, meaning that without elements, only one respondent in four would be prepared to assign a communication about food from Japan a rating of 7–9. It’s the elements that have to do the work, but no elements were capable of doing so, at least as of March 2011. It’s not always what motivates people that is the key take-away from a test. That which doesn’t motivate them is equally important. But there is more. The importance of our study is not necessarily in the column labeled interest, but rather in columns 1–5, corresponding to the five feelings/emotions. The second question presented to respondents instructed them to select the emotion felt after reading the vignette. We use OLS regression to link together the element and the selection of the emotion from the five alternatives. Here’s a summary of what we found.
1) Most of the elements are linked with “nervous” and then “suspicious.”
2) There is only one element that really links with “informed.” It reads as follows: “The U.S. government has systems in place that protect us from unsafe imported foods ... my food is safe.”
3) The elements do not link with “confused” nor do they link with “protected.”
--- PAGE BREAK ---
4) The numbers in Table 5 (columns from suspicious to nervous) are the linkages to each element, and the percent of times in a vignette of 3.75 elements that the particular feeling/emotion would be chosen when the element was presented.
What we have just done is move from the product to the food situation and introduce feelings/emotions to the RDE tool and Mind Genomics. We didn’t have to limit ourselves to the Japan earthquake. We could just as easily have presented the respondent with vignettes about a food, with the elements being food features, brands, or reassurance. Our linkages would then be between emotions and the more typical food elements that we encounter—whether product features, brand, or reassurance.
Where Will Mind Genomics Lead Us?
In this rather whirlwind tour of Mind Genomics we’ve introduced a new concept: That it’s possible to understand what’s important to people in their everyday lives. Whether this knowledge is about the features of products, about finding mindsets in the population for directed development, or about specific general problems such as food quality from Japan and the way people feel emotionally, the newly emerging field of Mind Genomics may be in a position to make a contribution. It’s important to keep in mind that Mind Genomics emerges from induction, from uncovering patterns in nature at the level of ordinary experience, and then hypothesizing about the structure of the everyday experience.
But beyond the science are the applications. Of what value is it to know what’s important for a person as he thinks about cheese? Is there value in knowing about the existence of texture heads—groups of people who pay attention to texture far more than others do? And what is the value of gaining insights into the factors that frighten a person about a food safety problem such as the radioactivity in Japanese food due to the earthquake? The value right now is knowledge—knowledge of the world, knowledge gained the old-fashioned way, by experiment. The value in a year or two might well be more targeted development, more targeted sales, and hopefully more satisfaction with the foods we buy and consume.
Howard Moskowitz, Ph.D., a Professional Member of IFT, is CEO of i-Novation Inc. and President of Moskowitz Jacobs Inc., 1025 Westchester Ave., Suite 400, White Plains, N.Y. 10604 ([email protected]).
Michele Reisner, a Professional Member of IFT, is Vice President of Research, Moskowitz Jacobs Inc. ([email protected]) .
The data from study No. 1 on cheese came from the Healthy You!© Mega Study, courtesy of It! Ventures LLC.
The data from study No. 2 on texture mindsets was presented in part at the Research Chefs of America annual conference in Atlanta, Ga., March 2011. The data and the graphics will appear in a chapter titled “Mind Genomics and Texture—The Experimental Science of Everyday Life” in Food Texture Design and Optimization, eds. Yadunandan L. Dar and Joseph M. Li. Wiley-Blackwell, Ames, Iowa.
The data from Study No. 3 on food concerns and the Japanese earthquake was presented in part by Aurora Saulo at the IFT Annual Conference & Food Expo in New Orleans, La., June 13, 2011.
FOR FURTHER READING
Experimental Design
Box, G.E.P., Hunter, J. & Hunter, S. 1978. Statistics for Experimenters. John Wiley, New York.
Mind Genomics
Moskowitz, H.R., German, J.B., and Saguy, I.S. 2005. Unveiling health attitudes and creating good-for-you foods: The genomics metaphor, consumer innovative web based technologies. CRC Critical Reviews in Food Science and Nutrition 45: 165-191.
Moskowitz, H.R., Poretta, S., and Silcher, M. 2005. Concept Research in Food Product Design & Development. Blackwell Publishing Professional, Ames, Iowa.
Moskowitz, H.R., & Gofman, A. 2007. Selling Blue Elephants: How to Make Great Products that People Want Before They Even Know They Want Them. Wharton School Publishing, Upper Saddle River, N.J. www.SellingBlueElephants.com; www.mindgenomics.org.
Rule Developing Experimentation
Moskowitz, H.R., Gofman, A., Itty, B., Katz, R., Manchaiah, M., and Ma, Z. 2001. Rapid, inexpensive, actionable concept generation and optimization—the use and promise of self-authoring conjoint analysis for the foodservice industry. Food Service Technology 1: 149-168.